


Abstract
Current SPECT radioligands available for in vivo imaging of the dopamine transporter (DAT) also show affinity for monoamine transporters other than DAT, especially the serotonin transporter (SERT). The effect of this lack of selectivity for in vivo imaging is unknown. In this study, we compared the SPECT radioligands 123I-2-β-carbomethoxy-3β-(4-iodophenyl)-N-(3-fluoropropyl)nortropane (123I-FP-CIT) and 123I-N-(3-iodoprop-2E-enyl)-2-β-carbomethoxy-3β-(4-methylphenyl) (123I-PE2I). 123I-FP-CIT has a 10-fold higher selectivity than 123I-FP-CIT for DAT versus SERT. Methods: Sixteen healthy individuals were scanned in random order with both radioligands. The radioligands were administered according to standard recommendations: 123I-FP-CIT was given as a bolus injection, and the ratio between the striatum and reference tissue was measured after 3 h. 123I-PE2I was administered in a bolus–infusion setup, and the nondisplaceable binding potential (BPND) was measured after 2 h. To assess the contribution of SERT to the overall SPECT signal, SERT was blocked by intravenous citalopram in 6 of the individuals. Results: The striatum-to-reference ratio − 1 of 123I-FP-CIT was on average 18% higher than the striatal BPND of 123I-PE2I. Equal doses of radioactivity resulted in 3 times higher counting rates for 123I-FP-CIT than for 123I-PE2I, both in target and in reference brain regions. Citalopram infusion led to significant reductions in both striatal (22.8% ± 20.4%, P < 0.05) and thalamic (63.0% ± 47.9%, P < 0.05) 123I-FP-CIT binding ratios, whereas BPND of 123I-PE2I was unaltered. Likewise, blocking of SERT led to increased (21% ± 30.1%, P < 0.001) plasma 123I-FP-CIT, probably as a result of significant blocking of peripheral SERT binding sites. By contrast, plasma 123I-PE2I remained stable. Conclusion: 123I-FP-CIT and 123I-PE2I had approximately the same target-to-background ratios, but per injected megabecquerel, 123I-FP-CIT gave rise to 3-fold higher cerebral counting rates. We found that 123I-FP-CIT, but not 123I-PE2I, brain images have a highly interindividual but significant signal contribution from SERT. Whether the SERT signal contribution is of clinical importance needs to be established in future patient studies.
Cocaine labeled with 11C was the first radioligand to be used for imaging the cerebral dopamine transporter (DAT) in vivo (1), but several other radioligands have subsequently been developed and tested as PET or SPECT ligands. With the introduction of 2-β-carbomethoxy-3β-(4-iodophenyl)tropane (123I-β-CIT) in 1991 (2), brain imaging of the DAT became a clinically useful method for supplementary diagnosis of movement disorders. A couple of serious drawbacks with 123I-β-CIT are that the radioligand has equal affinity for DATs and serotonin transporters (SERT) and that the slow kinetics of the ligand require imaging to be conducted 24 h after bolus injection.
2-β-carbomethoxy-3β-(4-iodophenyl)-N-(3-fluoropropyl)nortropane (FP-CIT) was synthesized in 1994 (3); its cerebral distribution and dosimetry in healthy volunteers was subsequently reported by Booij et al. in 1998 (4). 123I-FP-CIT, compared with 123I-β-CIT, has an improved selectivity for DAT versus SERT (Table 1), and because of its lower DAT affinity 123I-FP-CIT has much faster kinetic properties, with a striatal peak time at 148 min after intravenous injection. Faster kinetic properties mean that with 123I-FP-CIT, the time between tracer injection and SPECT could be reduced to 3 h, making it more feasible for use in the scanning of outpatients (5). With a bolus injection and without measurements of the arterial input function, the outcome parameter (usually the binding ratio between a target and a reference region) does, however, become sensitive to intersubject variation in the plasma clearance rate of the radioligand (6). 123I-FP-CIT was licensed as DaTSCAN (Amersham Health) in Europe in 2000, and since then it has become a frequently used SPECT radioligand, particularly as an ancillary tool to diagnose patients with movement disorders. In 2006, more than 500 European SPECT centers were using 123I-FP-CIT for clinical purposes (7). The radioligand has also been widely used in both preclinical and clinical studies; a PubMed search in January 2010 shows that 123I-FP-CIT currently is mentioned in over 275 scientific papers.
SERT and DAT Binding Affinity of Inhibitor (Ki), as Measured in Rat Brain Homogenates
123I-labeled N-(3-iodoprop-2E-enyl)-2-β-carbomethoxy-3β-(4-methylphenyl), named PE2I (MAP Medical Technologies), was synthesized in 1997 (8), and a dosimetry study in humans was published in 1998 (9). The ligand has about a 30-fold higher affinity for DAT than for SERT (Table 1), and because of its lower affinity to DAT 123I-PE2I has faster kinetics than 123I-FP-CIT, with a striatal peak time between 30 and 60 min. Quantification of 123I-PE2I binding to DAT is possible using kinetic or graphical analysis after bolus injection of the tracer and SPECT for 90 min or as a combination of bolus and constant infusion, for which unvarying levels in plasma and brain tissue are achieved after approximately 2 h (10,11). PE2I has also proven suitable as an 11C-labeled PET probe (12). In 123I-labeled form, neither PE2I nor FP-CIT gives rise to radiolabeled metabolites that can permeate the blood–brain barrier (13,14). Despite its favorable properties, 123I-PE2I is currently not licensed as a SPECT radioligand for clinical use.
The aim of this study was to compare 123I-PE2I and 123I-FP-CIT in a head-to-head design in terms of their binding parameters in various brain regions of interest (ROIs) and examine the significance of the SERT contribution to the total signal. The contribution was addressed by blocking the SERT with acute citalopram (Seropram; Lundbeck A/S) infusion.
MATERIALS AND METHODS
Sixteen healthy individuals (mean age ± SD, 43.1 ± 16.7 y; age range, 21–69 y; 10 men) were included; a diagram of the study design is shown in Figure 1. All subjects gave written informed consent. The study was performed in accordance with the ethical standards of the Declaration of Helsinki and was approved by the ethical committee of Copenhagen Capital Region (protocol H-B-2008-024).

Flowchart of study design. Ten subjects were randomized to receive either 123I-PE2I or 123I-FP-CIT for first scan. Six additional subjects were randomized to receive either 123I-PE2I or 123I-FP-CIT for baseline scan before corresponding citalopram challenge scan. To use all baseline experiments for head-to-head comparison of 123I-PE2I or 123I-FP-CIT, we also included baseline (i.e., without drug) experiments from citalopram experiments, so that total number of individuals with baseline and no-drug experiments was 16.
The healthy volunteers were recruited through advertising on the Internet or in newspapers. None of the subjects had any history of neurologic or psychiatric disorders, and they all claimed no drug or alcohol abuse. None smoked, nor were any taking medication. Cerebral MRI scans were obtained before the first SPECT scan, to exclude structural abnormalities and signs of vascular pathology. The results of routine urine drug tests and routine blood tests were normal in all subjects.
Experimental Procedures
Radioligand Administration.
Cannulas were inserted into both cubital veins for radioligand administration and blood sampling. To block thyroidal uptake of free radioiodine, all subjects received 200 mg of potassium perchloride intravenously 30 min before either 123I-PE2I or 123I-FP-CIT injection.
Baseline Experiments.
In 10 subjects, the radioligands were administered according to standardized protocols, adapted to the differences in the kinetic properties (5,10).
123I-PE2I.
A bolus–infusion protocol of 2.7 (i.e., the bolus is worth 2.7 h of infusion) was used (10,11). An average intravenous bolus of 2.0 ± 0.1 mL (mean, 77.1 MBq [range, 65.3–91.7 MBq]) of 123I-PE2I was administered. The intravenous bolus was immediately followed by a constant infusion (for a total of 3 h) of 3 ± 0.1 mL (mean, 103.7 MBq [range, 92.3–124.2 MBq]) of 123I-PE2I dissolved in 43 mL of saline. The mean injected mass of PE2I was 1 × 10⁻³ μg/mL. Six SPECT acquisitions, each lasting 10 min, were obtained between 120 and 180 min after 123I-PE2I injection.
123I-FP-CIT.
An average intravenous bolus of 2.0 ± 0.1 mL (mean, 190.2 MBq [range, 184.3–202.2 MBq]) of 123I-FP-CIT was administered. The mean injected mass of FP-CIT was 0.1 μg/mL. Six SPECT acquisitions, each lasting 10 min, were obtained between 180 and 240 min after 123I-FP-CIT injection.
There was an average of 10 d (range, 7 to 14 d) between the 123I-FP-CIT and 123I-PE2I scan; scans were acquired in randomized order.
Citalopram Experiments.
Six additional subjects participated in a citalopram experiment. Citalopram (40 mg/mL) was given at a dose of 0.15 mg/kg of body weight. The infusion lasted 30 min and was administered using an infusion pump.
For 123I-FP-CIT, the subjects underwent 2 SPECT scannings (1 d apart): a baseline scan and second scan that was immediately preceded by citalopram injection before the SPECT acquisition. For both scans, 24 × 10-min acquisitions (complete time–activity curves) were obtained between 0 and 240 min.
For 123I-PE2I, the subjects underwent only 1 SPECT scanning. The acquisition was extended to 1 h, with a maintained bolus-to-infusion ratio. One hundred minutes after 123I-PE2I injection, a 40-min baseline scan was obtained, and then citalopram infusion was started and scanning data were acquired for an additional 100 min. Frames from 100 to 140 and from 140 to 240 min (8 × 5 and 10 × 10 min, respectively) were obtained.
All subjects were monitored with standard electrocardiogram and blood pressure measurements.
Blood Sampling.
Venous blood was collected every 10 min at the SPECT frame mid time. The sample was centrifuged, plasma was collected, and octanol was added to derive the lipophilic phase containing the radioligand parent compound (14). The sample was shaken and centrifuged, the octanol phase was pipetted into a counting vial, and, finally, radioactivity was measured in a γ-counter (Cobra II; Packard Instrument Co.).
Citalopram concentrations in blood were measured at 30 and 90 min after citalopram injection.
SPECT Acquisition and Image Reconstruction.
SPECT images were acquired with a triple-head IRIX camera (Philips Medical) fitted with low-energy, general all-purpose, parallel-hole collimators (spatial resolution, 8.5 mm at 10 cm). The mean radius of rotation was 15.2 cm. Each head covered 120° of the circular orbit. Scans were obtained and stored at fixed angles, with an angular interval of 3°.
The images were reconstructed with a MATLAB 6.5 (The MathWorks)–based program in 128 × 128 matrices (2.33-mm pixels and identical slice thickness) using standard filtered backprojection with a low-pass fourth-order Butterworth filter at 0.3 Nyquist (0.64 cm−1). This method is discussed in further detail in the study by Ziebell et al. (15).
ROIs
ROIs were manually delineated because we previously have shown that manually derived delineation is comparable to MRI-guided ROI delineation in DAT SPECT quantification (15). This comparability is probably because these small ROIs can move easily out of the hot spot, despite the use of external fiducial markers, which should improve coregistration accuracy. Therefore, delineation of ROIs in DAT SPECT images is only a close estimate but never a 100% exact anatomic ROI with regard to the size, shape, and positioning, no matter the method used (manual delineation directly on the SPECT image, population-based template-guided delineation, delineation based on coregistration with another brain image that provides structural information, such as MRI) (15).
The ROIs were outlined by 1 delineator with more than 5 y of experience; in the case of the 123I-FP-CIT scans, the delineator was unaware of whether citalopram had been administered. ROIs were delineated directly on the reconstructed SPECT images, guided by the use of Kretschmann and Weinrich's neuroanatomic atlas (16). Direct adaptation of ROI coordinates from the atlas required the use of a MATLAB program (The MathWorks) adapted in-house to reorient the reconstructed images to the canthomeatally oriented plane. ROIs were delineated on 5 consecutive slices (2.3 mm/slice) in a summed image from all SPECT frames acquired from the scanning.
The ROIs were first randomly delineated either on the 123I-FP-CIT image or on the 123I-PE2I image. Then the 2 images were coregistered using visual assessment, and the ROI was transferred to the image of the other radioligand. Finally, the placement of the ROIs was adjusted to get the maximum counts per ROI, without changing the size or shape of the ROI. ROIs were optimized to eliminate coregistration errors.
Derivation of Binding Parameters
Because 123I-FP-CIT is administered as a bolus alone and 123I-PE2I as a bolus followed by a constant infusion, binding parameters are not directly comparable in the baseline experiments (n = 10). In these experiments, 123I-FP-CIT was measured from 3 to 4 h after bolus injection, and 123I-FP-CIT was therefore not in a true steady-state condition. With 123I-PE2I, however, specific binding to nondisplaceable binding is measured at steady-state conditions, which are reached between 100 and 180 min (10).
It is only at true steady-state conditions that the ratio of specific to nondisplaceable binding is equal to the binding potential of the nondisplaceable radioligand (BPND) (17). Therefore, in the 123I-FP-CIT baseline experiments we refer to the outcome as binding ratios and not BPND.
BPND was calculated as:
where nondisplaceable equals the sum of the free and nonspecific bound radioligand concentration represented by the cerebellum, which is assumed to be devoid of DAT.
To do an exact comparison of BPND between the 2 radioligands in the citalopram experiments (n = 6), we had to calculate true 123I-FP-CIT BPND, which is done by obtaining full 123I-FP-CIT time–activity curves and applying simplified reference tissue modeling (SRTM) (18). 123I-PE2I is in true a steady-state condition; thus, we could conduct a within-scan pharmacologic SERT displacement with citalopram while continuing to acquire the time–activity curves. SRTM was performed with PMOD software (version 3.0; PMOD Technologies).
Changes in the plasma concentrations of the radioligand after citalopram administration were calculated differently for the 2 radiotracers. For 123I-FP-CIT, we used the plasma time–activity data to calculate the area under the curve, and for 123I-PE2I we took advantage of 123I-PE2I attaining tracer steady state and simply compared plasma concentration before, during, and after the pharmacologic challenge.
Statistical Analysis
All statistical analyses were performed with GraphPad Prism (version 5.00; GraphPad Software Inc.). Unless otherwise stated, all values are given as mean ± SD.
A 2-tailed paired t test was used to compare binding ratios and BPND values obtained with the 2 radioligands. P values below 0.05 were considered statistically significant. All values are given with 95% confidence interval. Because of the small sample size in the citalopram experiments (n = 6), we used a nonparametric Wilcoxon matched-pairs signed rank sum test.
RESULTS
Counting Rates and Binding
Compared with 123I-PE2I, for 123I-FP-CIT the average counting rates were 3.0 ± 0.9 (range, 1.7–4.8) times higher in the striatum, 3.4 ± 0.9 (range, 2.1–5.6) times higher in the thalamus, and 2.7 ± 0.6 (range, 1.7–4.0) times higher in the cerebellum. The individual striatal- and thalamic-to-cerebellum binding ratios or BPNDs are shown in Figure 2. The average binding ratio was 3.6 ± 0.7 for 123I-FP-CIT, which was significantly higher than the BPND of 3.0 ± 0.5 for 123I-PE2I (t test, P < 0.005). One individual had an 123I-FP-CIT binding ratio lower than the 123I-PE2I BPND; the remaining 15 individuals had between 0% and 30% higher 123I-FP-CIT binding ratios. The average thalamus–to–cerebellum binding ratio was 0.9 ± 0.3 for 123I-FP-CIT—significantly higher than the BPND of 0.5 ± 0.2 for 123I-PE2I (t test, P < 0.001). Seen consistently in all individuals, the individual thalamus binding ratio was between 10% and 800% higher for 123I-FP-CIT than the BPND was for 123I-PE2I. Because the thalamus has 20 times more SERT than DAT binding sites and the proportions are opposite in the striatum (19–21), we calculated the thalamic-to-striatal ratio as proxy for in vivo DAT selectivity (Fig. 3). This ratio was 46% higher for 123I-FP-CIT than for 123I-PE2I (t test, P < 0.005). For both radioligands, the ratio of caudate to putamen binding was not significantly different from 1 (t test, P > 0.1). Finally, the standard reference regions were compared; there was no statistically significant difference for either radioligand between mean counts in occipital cortex and cerebellum (t test, P > 0.5).

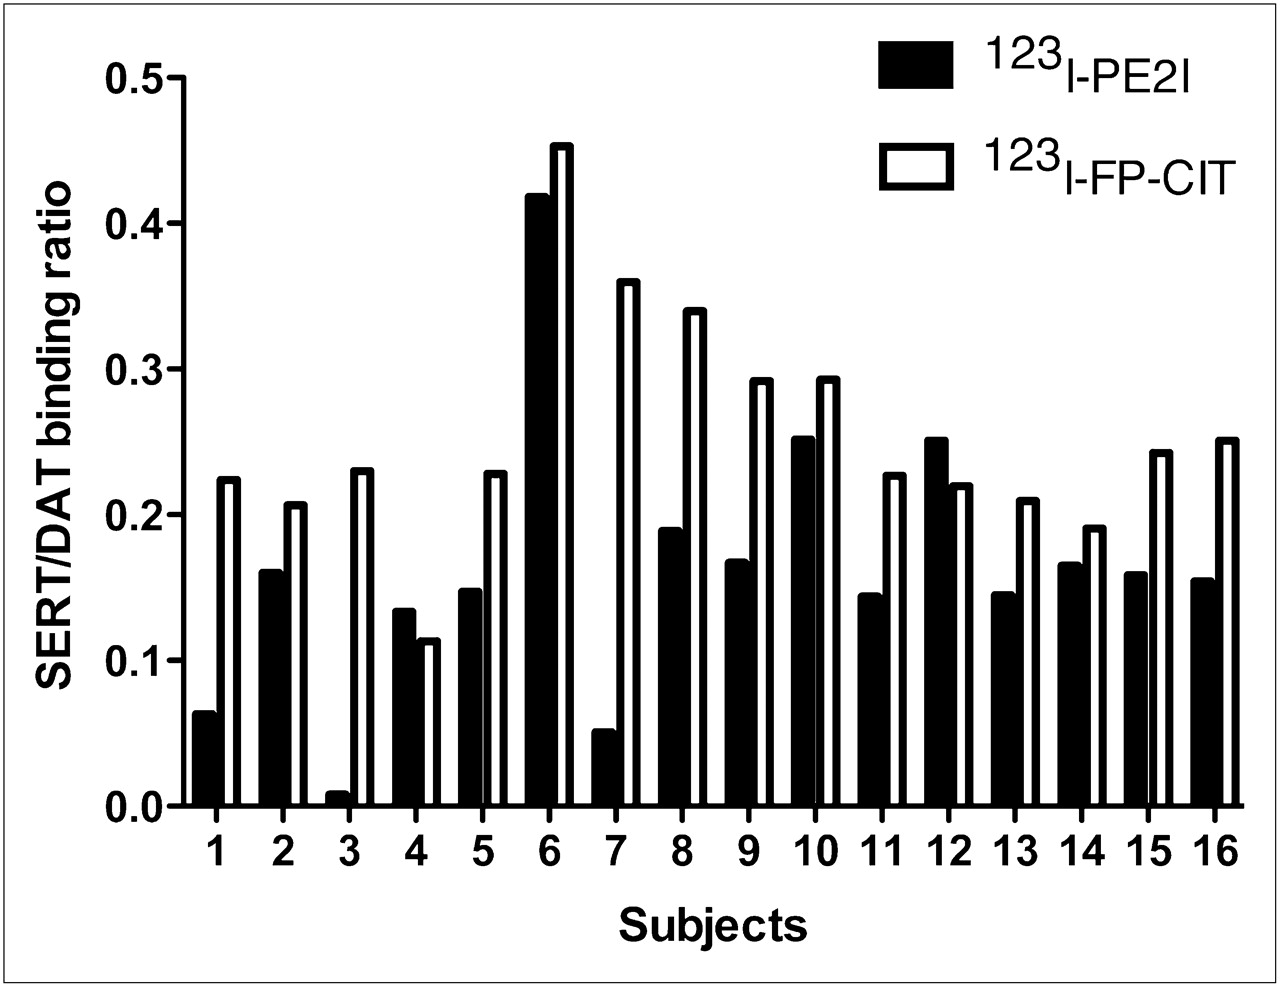
Individual ratios of specific to nonspecific striatal binding (n = 16). 123I-FP-CIT binding ratio is significantly higher than 123I-PE2I BPND (t test, P < 0.05).

123I-PE2I image (left) and 123I-FP-CIT image (right) of same individual. In first 2 rows (sagittal and horizontal slices), thalamus is clearly visualized in 123I-FP-CIT image (arrows). Bottom row shows images after acute SERT blocking with citalopram.
Citalopram Experiments
All subjects, except for 1, received the planned dose of 0.15 mg of citalopram per kilogram of body weight. One volunteer experienced nausea and vomiting 15 min after citalopram administration was initiated; therefore, the infusion was stopped (at the current dose of 0.11 mg/kg) and symptoms disappeared within a few minutes. For the second scan, 0.11 mg of citalopram per kilogram was administered over 30 min (as in the first scan), and this time the subject did not experience any side effects. One subject had a mild drop in blood pressure, from 110 to 95 mm Hg, lasting for 2 h. The other 5 volunteers felt slightly lightheaded for a few minutes toward the end of the infusion, but this effect disappeared a few minutes after citalopram infusion was terminated. The mean plasma citalopram concentration at 30 and 90 min after radiotracer injection was 52.2 ± 11.4 and 47.3 ± 9.6 nmol/L, respectively. No difference in mean plasma citalopram concentrations between the 2 radioligands was observed: 123I-FP-CIT, 47.0 ± 10.0 nmol/L, and 123I-PE2I, 52.4 ± 11.0 nmol/L. After administration of citalopram, compared with the unblocked condition, the area under the curve of the venous blood samples for 123I-FP-CIT (from 0 to 240 min) increased by 21.2% (range, 1.6%–82.0%) (Wilcoxon, P < 0.05). By contrast, citalopram infusion did not alter 123I-PE2I plasma radioactivity. Acute citalopram treatment resulted in an average decrease in 123I-FP-CIT BPND values of 22.8% (range, −9.0%–43.2%) in the striatum (Wilcoxon, P < 0.05) and of 63.0% (range, 19.0%–131.3%) in the thalamus (Wilcoxon, P < 0.05). When the ratio method (based on 180–240 min) was used instead, these numbers were 15.6% (range, 0.5%–38.0%) and 86.3% (range, 25.2%–125.7%). There was no correlation between the relative decrease in BPND in the striatum and thalamus within the single individual.
For 123I-PE2I, citalopram infusion did not alter BPND in the striatum or thalamus (Wilcoxon, P > 0.1). Figure 4 shows 123I-PE2I and 123I-FP-CIT images retrieved for the same individual; binding in the thalamus is easily appreciated in the 123I-FP-CIT image, disappearing after citalopram infusion. The individual BPND in relation to the citalopram infusion is shown in Figures 5A and 5B. Figure 5C illustrates how the individual striatal BPND obtained from 123I-FP-CIT approximates the BPND obtained with 123I-PE2I after citalopram infusion. For 123I-FP-CIT, the SRTM fitted the time–activity curve from 0 to 240 min. We estimated the distribution volume in the cerebellum—that is, the ratio of the total concentration of radioligand in the cerebellum to the total concentration of radioligand in plasma, using the venous blood samples from 0 to 240 min. This distribution volume was 1.5 ± 0.6 Bq/mL (brain)/Bq/mL (blood) for 123I-PE2I and 5.5 ± 2.0 for 123I-FP-CIT. In all 6 individuals, the SRTM-determined BPND obtained with 123I-FP-CIT at baseline was significantly higher than BPND for 123I-PE2I: 123I-FP-CIT, 4.2 ± 0.7, and 123I-PE2I, 3.1 ± 0.4 (Wilcoxon, P < 0.05). This difference was, however, highly variable among the individuals, ranging from 5% to 93%. The difference between 123I-PE2I BPND and 123I-FP-CIT binding ratio disappeared after citalopram infusion: 123I-FP-CIT, 3.3 ± 0.4, and 123I-PE2I, 3.3 ± 0.4 (Wilcoxon, P > 0.2).
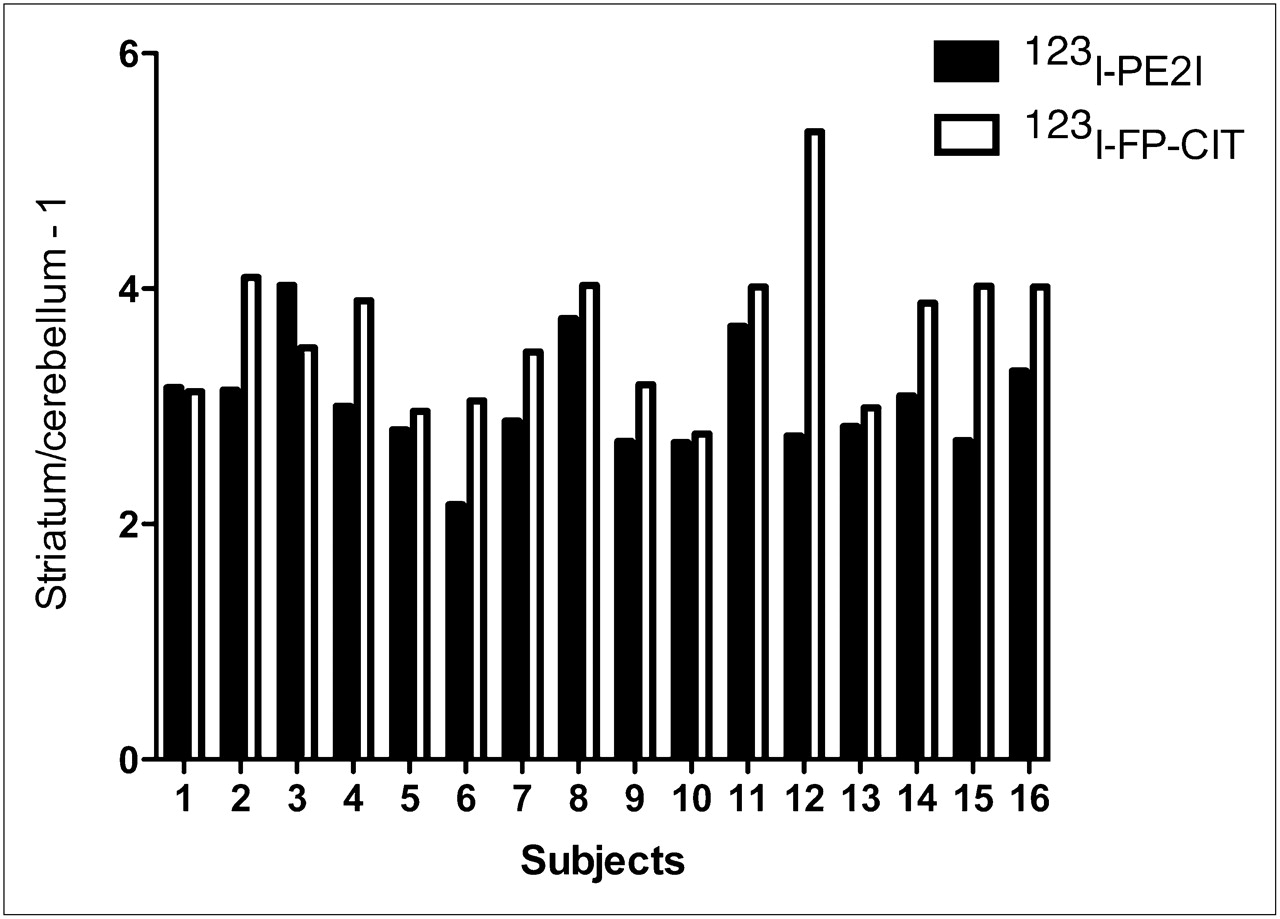
As proxy for in vivo SERT and DAT selectivity of 123I-PE2I and 123I-FP-CIT, individual specific-to-nonspecific ratio in thalamus to individual specific-to-nonspecific ratio in striatum is shown. Ratio for 123I-FP-CIT is significantly higher than for 123I-PE2I (t test, P < 0.005, n = 16).
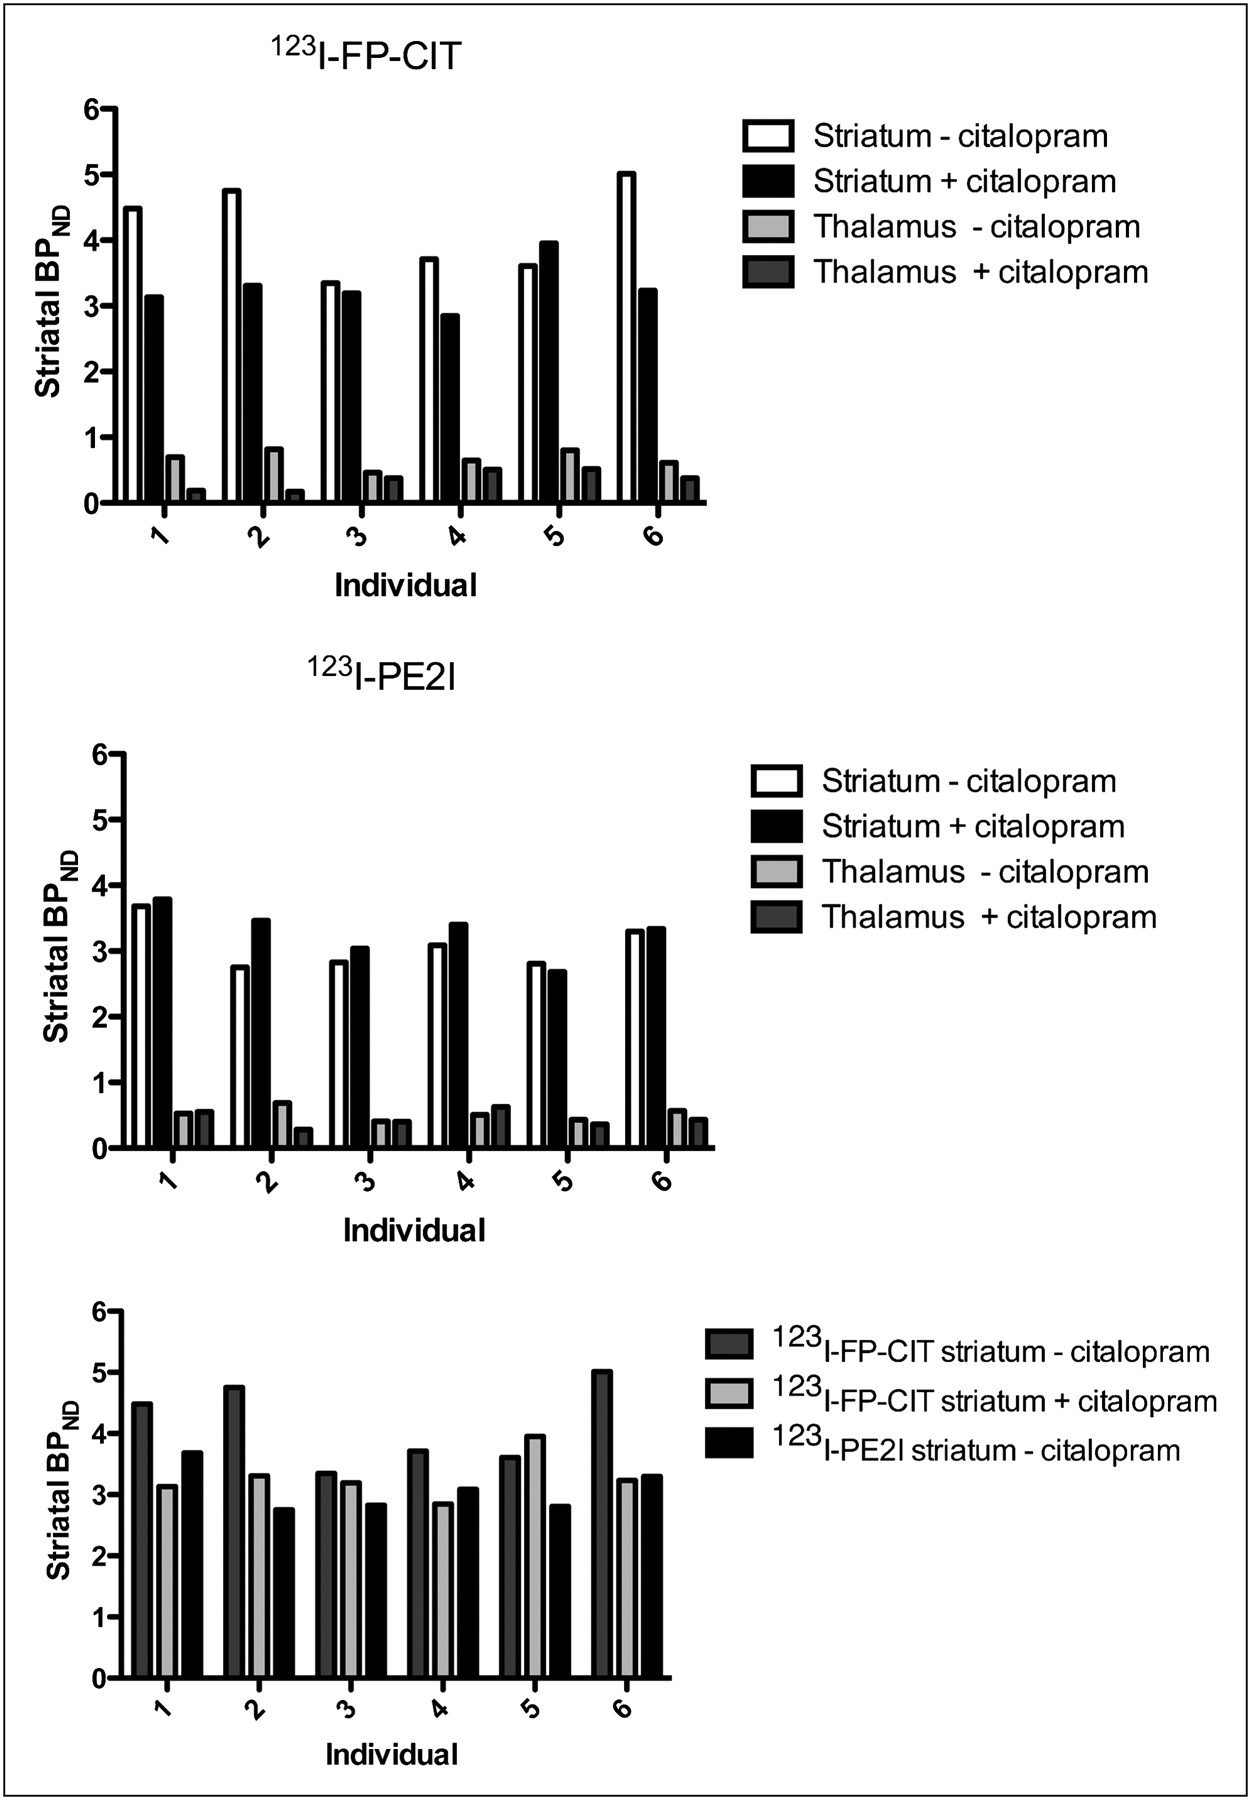
Response to citalopram infusion, expressed as change in BPND in striatum and thalamus. BPND for 123I-FP-CIT was calculated with SRTM; BPND for 123I-PE2I was calculated as ratio between steady-state tissue levels. (C) BPND for 123I-FP-CIT approaches BPND for 123I-PE2I after SERT blocking. Same subject was used for all experiments.
There was no significant difference in BPND and simple binding ratio obtained from 180 to 240 min after 123I-FP-CIT injection (Wilcoxon, P > 0.5). The individual terminal venous plasma clearance was stable; on average, it decreased 5.9% per hour in the fourth hour after bolus injection.
DISCUSSION
To our knowledge, this is the first study of a head-to-head design to compare DAT and SERT binding properties of the 2 SPECT DAT radioligands 123I-PE2I and 123I-FP-CIT and to assess the contribution of SERT to the total signal. In this study, we found 3-fold higher brain counting rates per injected megabecquerel for 123I-FP-CIT than for 123I-PE2I. The ratio of striatal specific to nondisplaceable binding for 123I-FP-CIT was almost 20% higher than the BPND of 123I-PE2I, but after acute blocking of SERT with citalopram no significant difference in the specific-to-nondisplaceable striatal binding of 123I-FP-CIT versus 123I-PE2I was observed. Although 123I-PE2I BPND was unaffected by citalopram infusion, 123I-FP-CIT BPND declined significantly. Citalopram infusion increased the plasma concentration of 123I-FP-CIT but not of 123I-PE2I; this increase supported the finding that peripheral SERT binding sites, particularly in the lung tissue (4), were blocked, resulting in a higher availability of 123I-FP-CIT but not of 123I-PE2I.
Count statistics per injected megabecquerel for 123I-FP-CIT are superior to those for 123I-PE2I; these better count statistics are particularly beneficial in patients with low DAT binding. In addition, the higher brain uptake of 123I-FP-CIT is beneficial and, compared with 123I-PE2I, its higher uptake can be translated into a better determination of the target-to-background ratio or into a lower dose of radioactivity by shortening the scanning time.
We chose to compare the 2 radioligands using experimental setups most commonly used in the clinical setting—that is, bolus (123I-FP-CIT) and bolus–infusion (123I-PE2I) schedules. At the time of measurement, 123I-FP-CIT was not in a steady-state condition in plasma or in tissue but was in a transient equilibrium. In theory, the 123I-FP-CIT binding ratio overestimates the steady-state BPND because of the effect of the terminal plasma clearance rate—a problem originally addressed by Carson et al. in 1993 (6). We found, however, that the actual terminal plasma clearance rate was stable, with an average of an approximately 6% decline per hour; second, there was no difference between BPND calculated using SRTM and the binding ratio obtained as a mean from 180 to 240 min after 123I-FP-CIT injection. Thus, transient equilibrium analysis of 123I-FP-CIT does not explain the higher ratio for 123I-FP-CIT than for 123I-PE2I in healthy individuals. As a note of caution, however, altered plasma clearance may occur in patients with, for example, renal diseases or with altered metabolism of 123I-FP-CIT.
We also evaluated the potential confounding effect of SERT on the total striatal signal in what is presumed to be cerebral DAT imaging. Because of the following reasons, our results confirmed in vitro data, suggesting that the higher in vivo binding ratio of nondisplaceable radioligand for 123I-FP-CIT than for 123I-PE2I was related to SERT binding. First, a significantly higher binding was seen in a SERT high-density region, the thalamus, for 123I-FP-CIT than for 123I-PE2I, both in absolute terms and when assessed as the thalamus-to-striatum ratio. Second, acute blockade of SERT before 123I-FP-CIT administration was associated with significantly increased plasma 123I-FP-CIT levels, because of the lower peripheral binding of 123I-FP-CIT. This increased plasma was not seen with 123I-PE2I. Finally, a significant decrease in BPND (average, 24%) of 123I-FP-CIT was observed in the striatum after SERT blocking, whereas no significant change in BPND for 123I-PE2I was observed.
We found a considerable interindividual variability in 123I-FP-CIT binding, both in comparison to 123I-PE2I binding and in response to SERT blockade, with striatal BPND decreases of between −8% and 43% for 123I-FP-CIT. This variability could be because of the SERT density (density of transporters available to radioligand binding [Bavail]), or affinity (Kd) of the SERT for 123I-FP-CIT, Kd of citalopram, or relative DAT versus SERT density ratio in that region. We considered the Kd of citalopram a less likely reason because we did not observe any correlation between the effect of citalopram on BPND for SERT low- and high-density regions.
In theory, if the observed higher striatal target-to-background ratio for 123I-FP-CIT than for 123I-PE2I should be explained by variations in the relative striatal densities of DAT and SERT, and assuming published in vitro Ki values for the radioligands, then the striatal Bavail, DAT–to–Bavail, SERT ratio would need to be below 5:1 (Supplemental Appendix; supplemental materials are available online only at http://jnm.snmjournals.org). Human postmortem brain studies point toward a Bavail, DAT–to–Bavail, SERT ratio of 20:1 in the putamen (∼200:10 pmol/g) (20,21). This ratio could probably vary somewhat in healthy subjects, and a large variation in BPND has indeed been reported in in vivo studies (SD of BPND for SERT, 23% of mean (22,23), and for DAT, 13% of mean (11,24)). Hence, our large decrease in 123I-FP-CIT signal after citalopram blocking suggests that the superiority of 123I-PE2I over 123I-FP-CIT is even more selective in vivo than in vitro.
Acute blocking of the SERT decreased striatal BPND as measured with 123I-FP-CIT, to the same level as that for 123I-PE2I. On the basis of the available in vitro data on 123I-FP-CIT DAT versus SERT selectivity and affinity, the extent to which SERT blocking decreased striatal BPND was larger than expected (Supplemental Appendix). Three previous studies have investigated the striatal 123I-FP-CIT binding in response to semichronic selective serotonin reuptake inhibitor treatment (25–27), and despite reporting significant binding to SERT sites in the lungs, increased—and not decreased—striatal binding ratios were reported. The main difference between these studies and our study is that selective serotonin reuptake inhibitor treatment was not administered acutely or intravenously, but over days and orally. It is possible that the more chronic administration induced alterations in both DAT and SERT, preventing a straightforward interpretation of the data.
Finally, we want to address the fact that BPND is proportional to the free fraction of the nondisplaceable radioligand in the brain (fND). It is hard to imagine that infusion of citalopram should occupy the total amount of protein binding sites in the brain affecting the fND and thereby the nondisplaceable binding of 123I-FP-CIT. Further, if such an effect would occur, it would increase the fND and not decrease it, leading to an increase in 123I-FP-CIT BPND.
CONCLUSION
In the clinic, 123I-FP-CIT has the advantage of the experimental simplicity of a bolus-alone setup, and as we have shown here, this radioligand has a substantially higher brain uptake than 123I-PE2I. The interval between 123I-FP-CIT injection and scanning is 3 h, compared with 2 h for 123I-PE2I, but patients scanned with 123I-PE2I are connected to an infusion pump and therefore restricted in their physical activities during these hours. The bolus–infusion setup is easily implemented for routine use. In our SPECT laboratory, we conduct more than 100 diagnostic 123I-PE2I SPECT scans annually. The number of acquisitions is the same for both radiotracers.
Yet, the simplicity of 123I-FP-CIT administration may compromise exact quantification of the binding. The mode of administration of 123I-FP-CIT makes it susceptible to interindividual variation in the terminal plasma clearance rate of the tracer, which may be a particular problem in medicated patients or in patients with concomitant medical disorders. However, for the healthy unmedicated subjects studied here, the influence of the terminal plasma clearance rate on the outcome parameter is not quantitatively important. The variation in terminal plasma clearance rate is, in theory, eliminated using the bolus–infusion approach we used for 123I-PE2I.
As we have shown in this study, the most important disadvantage of 123I-FP-CIT, compared with 123I-PE2I, is the lack of selectivity for DAT. This lack of selectivity is quantitatively important, as we demonstrated after citalopram blocking or displacement in healthy volunteers. The outcome parameter of a 123I-FP-CIT SPECT experiment is clearly more susceptible to up- and downregulation of striatal SERT and to coadministration of SERT blocking or modulating pharmaceuticals. The inferior DAT selectivity of 123I-FP-CIT, compared with 123I-PE2I, is likely to be more pronounced in patients with low DAT density in the striatum, as demonstrated in the Supplemental Appendix. This inferior selectivity has to be examined in similar studies of patients with low DAT density.
Acknowledgments
We thank Svitlana Olsen and Glenna Skouboe for expert technical assistance and Kirsten Møller, PhD, DMSc, Jesper Poulsen, and Ronni Plovsing for precautionary measures during citalopram infusion. This work was supported by Rigshospitalet, the Lundbeck Foundation, the EC-FP6-project DiMI LSHB-CT-2005-512146, the Toyota Foundation, the University of Copenhagen, and HR (the Capital Region of Denmark). Part of the data were acquired in conjunction with the establishment of a European database of 123I-FP-CIT SPET scans of healthy controls (ENC-DAT) sponsored by the EANM/European Network of Excellence for Brain Imaging.
- © 2010 by Society of Nuclear Medicine
REFERENCES
- Received for publication April 19, 2010.
- Accepted for publication September 7, 2010.


Jump to section
Related Articles
Cited By...
- Integrity of dopaminergic terminals in the caudate nucleus is relevant for rest tremor in Parkinsons disease
- Imaging Dopaminergic Neurotransmission in Neurodegenerative Disorders
- Dopamine transporter in obesity: a meta-analysis
- Serotonin transporter binding and anxiety symptoms in Parkinsons disease
- Analysis of Extrastriatal 123I-FP-CIT Binding Contributes to the Differential Diagnosis of Parkinsonian Diseases
- Relevance of 123I-FP-CIT SPECT brain scans in routine clinical settings
- Use of 11C-PE2I PET in Differential Diagnosis of Parkinsonian Disorders
- Safety Analysis of 10 Clinical Trials and for 13 Years After First Approval of Ioflupane 123I Injection (DaTscan)
- Striatal Dopamine Transporter Binding Does Not Correlate with Clinical Severity in Dementia with Lewy Bodies
- (123I)FP-CIT SPECT in suspected dementia with Lewy bodies: a longitudinal case study
- Assessing the Optimal Time Point for the Measurement of Extrastriatal Serotonin Transporter Binding with 123I-FP-CIT SPECT in Healthy, Male Subjects
- Validation of a Method for Accurate and Highly Reproducible Quantification of Brain Dopamine Transporter SPECT Studies