


Abstract
This study reports on the biodistribution and radiation estimates of 1-(2′-deoxy-2′-18F-fluoro-1-β-d-arabinofuranosyl)-5-bromouracil (18F-FBAU), a potential tracer for imaging DNA synthesis. Methods: Three normal dogs were intravenously administered 18F-FBAU and a dynamic PET scan was performed for 60 min over the upper abdomen followed by a whole-body scan for a total of 150 min. Blood samples were collected at stipulated time intervals to evaluate tracer clearance and metabolism. Tissue samples of various organs were analyzed for tracer uptake and DNA incorporation. Dynamic accumulation of the tracer in different organs was derived from reconstructed PET images. The radiation dosimetry of 18F-FBAU was evaluated using the MIRD method. Results: At 60 min after injection, blood analysis found >90% of the activity in unmetabolized form. At 2 h after injection, 18F-FBAU uptake was highest in proliferating tissues (mean SUVs: marrow, 2.6; small intestine, 4.0), whereas nonproliferative tissues showed little uptake (mean SUVs: muscle, 0.75; lung, 0.70; heart, 0.85; liver, 1.28). Dynamic image analysis over 60 min showed progressive uptake of the tracer in marrow. Extraction studies demonstrated that most of the activity in proliferative tissues was in the acid-insoluble fraction (marrow, 83%; small intestine, 73%), consistent with incorporation into DNA. In nonproliferative tissue, most of the activity was not found in the acid-insoluble fraction (>84% for heart, muscle, and liver). Conclusion: These results demonstrate that 18F-FBAU was resistant to metabolism, readily incorporated into DNA in proliferating tissues, and showed good contrast between organs of variable DNA synthesis. These findings indicate that 18F-FBAU may find use in measuring DNA synthesis with PET.
PET has been extensively used and is the most effective tool to measure tumor metabolism and biochemistry repeatedly and noninvasively. Because of these advantages, PET is routinely used for diagnosis, staging disease, and monitoring therapy in oncology. 18F-FDG is by far the most commonly used tracer for these purposes (1). The increased glycolytic rate of tumor cells is the basis for the development and use of 18F-FDG. Accumulation of 18F-FDG in cells does correlate with malignancy but its use is limited by nonspecific accumulation related to glucose phosphorylation. The development of tracers with potential to directly image cellular proliferation would be particularly useful.
The standard agent used to study proliferation in the laboratory is 3H-thymidine, as it solely incorporates into DNA and corresponds to DNA synthesis. Preclinical and clinical studies of thymidine labeled with 11C (20.2 min) at methyl or ring-2 positions showed rapid catabolism, generating considerable amounts of radioactive recirculating metabolites. The radioactive metabolite contribution to images demands an extensive kinetics modeling (2–5), making 11C-thymidine impractical for routine clinical use. Attempts to develop other nucleosides such as bromodeoxyuridine (6,7) and iododeoxyuridine (8,9) as imaging agents were not very successful because of either dehalogenation or radioactive metabolite production.
These limitations led scientists to search for more stable nucleoside analogs that could be labeled with longer half-life radionuclides. Nucleosides with a substitution of fluoride at the 2′ or 3′ position of the pentose sugar are more resistant to degradation by thymidine phosphorylase in addition to offering a quality labeling choice for clinical PET studies. One promising agent with a 3′ substitution is 18F-3′-deoxy-3′-fluorothymidine (18F-FLT), which is resistant to degradation and trapped intracellularly after phosphorylation, but is not readily incorporated into DNA (10). Examples of a 2′-substituted analog include 11C- and 18F-labeled 2′-fluoro-5-methyl-1-β-d-arabinofuranosyluracil (FMAU), which have proven useful as a PET imaging agent (11,12). Recently, other investigators have synthesized and studied 1-(2′-deoxy-2′-fluoro-1-β-d-arabinofuranosyl)-5-76Br-bromouracil (76Br-FBAU) as a proliferation marker (13–17). Findings indicate that 76Br-FBAU is more stable than thymidine and bromodeoxyuridine and predominantly incorporates into DNA. Reference to the naming of this compound was clarified in the literature (18).
In this study, we report the PET data using clinically advantageous 18F-FBAU (Fig. 1) in normal dogs. By studying metabolism, biodistribution, DNA incorporation, and dosimetry estimates, we validate its use as a proliferation marker.
Structure of FBAU with fluoride in the arabinose position of sugar. Fluorine substitution allows labeling with 18F and makes the molecule resistant to degradation.
MATERIALS AND METHODS
Radiochemistry
No-carrier-added 18F-FBAU was synthesized according to the procedure described by Mangner et al. (19). Briefly, 18F-fluoride produced using a RDS-112 cyclotron and trapped directly on a small ion-exchange column was eluted using a solution of Kryptofix/K2CO3 (Sigma-Aldrich) in N,N-dimethylformamide. Labeling precursor 2-O-[(trifluoromethyl)sulfonyl]-1,3,5-tri-O-benzoyl-α-d-ribofuranose was fluorinated using the 18F/Kryptofix/K2CO3 solution. The resulting product, 2-deoxy-2-18F-fluoro-1,3,5-tri-O-benzoyl-α-d-arabinofuranose, was purified on a silica gel Sep-Pak Light (Waters) and brominated using HBr/acetic acid to facilitate further condensation. The residual brown oil (2-deoxy-2-18F-fluoro-3,5-di-O-benzoyl-α-d-arabinofuranosyl bromide was condensed with 2,4-bis-O-(trimethylsilyl)-5-bromouracil in CHCl3 in the presence of bis(trimethylsilyl)trifluoroacetamide. The resulting α/β-isomeric mixture was purified on a silica gel column and the main fraction, 1-(2-deoxy-2-18F-fluoro-3,5-di-O-benzoyl-β-d-arabinofuranosyl)-5-bromouracil, was hydrolyzed with sodium methoxide in methanol. The desired β-isomer was separated on a semi-prep Econosil C-18 column (10 μm; 10 × 250 mm) using 10% ethanol at a flow rate of 8 mL/min. Overall decay-corrected average radiochemical yields of 18F-FBAU varied between 35% and 42% with >98% radiochemical purity and specific activity >111 GBq/mmol. Total synthesis time was approximately 3 h.
Tracer Uptake Studies
U-937 and MOLT-4 cells were obtained from the American Type Culture Collection. Trace amounts (16–100 nmol/L) of tritiated FLT, FMAU, dThd, and FBAU were incubated separately in triplicate for 3 h at a density of 400,000 cells per milliliter. After washing twice with phosphate-buffered saline, cells were extracted with acetonitrile, and total radioactivity for the soluble fraction was measured in a scintillation counter. After enzymatic digestion of the precipitate as described previously (20), total radioactivity in DNA was also measured.
Thymidine Kinase (TK) Assay
The TK assay was performed according to a previously described procedure (21,22) using 18F-FBAU, 14C-thymidine (2.03 GBq/mmol, 88.9% radiochemical purity), 3H-thymidine (74 GBq/mmol, 99.2% radiochemical purity), 3H-FLT (281.2 GBq/mmol, 99.7% radiochemical purity), and 3H-FMAU (77.7 GBq/mmol, 99.2% radiochemical purity). 18F-FBAU was indigenously synthesized as described and the remaining radiochemicals were obtained from Moravek Biochemicals. All other reagents were purchased from Sigma. Briefly, cell protein extracts for the assay were derived from PC3 cells collected at logarithmic phase and protein extract concentrations were measured using the Bio-Rad Protein assay (Bio-Rad Laboratories). The whole cell protein extract was incubated with radioactive nucleosides for 1 h at 37°C. TK, provided by protein extract, phosphorylates the nucleoside to its corresponding monophosphate. The formed nucleotide was separated on a DE-81 anion filter paper. The filter paper was then rinsed thoroughly to remove the nucleoside, dried, and counted on a scintillation counter (Tri-Carb; Packard Bioscience) using Ultima Gold scintillation cocktail (Packard Bioscience). The activity values were then normalized by the protein concentration and averaged for 3 experiments. Results were shown as TK substrate activity of the nucleoside relative to thymidine.
Image Acquisition
All experimental procedures and animal care were approved by the Wayne State University Animal Investigation Committee. Three normal dogs weighing between 17 and 25 kg (mean, 20 kg) were used to study the biodistribution of 18F-FBAU. Before the injection of tracer, dogs were premedicated with acepromazine (0.1–0.5 mg/kg); anesthesia was induced with pentobarbital (10–25 mg/kg) and maintained with isoflurane (1.5%–3.0%). After an intravenous infusion of tracer (range, 327–362 MBq; mean, 350 MBq) over 1 min using an infusion pump (Harvard Apparatus Inc.), images were acquired on an ECAT EXACT HR tomograph (CTI/Siemens PET Systems) that provides simultaneous acquisition of 47 transaxial planes with a thickness of 3.12 mm. A 15-min transmission scan was obtained with rotating 68Ge rod sources in a 2-dimensional mode to correct for attenuation. A 60-min dynamic image sequence (24 frames: 4 × 20 s, 4 × 40 s, 4 × 60 s, 4 × 180 s, 8 × 300 s) was acquired over the upper abdomen followed by static whole-body imaging (6 or 7 bed positions, 4-min emission and 6-min transmission) for a total of approximately 150 min.
Data Acquisition
Blood samples were collected from an intravenous line in a limb different from that used for injection at 1, 2, 3, 4, 5, 6, 7, 9, 11, 15, 21, 30, 40, 50, 60, 90, 120, and 150 min after injection and were immediately placed on ice. Urine samples were collected at 60 and 120 min. Blood and urine activity was measured in a γ-spectrometer. High-performance liquid chromatography (HPLC) analysis of the selected blood and urine samples was performed to measure the metabolite concentration. For HPLC analysis, blood samples were processed mixing equal volumes of blood and 1 mol/L perchloric acid (PCA), vortexed, and centrifuged at 14,000g for 3 min. The supernatants were analyzed by HPLC using a C-18 column (Hypersil ODS, 250 × 4.6 mm; Thermo Electron Corp.) using 10 mmol/L sodium acetate in 6% acetonitrile at a flow rate of 1 mL/min. All blood, urine, and HPLC fractions were counted for 1 min on a cross-calibrated γ-spectrometer (Cobra II; PerkinElmer Life Sciences Inc.). At the end of the experiment, animals were sacrificed; approximately 200–300 mg of lung, muscle, marrow, node, heart, spleen, stomach, small intestine, kidney, liver, marrow tissue samples, and bile were individually collected to measure the retained 18F activity.
Tissue Analysis
All collected tissue samples were weighed and counted in a γ-counter for 1 min. Subsequently, liver, muscle, heart, small intestine, and marrow samples were homogenized (Tissue Tearor; Biospec Products Inc.), 1 mL of 1 mol/L PCA was added, and samples were centrifuged at 15,000g at 4°C for 15 min. Supernatants were collected and the pellet was washed twice with PCA as described. All supernatants and pellets were counted on the γ-counter and supernatants of the first extraction were analyzed by HPLC. All the activity values were converted into standard uptake values (SUVs).
Image Analysis
Emission data were corrected for dead time, random counts, scatter, and attenuation. All images were acquired in 2-dimensional mode. Dynamic images were reconstructed by the backprojection method using a Hanning filter. Whole-body images were reconstructed by an iterative method using a Gauss filter. Data evaluation was based on regions of interest (ROIs) drawn over transaxial slices of the PET images. To obtain ROIs, time frames from dynamic images acquired between 30 and 60 min were summed. ROIs (∼ 465–321 pixels) were drawn on lungs, heart, muscle, marrow (121 pixels), kidneys, liver, and intestine for the purpose of analysis. Regions for each organ were identified on 3 consecutive planes and were then copied to the dynamic scan sequence to obtain the concentration of 18F versus time in μCi/mL. The SUVs were calculated by dividing tissue radioactivity concentration by the injected radioactivity (dose) per kilogram of body weight. The decay-corrected time–activity values were averaged over 3 animals.
Dosimetry
To obtain residence times, nondecay-corrected time–activity curves were calculated from ROIs drawn over different organs from the 60-min dynamic image sequence. An additional point was obtained from the whole-body image at approximately 2.5 h. After that, activity was presumed to continue according with the physical decay of 18F until 10 h. The cumulated activity concentrations were measured as the area under the curve, multiplied with the organ weights calculated using a beagle breed as a standard-size dog (23). The residence times for different organs were finally obtained as the quotient of cumulative activity for the source organ and the total activity injected into the dog. For a conservative estimation, urinary activity was assumed to be present immediately after the injection rather than presumed voided throughout the experiment.
These organ residence times were entered into the MIRDOSE3 program as input data and extrapolated to obtain radiation dose estimates for an adult male of 70 kg.
RESULTS
TK Assay and Tracer Uptake Studies
The order of TK substrate specificity for various thymidine analogs is FLT > FBAU > FMAU (Table 1).
TK Assay for Various Thymidine Analogs
The rank order for total activity uptake and retention was the same for U-937 and MOLT-4 cell lines: dThd ≫ FLT > FBAU > FMAU (Table 2). dThd has 33.1% (U-937) and 16% (MOLT-4) of activity incorporated into DNA, whereas a negligible amount of FLT was found in the DNA (0.001%). In the case of FBAU, 2.33% (U-937) and 0.44% (MOLT-4) of activity were incorporated into DNA, whereas 1.5% and 0.22% of activity were noted for FMAU (Table 2).
Intracellular Accumulation of Various Thymidine Analogs
Imaging and Kinetics of 18F-FBAU
Biodistribution, metabolism, and clearance of 18F-FBAU were studied in normal dogs. The projection and sagittal slices of whole-body images (Figs. 2A and 2B) obtained between 60 and 150 min after injection clearly demonstrate high uptake in proliferative organs such as marrow and small intestine and excretory organs gallbladder and urinary bladder. Also of interest is the high retention seen in submandibular lymph nodes, which are prone to enlargement in humans and dogs due to inflammation. Other organs that have marginal activity above the background of the tracer include heart and liver.

(A) Projection PET images of dog acquired between 70 and 140 min after intravenous injection of 350 MBq of 18F-FBAU. (B) Sagittal view.
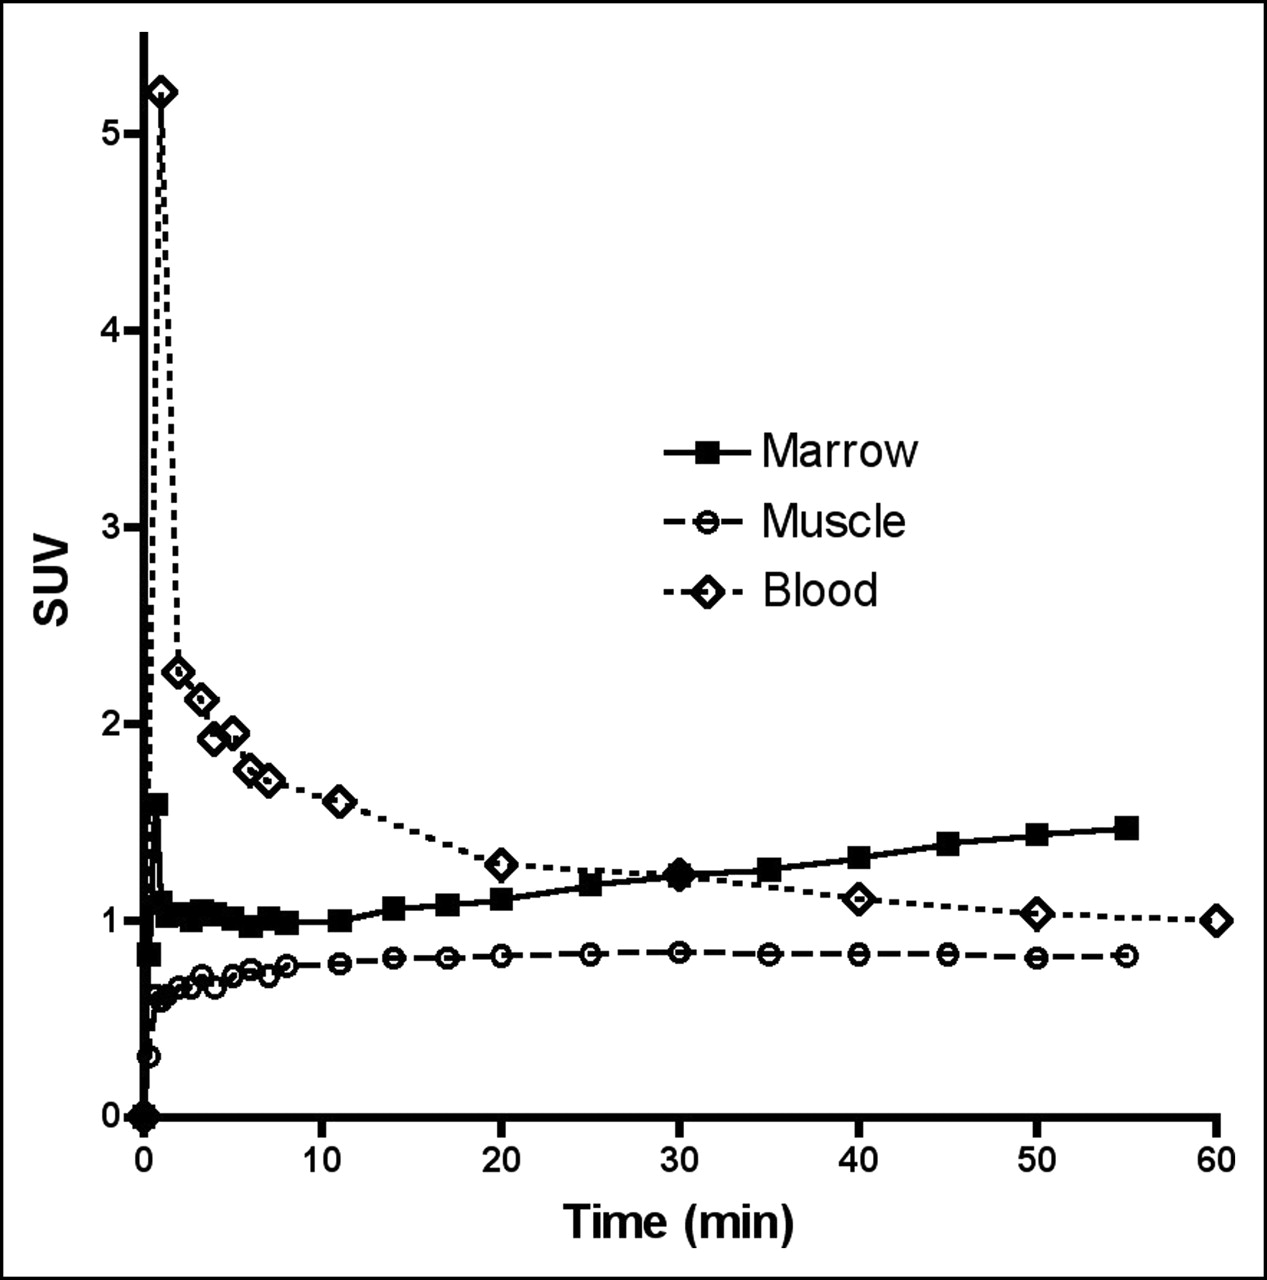
The blood concentration curve for 18F-FBAU (Fig. 3) shows an early peak and then a rapid decrease with most of the activity cleared by 60 min after injection. Marrow showed a progressive uptake of 18F-FBAU over time. Other organs such as kidney and liver had an initial peak followed by a fast washout of the tracer. The time–activity curve for the gallbladder had a buildup of activity after 5 min that might be excretion from the biliary system related to lipophilicity of the tracer (data not shown).

Decay-corrected mean time–activity curves in various organs of normal dogs after intravenous injection (327–360 MBq; n = 3) of 18F-FBAU, acquired up to 60 min after injection.
Biodistribution of 18F-FBAU
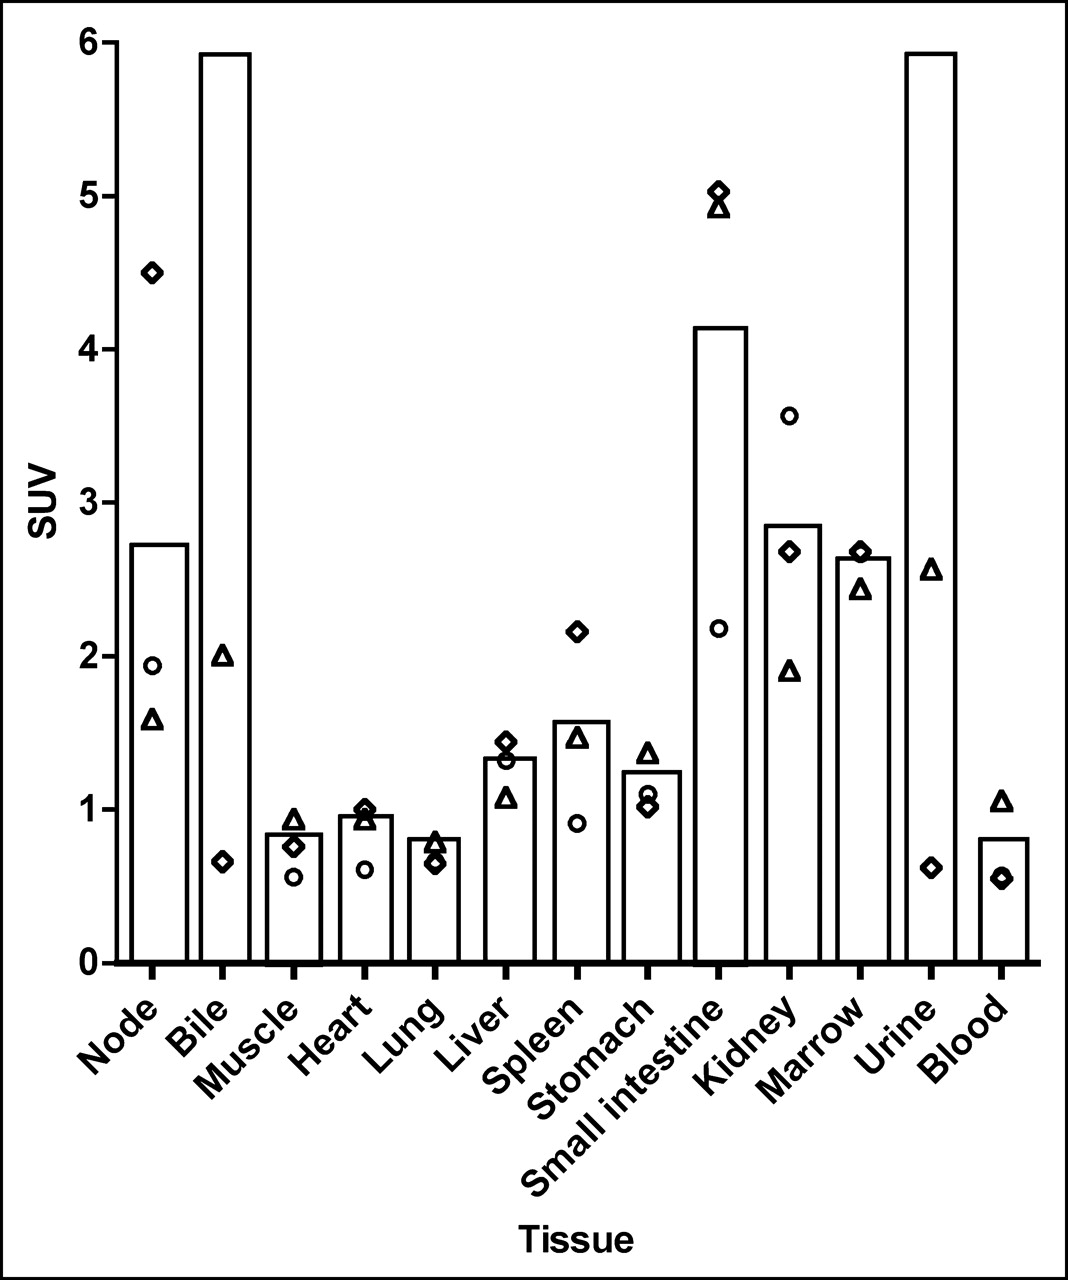
At the completion of the whole-body image, at about 140 min (range, 128–156 min), the animals were sacrificed and tissues were removed and the activity was measured by ex vivo counting. The highest uptake was seen in bile, urine, and kidneys (Fig. 4) and suggests the route of elimination of 18F-FBAU is due to hepatobiliary and renal clearance of the tracer. Proliferative organs in the body, such as small intestine and marrow, showed a high uptake (mean SUVs: marrow, 2.6; small intestine, 4.0). Nonproliferative organs, such as heart, lungs, and muscle, showed uptake similar to that of the blood levels (mean SUVs: muscle, 0.75; lung, 0.70; heart, 0.85; blood, 0.69). Our DNA extraction analysis found >75% of the activity in small intestine (range, 58%–88%) and marrow (range, 75%–93%) and <17% of the activity in heart (range, 4%–13%), muscle (range, 6%–9%), and liver (range, 16%–22%) in the acid-insoluble fractions (Fig. 5).

Bar graph shows mean SUVs of 18F-FBAU uptake in different tissue at 150 min after injection. Distribution of data for individual dogs is also shown. ⋄, Dog 1; ○, dog 2; Δ, dog 3. SUVs in graph were cut off at 6. Values of bile and urine were 15 and 16, respectively, for dog 2.
Scatter plot shows percentage of activity in acid-insoluble fraction in different tissue. ⋄, Dog 1; ○, dog 2; Δ, dog 3.
HPLC analysis of the blood and urine samples (Fig. 6) for 18F-FBAU metabolites suggested that >90% of the activity in the blood and >80% of activity in urine at 60 min after injection was present as the parent compound. The remaining activity was found as a highly polar metabolite, indicating a possible glucuronidation of the tracer. No defluorination of the tracer was observed in the time course of the experiment, suggesting that 18F-FBAU is stable in vivo.
Reverse-phase HPLC analysis of blood samples obtained at 60 min. Blood was treated with an equal volume of PCA, centrifuged, and supernatant was separated on a C-18 column. A very small fraction of metabolite is observed at a retention time of 5 min.
Dosimetry Estimates for 18F-FBAU
The residence times and radiation dose estimates to different organs per unit of injected activity in a 70-kg adult are presented in Table 3. The highest absorbed dose was to the bladder wall at 0.046 mGy/MBq. Other organs that received relatively high exposure were gallbladder, small intestine, uterus, liver, and kidneys at >0.010 mGy/MBq. The effective dose per unit of administered dose was 7 × 10⁻³ mSv/MBq. For a standard 370-MBq (10 mCi) tracer injection, these dose estimates will result in 17 mGy of exposure to bladder and 2.59 mSv of effective dose, both of which are below the maximum dose limits permitted by the Food and Drug Administration (FDA) per year for a standard human (24).
Dosimetry of 18F-FBAU
DISCUSSION
Many efforts have been invested to develop a tracer that could be used to accurately assist in diagnosis, staging, and evaluation of response to therapy in clinical oncology. Even though 18F-FDG does fill part of this need for researchers and clinicians, its function is based on tumor energetics and is not specific for malignant lesions alone. Many types of nontumor cells, such as macrophages, are known to show high uptake of 18F-FDG.
The hallmark of tumor growth is cellular proliferation, so tracers that directly incorporate into DNA may be more useful as imaging agents for understanding cancers and their response to treatments. This is especially true to monitor the treatment using cytostatic agents, which delay tumor growth rather than shrink a tumor’s size. Clinical applications of radiolabeled thymidine are limited because of its rapid degradation and the short half-life of 11C, which is the most practical PET tracer that can be used with native thymidine. We pursued PET studies of a thymidine analog, 18F-FBAU, in normal dogs in an ongoing effort to develop an agent that would emulate the properties of thymidine but have improved pharmacokinetics. Our biodistribution and PET studies demonstrated that 18F-FBAU could be used as a cellular proliferation imaging agent and further support the previously reported results from the Uppsala group (13,15,16).
FBAU is structurally similar to FMAU. Because Van der Waals radius of Br (1.95 Å) is very close to that of methyl (2.0 Å), it may result in similar functional properties. Although FMAU or FBAU could be labeled with 11C or 18F, FBAU can also be labeled with 76Br. Labeling FBAU with 76Br (half-life [t1/2] = 16.2 h) is very attractive when protracted studies are needed; however, poor positron yield (57%) per decay and dosimetry considerations might limit the dosage, thereby resulting in a lower signal-to-noise ratio and requiring longer scan times. In addition, because of the high energy of emitted positrons, 76Br causes a 1- to 2-mm decrease in resolution (25,26) compared with that of 18F. Labeling with 18F (t1/2 = 109.7 min), on the other hand, is superior because of its universal availability, better dosimetry, and favorable yield for decay to positrons (96.9%).
The rationale for studying FBAU is that, similar to FMAU and other thymidine analogs, it will be phosphorylated by cytosolic TKs and subsequently incorporated into newly synthesized DNA. Such cellular trapping of the tracer will be a good indicator of DNA synthesis. As a primary step, the in vitro TK assay conducted (Table 1) illustrated that FBAU indeed was a reasonable substrate for TK1 and had substrate specificity similar to that of FLT and FMAU. To verify these TK assay results, the intracellular accumulation of thymidine and various analogs was tested in U-937 and MOLT-4 cells. Uptake and retention of thymidine and its analogs within the cell are determined by many processes, including transport, phosphorylation by kinases, and trapping within DNA. For thymidine analogs, it is generally thought that TK is the rate-limiting step. The rank order for our uptake and retention results is consistent with the data that we present for TK substrate affinity (Table 2). dThd is likely to be the preferred substrate not only for TK but also for the other processes, so its quantitative advantage is enhanced.
These data were further supported by high uptake seen in vivo for proliferative organs with active DNA synthesis, such as marrow and small intestine, which express high amounts of TK1. 18F-FBAU uptake was also seen in heart, an indication that it is a substrate for mitochondrial TK (TK2). This uptake is relatively lower than the case of FMAU, suggesting a difference in substrate specificity of these analogs to TK2. On the other hand, FLT is primarily phosphorylated by TK1. The high retention seen in submandibular lymph nodes of 18F-FBAU-injected dogs, similar to FLT (10) and FMAU (27), may be attributed to the presence of proliferating inflammatory cells. The continuous uptake of 18F-FBAU in marrow (Fig. 3) suggests that it has potential as a proliferation imaging agent. These data were supported by the PCA extraction (Fig. 5) and results indicate the activity was present in the acid-insoluble fraction, which contained DNA.
One of the important criteria for a PET tracer is that it should be stable in blood and peripheral tissues and not readily be degraded to labeled metabolites that might interfere with imaging. Supporting our previous experience that 2′- or 3′-fluorine–substituted analogs are more resistant to degradation, these studies showed 18F-FBAU to be quite stable in vivo. HPLC analysis of blood, urine, and supernatant from PCA extraction of tissue samples did not indicate any defluorination of the tracer. However, a metabolite more polar than FBAU, probably due to glucuronidation of the tracer, was observed in both blood and urine samples. Most of the tracer was cleared from the blood in the first 30 min after injection, resulting at in an SUV of 1 by 60 min. In a recent report (13), this problem was tackled by administering cimetidine, an inhibitor of organic cation secretory system to increase the body’s retention of 76Br-FBAU and allow more time for incorporation of the radioactivity into DNA (13). This is more of an issue when using tracers with a longer half-life, such as 76Br, because one must inject a relatively low amount of activity because of dosimetry constraints. This is less of an issue when using 18F-FBAU. The addition of renal blockers might even result in an increased background activity within the 2- to 3-h duration of 18F-labeled experiments. A similar clearance pattern was also seen for 18F-FMAU in patients (28). With 95% of activity cleared in 10 min, reasonable18F-FMAU uptake was seen in different tumors.
Because TK1 is the principal enzyme in the salvage pathway for DNA synthesis, a good way to further establish the role of FBAU as a proliferation marker would be to examine the uptake with respect to TK1 activity. Borbath et al. showed that FBAU uptake in tumors varies with proliferation using proliferation inhibitors such as gemcitabine (dFdC) (15). To further confirm FBAU as a proliferation marker one also needs to correlate its uptake with other standard proliferation indices, such as proliferating cell nuclear antigen or Ki67 labeling.
A recent report by Alauddin et al. (29) used 18F-FBAU as a probe for imaging expression of the herpes simplex virus thymine kinase (HSVtk) gene, which is used as a marker for gene therapy studies. Considering the TK substrate specificity of FBAU and its incorporation into normal proliferative tissues, the usefulness of FBAU as a gene expression imaging agent versus other currently available pyrimidine analogs (30–32) requires further investigation.
CONCLUSION
To pave the way for FBAU into the clinical setting as a proliferation marker, dosimetry studies are necessary; our dosimetry data indicate that bladder exposure is the highest and might be rate limiting. However, even in the present conservative estimation, this exposure is much less than the FDA allowable limit.
In conclusion, our PET and tissue data demonstrate that 18F-FBAU was selectively incorporated into proliferative organs, was stable to degradation in vivo, and showed good contrast between organs of variable proliferation rates. 18F-FBAU, therefore, is a potential marker for proliferation and merits additional preclinical and clinical testing. Further exploration of this tracer compared with FLT and FMAU are needed in a clinical setting.
Acknowledgments
We thank Dr. Elizabeth Dawe, Janet Scaffolding, and Karen Forman for veterinary assistance and Theresa Jones for imaging support. This work is partially supported by grants CA83131 and CA33713 from the National Cancer Institute.
Footnotes
Received May 11, 2005; revision accepted Aug. 4, 2005.
For correspondence or reprints contact: Anthony F. Shields, MD, PhD, Karmanos Cancer Institute, 4100 John R St., 4HWCRC, Detroit, MI 48201-2013.
E-mail: shieldsa{at}karmanos.org


