


Abstract
242454
Introduction: It is desirable to reduce injected radioactivities in PET imaging while preserving image qualities. Low-dose (LD) PET imaging is particularly advantageous for routine monitoring and disease prevention by early detection of physiological abnormalities. The present study aims to assess the feasibility of predicting PET standard-dose (SD) data from LD data using an implicit neural representation (INR). As a novel deep learning methodology, INR networks map the image spatial coordinates to the corresponding intensity values for sparsely sampled voxels and hold significant potential for improving images.
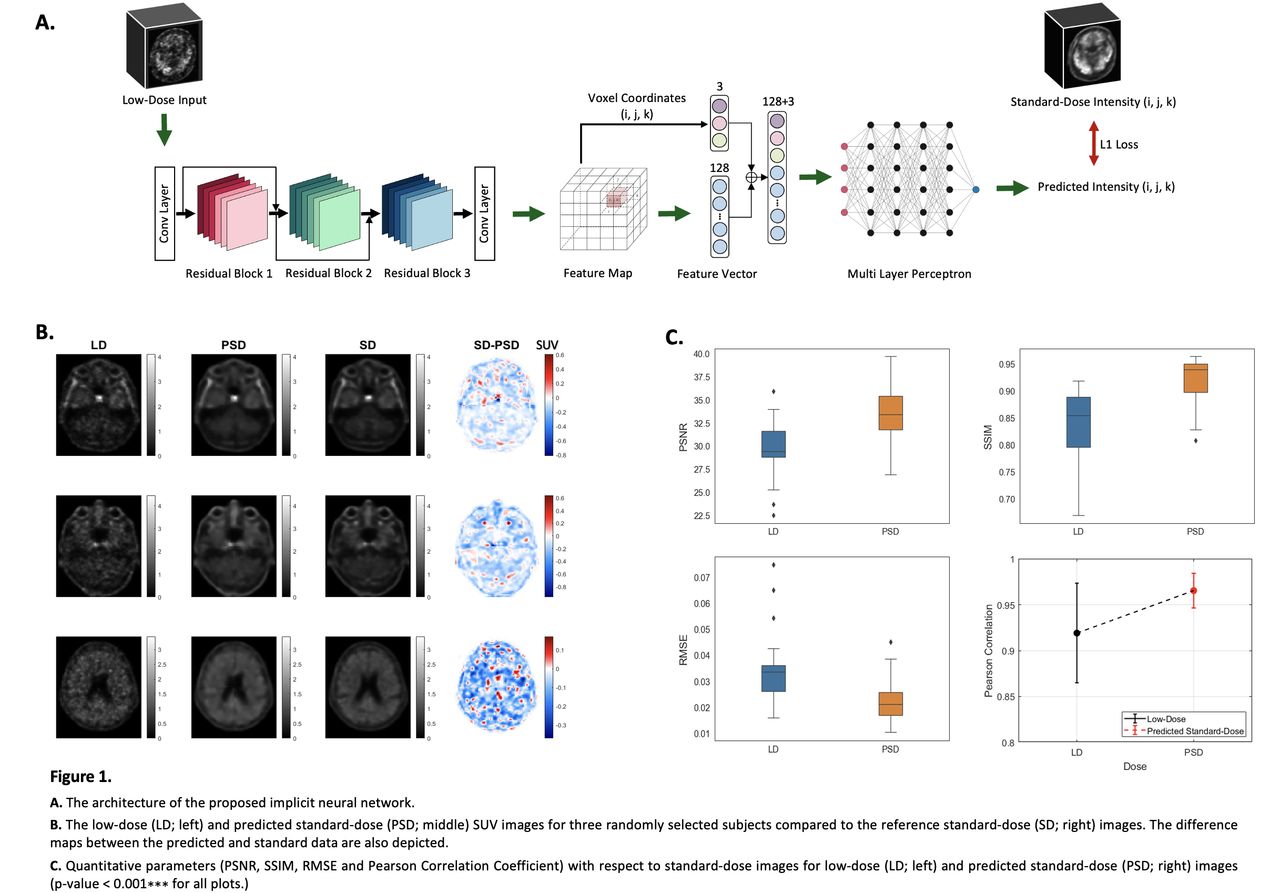
Methods: In this study, 101 18F-flortaucipir brain PET images were acquired in list-mode format. To simulate a realistic LD dataset, 5% of the events were randomly selected for each patient. All images were converted to Standard Uptake Value (SUV) and registered to Montreal Neurologic Institute (MNI) space, then normalized and converted to 40x40x40 patches to reduce the computational time. Collected dataset was divided into three parts: a training set with 71 subjects, a validation set with 10 subjects, and a test set with 20 subjects. We implemented an INR network to predict SD data from the corresponding LD data. The proposed network consists of two parts: an encoder and a decoder. Encoder is a ResNet model with three residual blocks, which maps the input patch to 128 feature maps. Each residual block has six convolutional layers with a ReLU activation function. The feature maps are then converted to feature vectors for all 8000 randomly selected voxels in each epoch. In the next step, the feature vector is concatenated with the coordinate of the selected voxel. The concatenated vector is then fed into the decoder. Decoder is an MLP network with four hidden layers that map the concatenated input to the intensity of the selected voxel. The batch size was set to 4 in the training process. To minimize the L1-loss function, the Adam optimizer with a learning rate of 0.0001 was applied. The learning rate was halved every ten epochs, and the training process extended over 100 epochs. Figure 1.A demonstrates the network architecture.
Results: Figure 1.B illustrates the predicted standard-dose (PSD) data for three subjects in the test dataset. In the last column, one can see the difference map between SD data and predicted ones. The difference maps that are plotted for the subjects have the potential to help physicians identify areas of concern more accurately. In order to assess the quality of network output, standard quantitative metrics, such as peak signal-to-noise ratio (PSNR), root mean square error (RMSE), structural similarity index metrics (SSIM), and Pearson correlation coefficient were used. Considering the SD data as the reference, the PSNR and SSIM metrics in PSD data increased by 13% and 11% with respect to LD, respectively. Meanwhile, the RMSE decreased significantly by 36.1% for the PSD with respect to LD input. Compared to the SD data, the Pearson correlation coefficient was 0.93 ± 0.05 for the LD input, and it rose to 0.97 ± 0.01 for the PSD images. Box plots of these metrics are shown Figure 1.C Furthermore, we conducted a paired sample t-test at the 5% significance level for all the above-mentioned quantitative metrics derived from the LD and PSD data. The null hypothesis was rejected with p-value<0.001*** for all of them.
Conclusions: Our research utilized a framework to predict SD PET data from LD images. Quantitative metrics all showed significant improvements, supporting the network's ability to enhance image quality. Based on the results, our proposed architecture successfully mapped spatial coordinates to the intensity values through a combination of a ResNet encoder and an MLP decoder, a new paradigm compared to conventional CNN-based networks.


In this issue


Jump to section
Related Articles
Cited By...
- No citing articles found.