


Abstract
242214
Introduction: To explore the prognostic value of the TRAQinform Profile trained on mid-treatment prostate-specific membrane antigen (PSMA) PET/CT (PSMA-PET) when applied to end-of-treatment PSMA-PET (ePET) in patients with metastatic castration-resistant prostate cancer (mCRPC) treated with 177Lu-PSMA Radioligand Therapy (PSMA-RLT).
Methods: This was a single-center retrospective study. mCRPC patients who underwent PSMA-RLT with available baseline PSMA-PET (bPET) and ePET within 6 mo of the last PSMA-RLT cycle were eligible. Overall survival (OS) from ePET was collected. TRAQinform IQ technology (AIQ Solutions-Madison, WI) was used to conduct lesion region of interest (ROI)-based analyses at bPET and ePET, and changes in SUVmax, SUVmean, volume (cm3), and SUVtotal (SUVmean x volume) across all lesion ROI from bPET to ePET were extracted. ROI were matched across time points and categorized into new, increasing, stable, decreasing, and disappeared based on changes in SUVtotal (Figure 1 and Table 1). Associations between % new, % increasing, % stable, % decreasing, and % disappeared lesions and OS were evaluated using univariate Cox regression models. This study applied TRAQinform Profile (a random forest model), trained on 185 external PSMA-PET, to generate TRAQinform Profile scores for early identification of optimal vs. suboptimal responders to PSMA-RLT. Associations between TRAQinform Profile scores and OS were evaluated by Kaplan-Meier analysis.
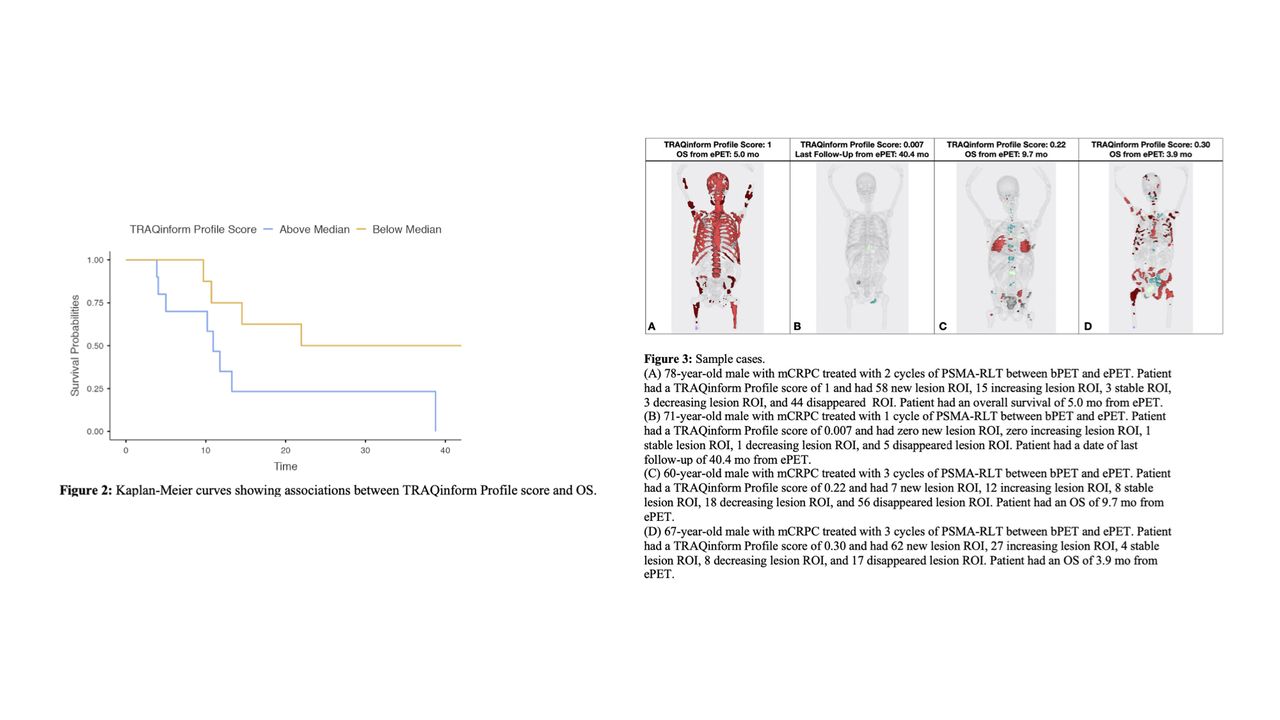
Results: Twenty mCRPC patients were included. The median number of treatment cycles was 3.5 (interquartile range [IQR], 2–4). The median time between bPET and cycle 1 of PSMA-RLT was 1.0 mo (IQR, 0.7–1.8 mo). The median time between the last cycle of PSMA-RLT and ePET was 1.9 mo (IQR, 1.2–3.5 mo). Twelve of 20 patients (60%) had died at the last follow-up. The median follow-up time from ePET for survivors was 31.2 mo (IQR, 6.8–40.7 mo). The median survival time from ePET was 13.3 mo (IQR, 10.2–NR). The median number of lesion ROI identified on bPET and ePET were 13.5 (IQR: 5.8-59.5) and 33 (IQR: 2.8-86.3) respectively. The median % changes in SUVmax, SUVmean, volume, and SUVtotal from bPET to ePET were -33.9%, -20.7%, 4.3%, and -13.9% respectively. An increase in percent new and percent new or increasing lesions was associated with a higher risk of death (HR = 1.03; p = 0.004, HR = 1.03; p = 0.01 respectively), while an increase in percent disappeared or decreasing lesions was associated with a lower risk of death (HR = 0.97; p = 0.024). The median TRAQinform Profile score was 0.27, and patients with a TRAQinform Profile score above the median had shorter OS compared with patients with a TRAQinform Profile score below the median (median OS, 10.9 mo [95% CI, 5.0-NR] vs. median OS, 22.0 mo [95% CI, 14.5-NR]; P = 0.049) (Figure 2). Figure 3 shows sample cases from our cohort.
Conclusions: In this retrospective study of 20 mCRPC patients treated with PSMA-RLT, the TRAQinform Profile score was prognostic for OS. Percent new, percent new or increasing, and percent disappeared or decreasing lesions were significantly associated with OS. Validation in larger, prospective multicentric clinical trials is warranted.


In this issue


Jump to section
Related Articles
Cited By...
- No citing articles found.