


Abstract
241517
Introduction: According to Fick’s principle (Fick 1870), an estimate of total blood flow to an organ can be obtained using a tracer, by knowing its tissue uptake (CT) over time, and its arterial (CA) and venous (CV) concentration in the vessels feeding and draining the organ (Kety and Schmidt Am J Physiol 1945). The exceptional sensitivity and spatial resolution of the brain-dedicated NeuroEXPLORER (NX) (Carson et al. J Nucl Med 2023), a next-generation PET scanner, may provide accurate measurement not only of CT, but also of CA and CV from vessels of relatively small diameter (e.g., carotid arteries, jugular veins). This new opportunity may allow to obtain a whole-brain (WB) estimate of cerebral blood flow (CBF) in a fully non-invasive fashion, i.e., from dynamic images themselves. Theoretically, this could work for a wide range of PET tracers.
Methods: Five healthy individuals were scanned on the NX (four [18F]FDG; one [18F]FE-PE2I). A CT scan was performed for attenuation correction and list mode data were acquired for up to 2 h. An anatomical MR scan (T1w) was also acquired. The NX manufacturer’s reconstruction was employed, i.e., OSEM (7 iterations, 10 subsets, 0.55-mm voxels) including TOF, depth-of-interaction, point spread function, and inter-crystal scatter correction. Bilateral masks of 1) common carotid arteries (CC) (mask axial length ~ 9.5 cm), 2) internal carotid arteries (IC) (length ~ 11 cm), and 3) internal jugular veins (IJ) (length ~ 8 cm) were manually drawn on an early summed image (0-10 min). The mask centerlines (i.e., median x, y coordinate for each axial slice) were dilated to 2-mm diameter. Given the resolution of the NX (< 2 mm) and the diameter of the vessels of interest (~ 5-10 mm), no partial volume correction was applied. Only the early PET data were analyzed (~ 15 min; [18F]FDG: 30x10s, 10x60s frames, [18F]FE-PE2I: 30x10s, 1x60s, 2x120s, 1x300s frames). A WB tissue time-activity curve (TAC) CT(t) was extracted, using a WB mask generated on the T1w image. An estimate of CA(t) was obtained as the average of CC + IC-derived voxel TACs, and CV(t) as the average of IJ voxel TACs. Fick’s equation was used to obtain a time-varying CBF estimate (CBF(t)):
CBF(t) = CT(t) / ∫t0(CA(τ) – CV(τ))dτ (1)
where ∫t0(CA(τ) – CV(τ))dτ is the integral from 0 to t of the arteriovenous difference in tracer concentration.
After dividing by brain tissue density (1.05 g/cm3), estimates of WB CBF ([mL/100g/min]) were obtained from multiple time intervals:
CBF(tpeak → tpeak + k) where k = 2',4',6',8',10' (2)
as the mean CBF(t) of the first k min after CA peak time (tpeak).
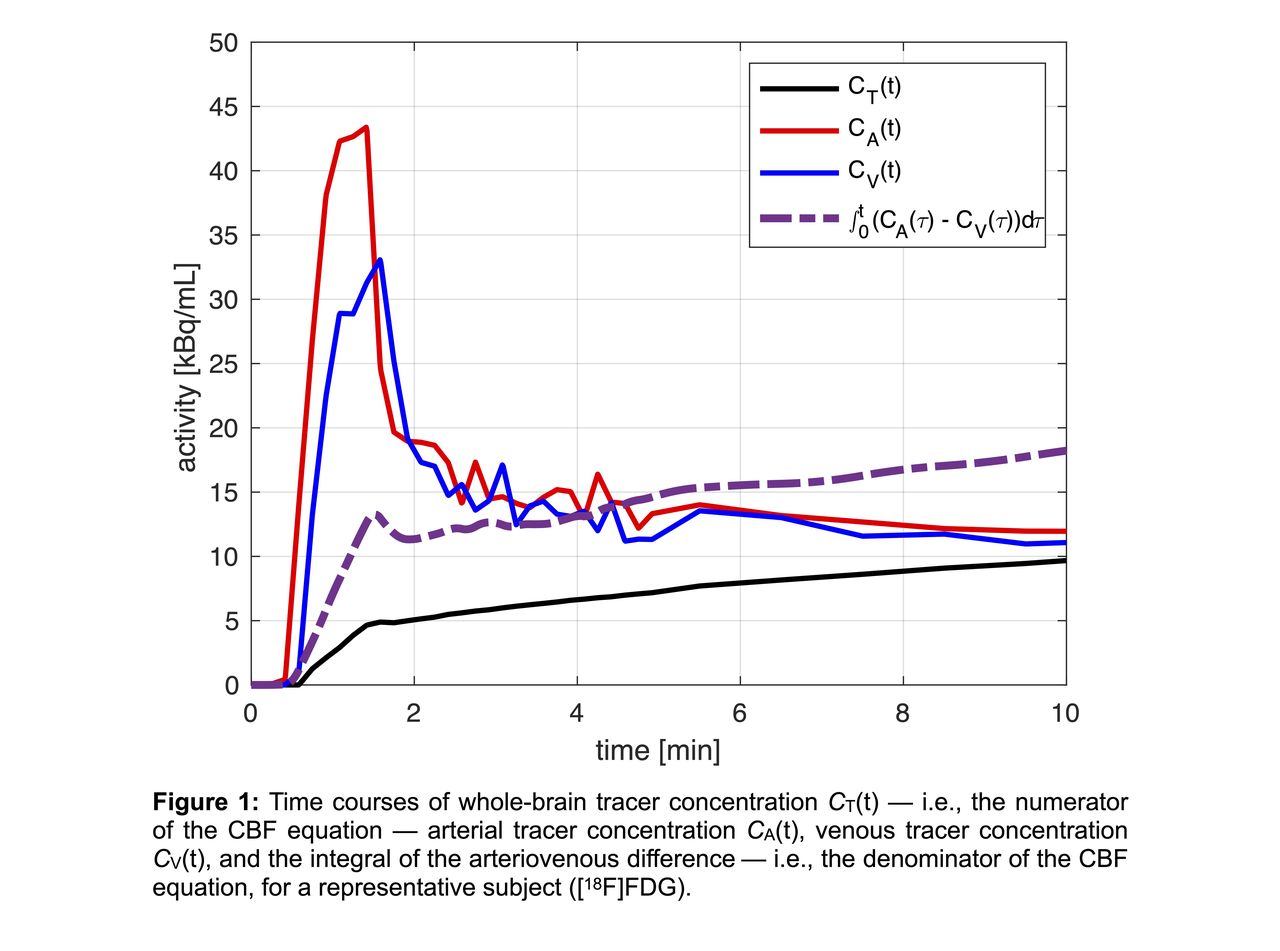
Results: CT(t), CA(t), CV(t), and ∫t0(CA(τ) – CV(τ))dτ are shown in Figure 1 for a representative subject ([18F]FDG). It can be appreciated how ∫t0(CA(τ) – CV(τ))dτ is approximately a scaled-up version of CT(t). WB CBF estimates are reported in Figure 2: the [18F]FDG results (n = 4) show an increase of mean and SD of CBF for longer time intervals after CA peak, which is not detected in the single [18F]FE-PE2I scan.
Conclusions: The WB CBF estimates obtained with our approach are consistent with the PET and phase-contrast MRI literature (Madsen et al. J Cereb Blood Flow Metab 1993; Vernooij et al. J Cereb Blood Flow Metab 2008). This fully non-invasive approach for absolute CBF quantification can easily be extended to any tracer with a detectable jugular venous signal (i.e., low-to-average extraction). Among multiple potential applications, WB CBF estimates could be used to scale K1 images into CBF parametric maps. Further work is required to fine-tune this approach, including correction for partial volume effects which may affect the recovery of CA and CV, and validation against gold-standard CBF estimates from [15O]H2O experiments in the same subjects.
Research support: U01EB029811


In this issue


Jump to section
Related Articles
Cited By...
- No citing articles found.