


Abstract
241167
Introduction: Epilepsy is a chronic neurologic disorder that affects up to 1.6% of the world’s population. Epilepsy surgery can be curative, but to be a surgery candidate, a seizure focus in the brain must be identified. In this study we use novel high-resolution parametric quantification developed previously for dynamic 2-[18F] fluoro-2-deoxy-D-glucose positron emission tomography (FDG PET) images to locate seizure foci.
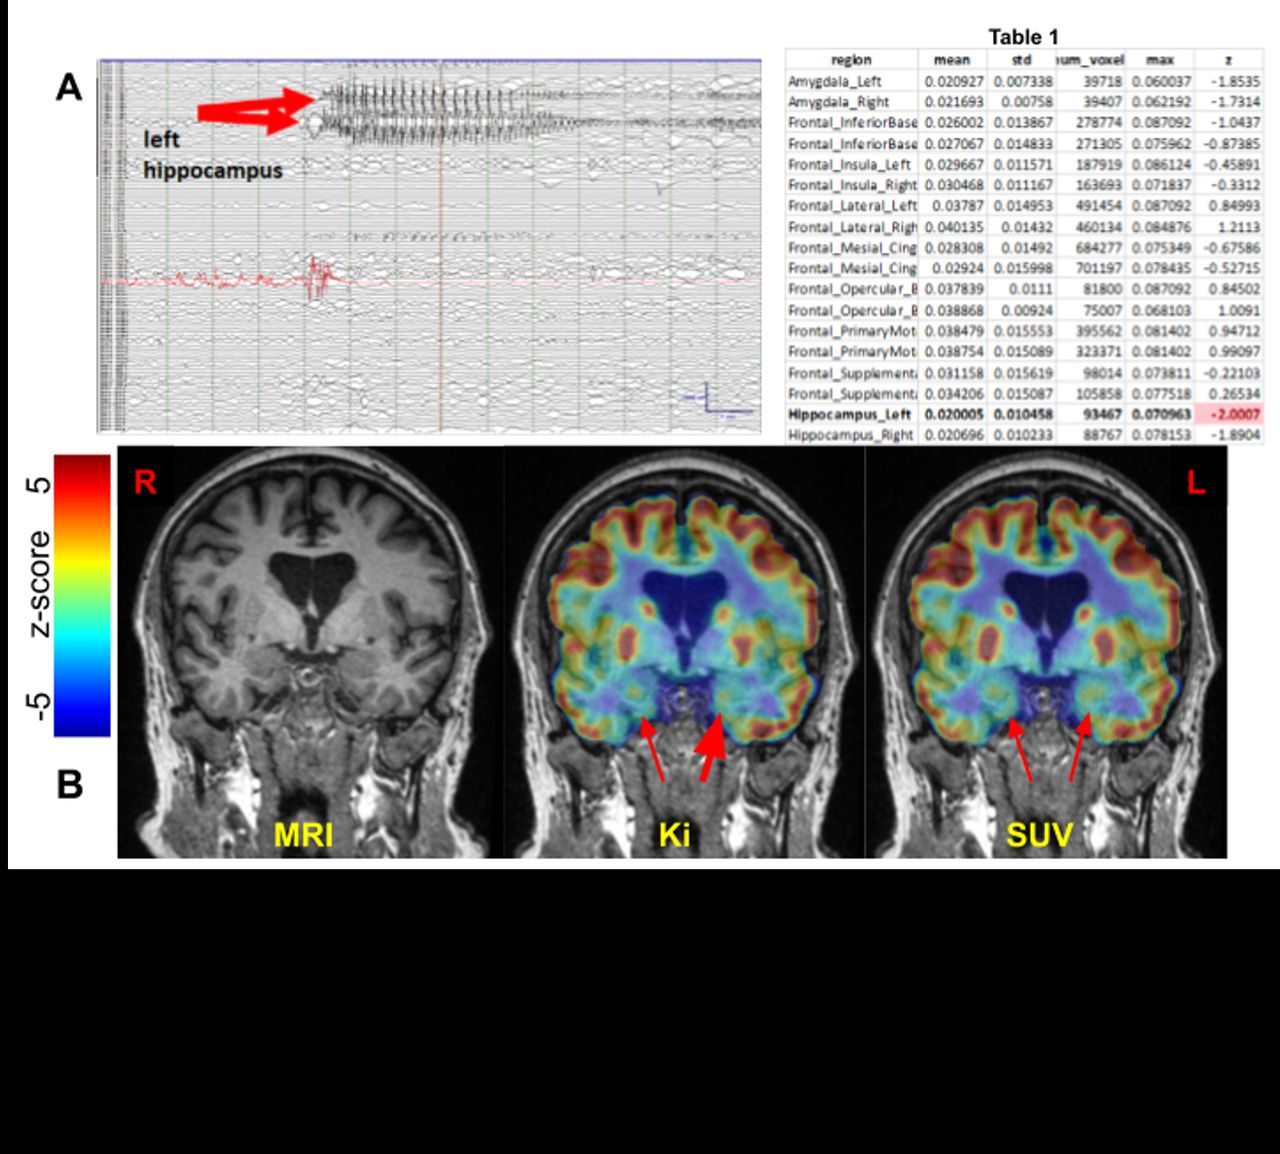
Methods: Dynamic FDG PET (dFDG-PET) scans of the brain were performed on n=11 epileptic patients (identifiers: 10, 11, 13, 21, 24, 27, 28, 30, 31, 32, 35) using the Siemens Biograph time of flight (TOF) mCT scanner. A 60-minute scan was initiated in list-mode format followed immediately by an intravenous ~10 mCi 18F-FDG injection. The attenuation corrected dynamic PET data was motion corrected and co-registered with a high resolution T1-weighted magentic resonance (MR) image using methods described previously. Next, the T1-weighted MR image was co-registered with a high resolution T1-weighted MR brain template provided by the Montreal Neurological Institute (MNI) using a non-rigid transform generating a transformation matrix. The total 164 regions of the Destrieux atlas, defined on the same MR brain template, were binned to generate 36 regions of interest (ROI) (18 regions/side). The above transformation matrix was inverted and applied to all the masks (36 ROIs) to move them from the standard MNI template space into the patient MR space (Fig 1 A-E). All the above processes were performed using custom bash scripts designed using software from the FMRIB’s Software Library (FSL) tool kit. To generate the parametric PET maps, a model corrected blood input function (MCIF) with partial volume averaging was computed from image derived blood input derived by semi-automatic segmentation of the internal carotid arteries in 3D slicer (Fig 1 F). Each voxel of the dynamic PET data was then independently fed into a graphical Patlak model in Matlab (Mathworks Inc., Natick, MA), together with the computed MCIF to compute the whole brain parametric rate of FDG uptake, Ki, maps (Fig 1 G). The 36 masks in patient MR space were then dropped onto the parametric PET maps in Matlab and average Ki computed for all the regions. z-score maps were computed by normalizing to the patient whole brain mean Ki and standard deviation (Fig 1 H). Side-to-side percent difference z-scores were also computed. All regions with z-scores less than -2 standard deviations were identified hypometabolic compared to its contralateral side.
Results: Regional assessment of the 36 ROIs (18/side) from the parametric Ki maps and z-scores revealed unilateral mesial temporal/hippocampal regions of hypometabolism on dFDG-PET for patients 10, 11, 13, 24, 30, 31. Of these patients, #30 underwent definitive localization with intracranial EEG identifying a seizure onset zone (SOZ) in the left hippocampus (Fig 2A). The patient underwent laser interstitial thermal therapy (LITT) of the left hippocampus mid July and was seizure-free at last follow-up on September 9 last year. dFDGPET (Ki, Fig 2B; Table 1) revealed concordant left mesial hypometabolism (bold red arrow) whereas other non-invasive presurgical evaluations including traditional standardized uptake value (SUV) static PET (sPET) were non-localizing. Patients 21, 27, 28, 32 had bilateral mesial temporal regions of hypometabolism on dFDG-PET non-localizing by sPET. Patient 35 had frontal regions of hypometabolism concordant with proposed SOZ, however non-localizing by MRI brain and ictal SPECT. Traditional sPET identified left temporal hypometabolism.
Conclusions: dFDG-PET offers additional sensitivity over traditional sPET to reveal epileptic networks since it captures the kinetics of glucose wash-in, metabolism, and wash-out from the point of injection. With further validation, dFDG-PET may offer more patients the advantages of presurgical localization and possibly convert those who may be non-candidates into candidates for transformative epilepsy surgery.


In this issue


Jump to section
Related Articles
Cited By...
- No citing articles found.