


Abstract
P654
Introduction: There is much recent interest in reducing imaging time points for routine clinical dosimetry. Two commonly used methods to perform Single timepoint (STP)-dosimetry are the so called Hanscheid-method [J Nuc Med 2018;59:75-81] and the Madsen-method [Med Phys 2018;45:2318-2324]. The former assumes a mono-exponential time activity curve and sampling performed at an optimal time point while the later uses parameter estimates of a known population. To our knowledge, application of these methods in the radioimmunotherapy (RIT) setting has not been reported. In the current work, we make use of multi-timepoint imaging data from two patient groups with non-Hodgkin lymphoma (NHL) treated with RIT, to test feasibility of STP methods and identify the optimal sampling time point.
Methods: Tumor time activity-curves (TACs) for 39 NHL patients treated at University of Michigan with 131I-tositumomab and liver, spleen and kidney-TACs for 13 patients treated at Oslo University Hospital with 177Lu-lilotomab satetraxetan were included. For 131I-tositumomab, three SPECT/CT-images from both tracer (days 0, 2 and 6) and therapy administration (days 2, 5 and 7/8) were included. Tracer and therapy STP-estimates were treated separately. For the 177Lu-lilotomab satetraxetan, a three-time point hybrid planar (day 1) and SPECT/CT (days 4 and 7) imaging protocol was used. STP-estimates of the time integrated activity coefficients (TIAC) were calculated from each time point for both the Hanscheid and Madsen-method. For the Madsen-method, the population average was used to estimate the tissue specific population effective half-life. The STP-estimated TIACs were compared to reference (from multi-timepoint imaging) TIACs using the mean absolute percentage error (MAPE). For the 131I-tositumomab reference TIAC, a biexponential mixed model fit was used, whereas for the 177Lu-lilotomab satetraxetan data, trapezoidal integration and a monoexponential tail past the penultimate time point was used.
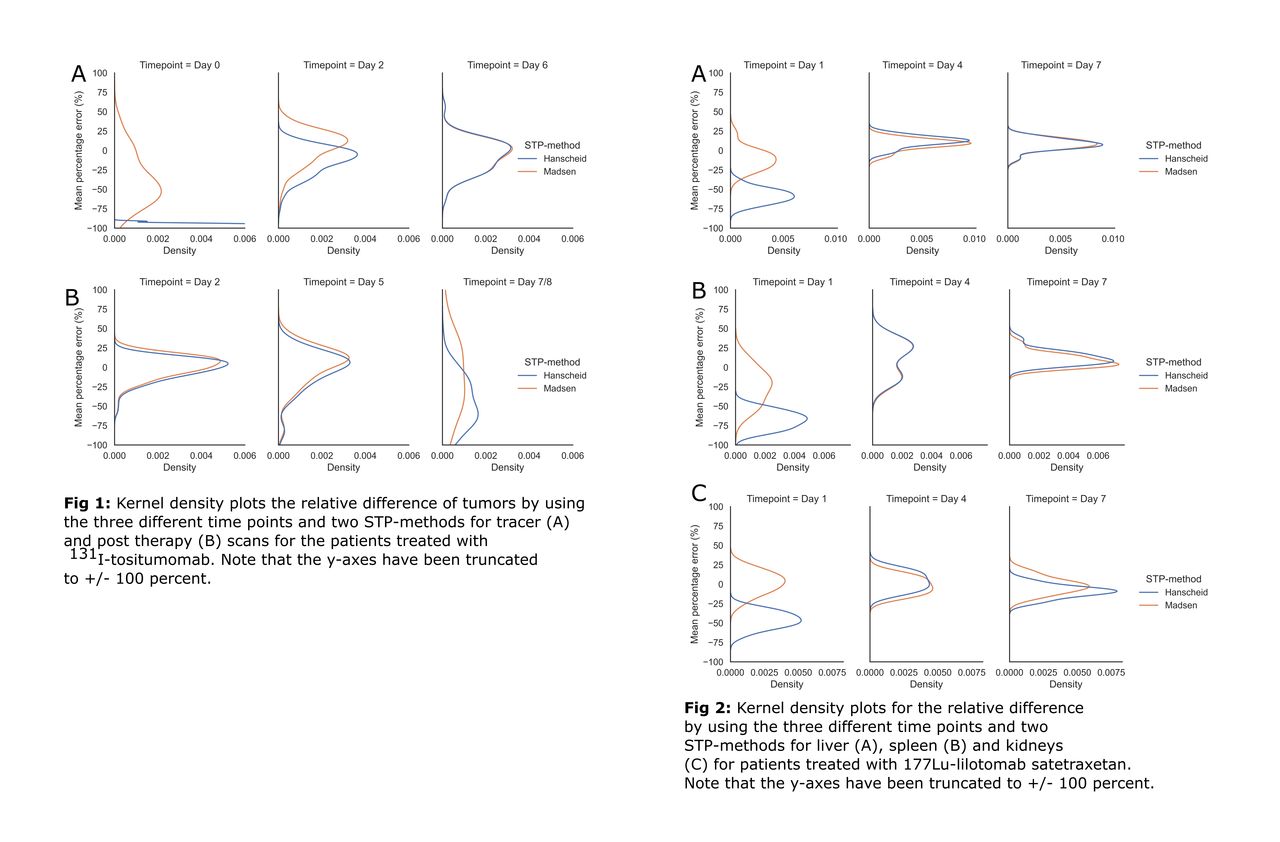
Results: For tumor on the 131I-tositumomab post-therapy-scans, the MAPE + standard deviation for STPs at day 2, 5 and 7/8 were 10.7 ± 9.4, 18.5 ± 17.4 and 47.4 ± 28.3 % for the Hanscheid-method, whereas for the Madsen-method the MAPE was 11.6 ± 9.3, 20.3 ± 16.6 and 42.2 ± 28.5 %. At the optimal time point (day 2; average 44 hours) 70 and 65 % of the STP-estimated TIACs were within 20 % for the Hanscheid and Madsen-method respectively. For tumor on the tracer-scans, the MAPE for STPs at day 0, 2 and 6 were 97.7 ± 1.7, 16.4 ± 15.0 and 17.0 ± 13.4 % for the Hanscheid-method and 42.4 ± 23.9, 17.5 ± 11.8 and 16.8 ± 13.5 % for the Madsen-method. At the optimal time point (day 2, average 47 hours) 87 and 86 % of the tumors were within 20 % with the Hanscheid and Madsen-method respectively. The MAPE across all normal organs for 177Lu-lilotomab satetraxetan were 57.1 ± 13.3, 14.4 ± 9.0 and 10.9 ± 7.1 % for day 1, 4 and 7 estimations respectively for the Hanscheid method and 17.6 ± 14.0, 13.5 ± 8.6 and 8.8 ± 6.7 for the Madsen-method. For the Hanscheid-method and using the optimal time point (day 7, average 173.5 hours) , 100, 77 and 85 % of the STP-estimates were within 20 % for the liver, spleen and kidneys respectively. For the Madsen-method and the same time point, 100 % of the liver and kidneys and 92 % of the spleen-estimates were within 20 %.
Conclusions: For all structures evaluated (tumors for 131I-tositumomab and liver, spleen and kidneys for 177Lu-lilotomab satetraxetan) STP-estimate could potentially be used to calculate the TIAC, and hence the absorbed dose depending on accepted accuracy. For both therapies, the two STP methods performed similarly at their optimal sampling time with <20% difference in TIAC on average relative to multi-time point imaging. The optimal sampling time based on the current data is approximately 2 days post injection for 131I-tositumomab tumor-dosimetry and approximately 7 days post injection for 177Lu-lilotomab satetraxetan liver, spleen, and kidney-dosimetry.


In this issue


Jump to section
Related Articles
Cited By...
- No citing articles found.