


Abstract
P265
Introduction: Selective internal radiation therapy (SIRT) labeled with yttrium-90 (Y-90) is an established treatment for many liver tumors and especially hepatocellular carcinoma. However, the success of the therapy relies on the tumor response, which is reported by a growing number of studies to be linked to the absorbed dose. In this work, we compared the intended and actual absorbed dose using pre- and post-treatment images. The absorbed dose was provided for liver segments (Couinaud's segments) and the tumor. A second objective of this work was to predict microspheres deposition by Computational Fluid Dynamics (CFD) and compare it to Y-90 PET-based dosimetry as an essential step toward individualized treatment planning.
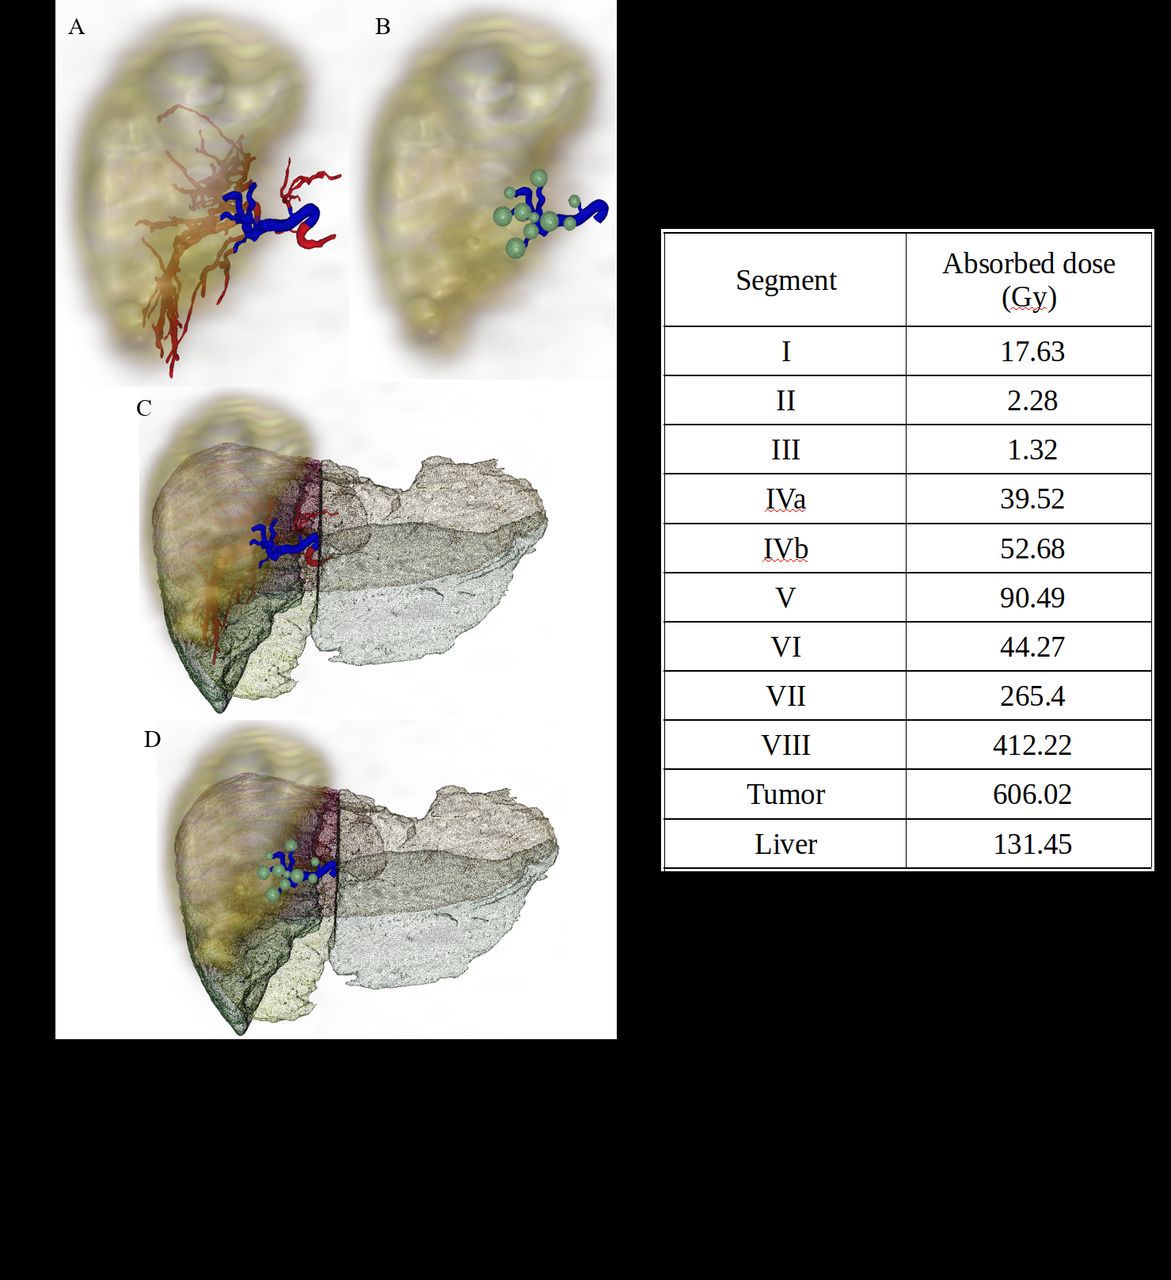
Methods: Patient data - The patient received 2.85 GBq of glass microspheres injected into the right lobe with the intention of delivering 137 Gy to the entire liver. Anonymized images of Positron Emission Tomography (PET), Computed Tomography (CT), Contrast Enhanced CT (CECT), and Cone Beam CT (CBCT) were used to capture the activity distribution, anatomical information for registration, anatomical information to contour Couinaud's liver segments and tumor, and to extract the hepatic arterial tree, respectively. PET/CT and CBCT were co-registered with rigid registration and re-sampled to the CECT voxel size of 0.67x0.67x1.5 mm3. Liver segments and tumors were manually delineated on the CECT using 3D Slicer. Figure 1 shows the PET, liver segments, registered to CECT.
Dosimetry simulations - 3D dose distributions were generated by Monte Carlo simulations using GATE v9.0 with PET and CECT images as input. With the CECT, densities and cross-sections are defined in GATE by Hounsfield Units ranges instead of assuming homogeneous tissue composition. GATE normalizes the input source image; therefore, the activity was corrected post-simulation using the number of simulated particles and the known decay-corrected activity minus the activity delivered to the lungs (calculated with the lung shunt fraction). The absorbed dose was calculated for each segment, tumors, and the whole liver volume.
Computational Fluid Dynamics simulations – Patient CBCT was processed with 3D slicer to extract patient-specific hepatic arterial tree structure. Briefly, the Vascular Modeling Toolkit plug-in used an ITK-based marching-cubes algorithm to create topological reconstruction of surfaces. This structure was further post-processed by surface-smoothing, which was then used to create a volume mesh using gmsh. CFD simulations were carried out using OpenFOAM on the patient-specific volume mesh assuming an incompressible Newtonian fluid with density and viscosity of 1.06 g/cm3 and 0.04 g/cm/s, pulsatile inlet boundary conditions, and 3rd-order windkessel elements at each arterial outlet. Discrete particle injections were modeled using the MP-PIC formulation. Figure 1 shows arterial tree, truncated arterial tree and outlets registered to CECT.
Results: The absorbed dose for the entire liver computed from PET is 131 Gy, 4.5% lower than the prescribed dose. Absorbed doses ranged from 1 to 52 Gy in the left lobe segments, up to 412 Gy in the right lobe segments, and 606 Gy in the tumor (table 1). The microsphere distribution at the outlets predicted from CFD simulations in the truncated arterial tree showed the highest concentration in segments 5, 7, and 8, which matches the 3 highest absorbed dose regions.
Conclusions: The calculated and prescribed absorbed doses are in good agreement and the segmental liver assessment shows good dose deliverance to the tumor and right lobe as targeted. CFD simulations also show good agreement between the microsphere deposition prediction with the highest dose regions, although only a truncated arterial tree was used in this proof-of-concept comparison since microsphere distributions are calculated from upstream outlet flux of particle trajectories. Future work will include the complete arterial tree and a whole liver and tumor absorbed dose comparison.

In this issue


Jump to section
Related Articles
Cited By...
- No citing articles found.