


Abstract
P1214
Introduction: PET quantification has been based on using a global arterial input function (AIF) (PMID: 864466), which violates local mass conservation. We introduce fluid mechanics based quantitative transport mapping (QTM) for quantifying tracer transport through tissue or perfusion (PMID: 33210310, 36107908). Here, we develop QTM for 11C-PE2I PET quantification.
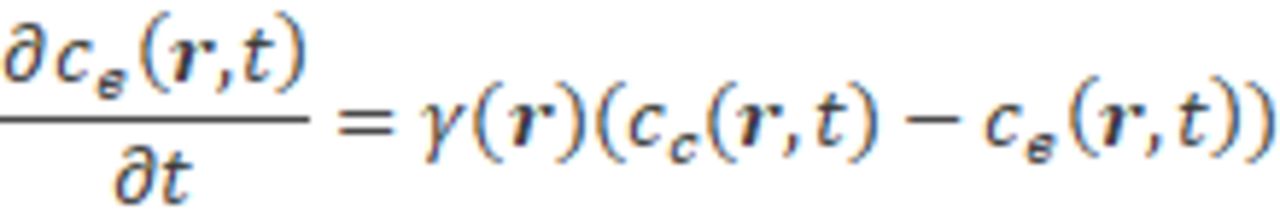
Methods: We considered 3 tracer kinetics models: 1) 3-compartment with binding term and mass flux, 2) 2-compartment with vessel wall exchange/permeability and mass flux, and 3) corresponding 2-compartment with traditional global AIF for comparison. The change of contrast agent concentration with space and time in vascular space is determined by the convection diffusion equation: . At the vessel wall, contrast agent may exchange between vascular space and extravascular space with vascular permeability: , in extravascular extracellular space, tracer can bind to the cell with a constant rate: .
We define the perfusion F of the voxel as the flow from the arterial space to the capillary space; Ktrans the permeability of the voxel as the integration of on capillary wall surface area; Plasma space volume Vp as the total volume that capillaries occupy in the voxel, and extravascular space Ve as the total volume that extravascular space occupies in the voxel, binding potential B as the integration of binding rate inside voxel.
For method 1 and 2, the inverse problem was solved using a deep neural network (QTMnet, 28-layer32*32*32 3D U-net with tracer concentration data as input) trained on 4000 brain data from biophysics simulation: The complete brain vasculature at micron resolution was generated using constrained constructive optimization, computational fluid dynamics was applied to the vasculature, and tracer transport was simulated at 1 msec.
50 subjects were enrolled in this study, including 36 PD patients and 14 healthy controls (HC) (aged 47-81 yrs). All the subjects underwent MRI and a 60 min 11C-PE2I PET scan(in plane resolution 1mm, slice thickness 2mm, temporal resolution 3min, matrix size 400*400*109). PET images were firstly co-registered to MRI and then into AAL atlas (FSL, Oxford, UK).
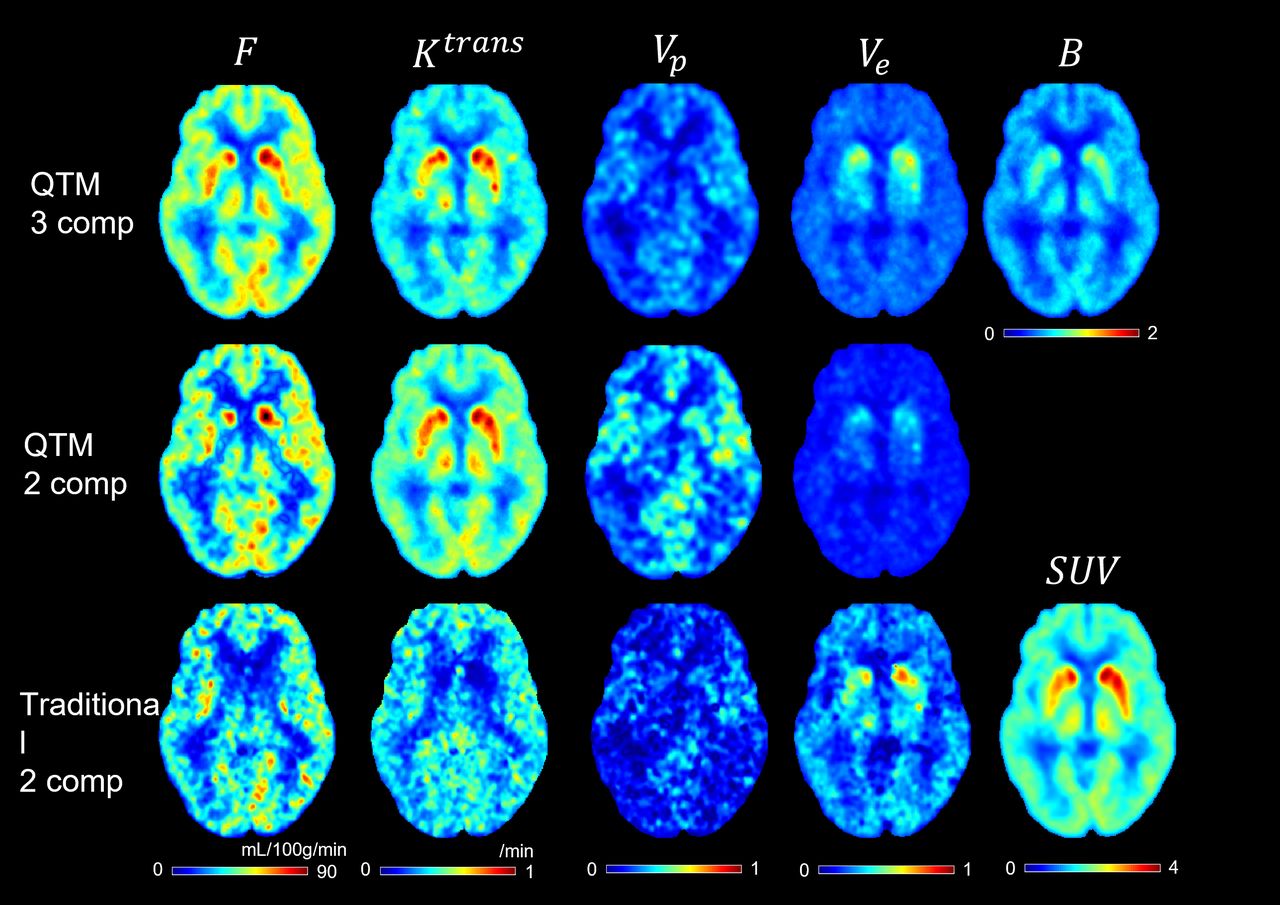
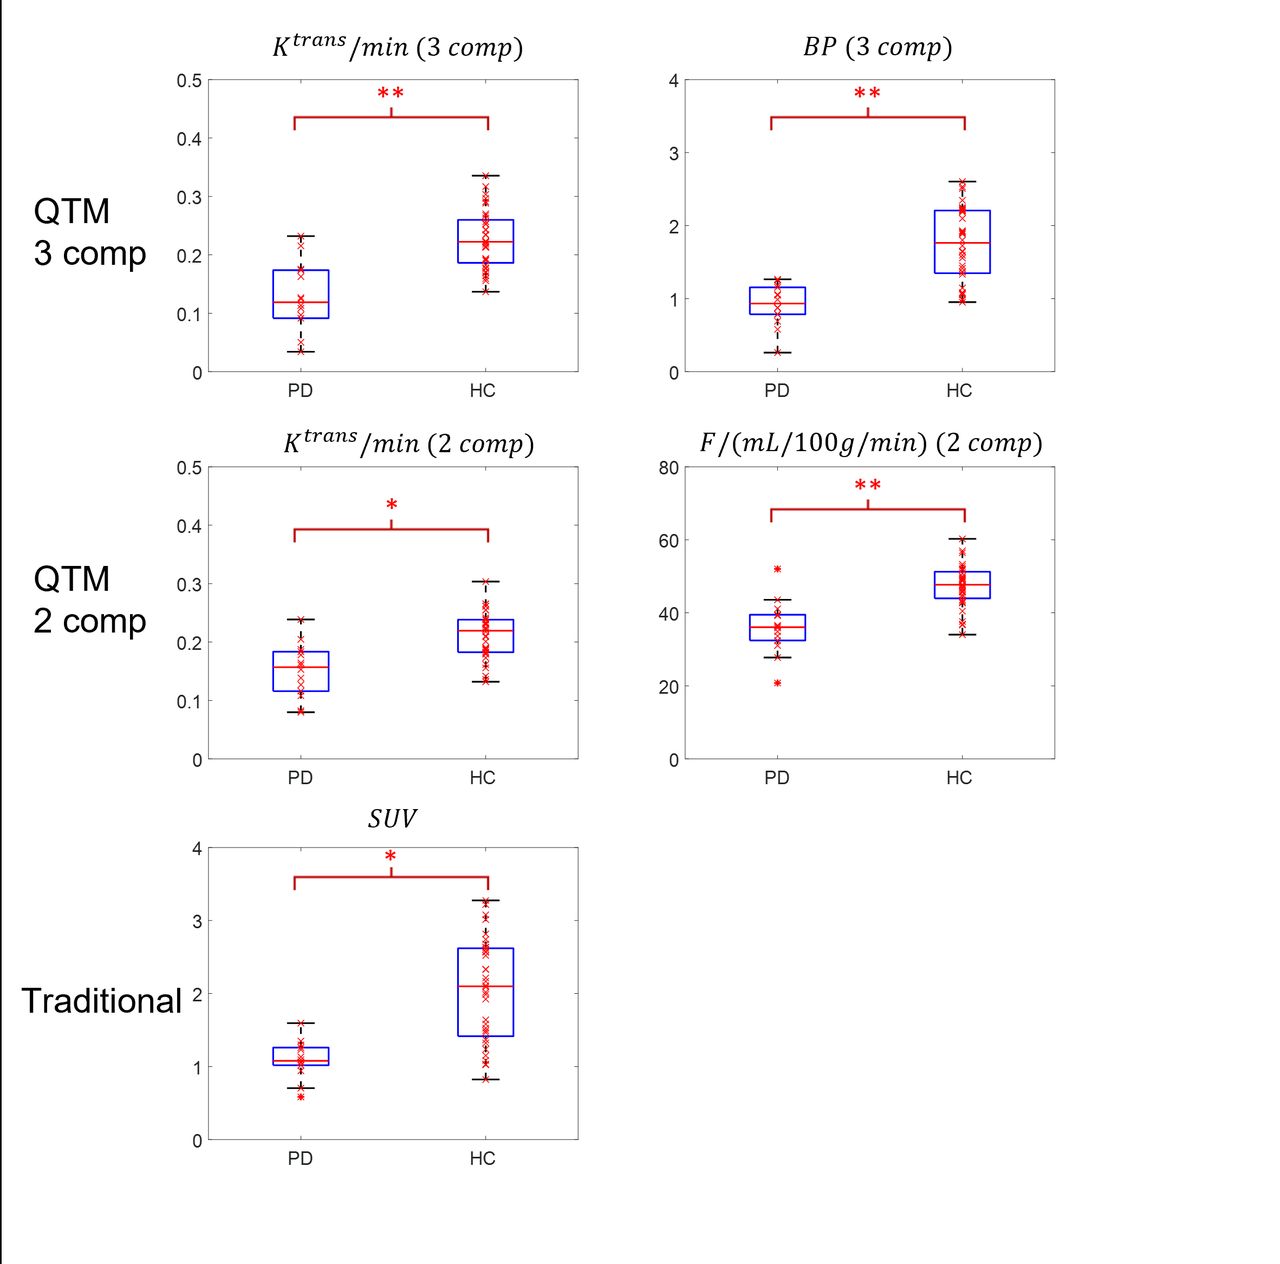
Results: An example of F, Ktrans, Vp,Ve,BP and SUV maps by the three methods in a 72 yr patient isillustrated in Fig.1. Box plots of the significant perfusion parameters measured at basal ganglia regions are summarized in Fig.2. Significantly lower Ktrans and BD of PD patients comparing with HCs were observed in basal ganglia using model 1: Ktrans was 0.12±0.05 /min for PD patients and 0.22±0.08/min for HCs (p=0.001); BD was 0.87±0.35 for PD patient and 1.63±0.90 for healthy volunteer (p=0.001). Significantly lower F and Ktrans of PD patients comparing with HCs were observed using model 2: perfusion F in basal ganglia was 32.08±8.78 mL/100g/min for PD patients and 48.25±4.95mL/100g/min for HCs (p=0.003); Ktrans is 0.14±0.06/min for PD patients and 0.20±0.09/min for HCs (p=0.03). A significantly lower SUV was observed: SUV was 1.05±0.48 for PD patients and 2.12±1.01 for HCs (p=0.04). No significant difference between PD and HC was observed in parameters from model 3.
Conclusions: QTM provides fully automated quantification based on fluid mechanics without AIF and with local mass conservation. The 3-compartment QTM (vascular space, extra vascular space, and binding rate) quantification of [11C]PE2I PET provided the best differentiation between PD and HC (capillary permeability and binding rate). The traditional global AIF based quantification failed to provide differentiation between PD and HC.
Future study may include further refinement of the QTM compartment models and longitudinal study of PD patients to test the perfusion parameter change with PD progression, and comparison of perfusion parameters of PD patients in different stage.


In this issue


Jump to section
Related Articles
Cited By...
- No citing articles found.