


Visual Abstract

Abstract
Total-body PET/CT images can be rendered to produce images of a subject’s face and body. In response to privacy and identifiability concerns when sharing data, we have developed and validated a workflow that obscures (defaces) a subject’s face in 3-dimensional volumetric data. Methods: To validate our method, we measured facial identifiability before and after defacing images from 30 healthy subjects who were imaged with both [18F]FDG PET and CT at either 3 or 6 time points. Briefly, facial embeddings were calculated using Google’s FaceNet, and an analysis of clustering was used to estimate identifiability. Results: Faces rendered from CT images were correctly matched to CT scans at other time points at a rate of 93%, which decreased to 6% after defacing. Faces rendered from PET images were correctly matched to PET images at other time points at a maximum rate of 64% and to CT images at a maximum rate of 50%, both of which decreased to 7% after defacing. We further demonstrated that defaced CT images can be used for attenuation correction during PET reconstruction, introducing a maximum bias of −3.3% in regions of the cerebral cortex nearest the face. Conclusion: We believe that the proposed method provides a baseline of anonymity and discretion when sharing image data online or between institutions and will help to facilitate collaboration and future regulatory compliance.
Improving the resolution of medical imaging systems and facial recognition algorithms has given rise to concerns about the identifiability of CT, MRI, and PET image data. In any imaging study including the head, the surface of the 3-dimensional (3D) volume can be rendered to visualize the subject’s face. When shared outside a health-care setting, such an image could be recognizable to an individual or computer vision system, potentially compromising the confidentiality of any findings or linked information. With the introduction of total-body PET/CT, images of the entire human body can be acquired during normal clinical or research examinations (1,2). Renderings of total-body images contain all the same facial information as dedicated brain studies, as well as any sensitive or identifiable structure in the remainder of the body. Total-body PET/CT is a growing field with diverse and valuable prospects, making such concerns all the more pressing (3–6). Continued use of total-body PET/CT must consider how differences from conventional PET/CT may compromise patient privacy and anonymity. This is especially true when data are shared between institutions or uploaded to online research archives, a practice that will likely become more common given recent changes to the National Institutes of Health policies on data sharing (7–9).
Prior studies have focused on the degree to which surface-rendered MRI and CT images are identifiable to a subject’s photograph (10–15). The identifiability of PET images using various tracers and changes to quantification after defacing were first studied in 2022 (16). These studies typically assume a motivated attacker with access to several photographs of a subject, and knowledge that the subject’s CT or MRI study exists within a certain cohort. Under these conditions, the chances of correct identification can approach 100% for MRI data (15). Defacing and refacing can reduce this probability to 8%, using a method in which face regions are registered to and replaced with a population average (16). These methods are all tailored for dedicated head scans and assume some approximate position of the face within the imaging field of view. Working with total-body data presents the challenge that the face is not restricted within the field of view and that the head is typically not fixed. Patient height, rotation of the head, and positioning of the arms can all complicate the process of locating the patient’s face as part of the defacing process.
The uEXPLORER PET/CT scanner is the first total-body PET/CT scanner and was installed at the University of California–Davis Health in 2019 for clinical and research use (1,17). The uEXPLORER has an axial field of view of 194 cm, permitting simultaneous PET acquisition of the whole body. The uEXPLORER also contains an 80-row 160-slice CT scanner capable of image acquisition with a minimal slice thickness of 0.5 mm. A head-to-foot CT scan is acquired with each PET scan and used for attenuation correction and anatomic localization. Because of the potential for high-resolution, low-noise imaging of the whole body, we believe that facial anonymization is an important consideration for data acquired on the uEXPLORER or any other high-resolution PET scanner with a long axial field of view.
In this work, we first present a method for surface rendering of total-body PET/CT data obtained from the uEXPLORER scanner. Subsequently, we present a method to locate and obscure faces in a way that provides a baseline of anonymity when sharing data. After applying our defacing workflow, we then tested the identifiability of the initial and defaced PET and CT images using a facial recognition system built on Google’s FaceNet (18,19). Finally, we have considered the use of a defaced CT scan for attenuation correction during PET reconstruction to evaluate the impact of CT defacing on PET quantitation.
MATERIALS AND METHODS
uEXPLORER PET/CT Data Acquisition
In this work, we used a group of healthy volunteers who underwent uEXPLORER [18F]FDG PET/CT scanning at multiple time points during a single visit. The study was approved by the Institutional Review Board at the University of California–Davis, and all subjects provided written informed consent. One cohort of 15 participants was injected with 20 ± 2 MBq of [18F]FDG and underwent total-body PET/CT imaging at 0, 1.5, and 3 h after injection. A second cohort of 15 participants was injected with 372 ± 17 MBq and underwent 6 PET/CT scans at 0, 1.5, 3, 6, 9, and 12 h after injection. In full, the study contained 30 participants, 16 of whom were female (mean age, 47 ± 13 y; mean body mass index, 28 ± 5 kg/m2; mean height, 175 ± 10 cm), with 135 PET scans and 135 CT scans. CT images were reconstructed with a voxel size of 0.97 × 0.97 × 2.3 mm, whereas PET images were reconstructed with a 2.3-mm isotropic voxel size. The details of each acquisition for the 2 cohorts are shown in Table 1.
Scan Details for 30 Subjects Imaged at 3 or 6 Time Points
For all 30 participants, the CT scan obtained at the 90-min time point was acquired following the PET/CT clinical low-dose protocol with 140 kVp, an average of 50 mAs, and automatic dose modulation. For all other time points, the CT scan followed a research ultra-low-dose protocol with 140 kVp, an average of 5 mAs, and automatic dose modulation.
PET imaging was performed for 60 min at the first time point (0–60 min) and 20 min for all other scans (e.g., 90–110 min). The PET image at the initial time point was reconstructed from 40 to 60 min to produce a static image matching the acquisition duration of other time points. Reconstructed PET images from all other time points were generated from data acquired over 20 min. As the injected activity decays over time, it is expected that the quality of surface-rendered images will also decrease.
Surface Rendering
Rendering of surfaces from PET or CT follows several steps. The first is identification of an optimal threshold to create a binary image, capturing the surface structure from either modality. In CT, Otsu’s method (20) for binarization is applied to the central transverse slice. In PET, half the mean value of the central coronal slice is used as the threshold. Voxels exceeding the threshold and not attached to the largest region (the body) are removed to provide a clearer surface rendering. In the second step, a 2-dimensional distance image is computed in which pixel value represents the distance from the back of the imaging volume to the first nonzero voxel in the binary image mask. The third step is computing of the 2-dimensional Sobel filter on the distance image, with gradient values being clipped at 10 times the pixel size for PET or 20 times the pixel size for CT. Finally, for a more realistic rendering, the gradient image is inverted. This step ensures that pixels in flatter regions are brighter and that those on edges are darker, creating a more natural-looking, front-lit image (Supplemental Fig. 1; supplemental materials are available at http://jnm.snmjournals.org).
Other software packages exist for rendering surfaces from 3D image volumes and have been used successfully in dedicated head and brain studies (15,21). Our purpose in developing a custom rendering process was to establish a fast, automated method optimized for total-body data. Furthermore, we wished to minimize external dependencies, for easier integration into an in-house defacing workflow.
Face Detection and Blurring
For face detection in the rendered images, 2 methods were used. In the first method, a multitask cascaded convolutional neural network (MTCNN) was trained for face detection (22,23). This approach requires minimal preprocessing and is robust for varying face angle and lighting. However, we found that the MTCNN struggles to identify faces in low-resolution images or when facial features are not prominent, as may occur in rendered PET images. In the second method, a Haar cascade classifier was implemented in OpenCV (24). This approach is computationally inexpensive but more susceptible to noise and false-positives. Compared with the MTCNN detector, we found that this approach may not accurately detect faces at an angle or in different lighting conditions.
The MTCNN face detector was applied first, as we found it to provide an accurate face-bounding box with few false-positive detections. If no face was identified by the MTCNN detector, the Haar cascade classifier was applied as a fallback option since it could be tuned for greater sensitivity. The resultant bounding boxes tended to be smaller, with a greater tendency for false-positives on nonface regions.
The process of obscuring the face in a 3D volume followed several steps. The first was to create a 3D mask of face and nonface voxels using the 2-dimensional distance image and the coordinates of the face rectangle identified by the face detection algorithm. The 3D mask indicates the surface of the face and can be extended to cover an appropriate volume. In our case, we extended the mask 1 cm inward and 3 cm outward from the face surface. The second step was to down-sample the original image by a factor of 8 and then up-sample to create a pixelated or blurred version of the input with equal dimensions. Linear interpolation was used while resampling to preserve an approximation of a face structure without any clearly identifying features. The third step was to replace voxels in the original image with those in the pixelated image according to the 3D face mask.
Defacing Workflow
The defacing workflow (illustrated in Supplemental Fig. 1) consists of creating a surface rendering, identifying the face position in the image, and blurring the corresponding surface in the input 3D image. This workflow was applied to PET and CT images acquired for all subjects at all time points. We subsequently visually evaluated whether the face detection algorithm had correctly identified a face in each image. Visual evaluation allowed us to gauge the quality of rendered images, to tune the binarization threshold selection and image contrast to provide more realistic renderings, and to ensure that the pixelation process sufficiently obscured the face. All algorithms were implemented in Python, version 3.10, and run on a dedicated server without multithreading or acceleration. Defacing a single PET or CT image took approximately 16 s and 8 GB of memory. Code for running the defacing workflow is available at a public GitHub repository (https://github.com/aaron-rohn/total-body-anonymization).
Facial Recognition and Validation
We further validated our method by quantifying the identifiability of PET and CT images before and after defacing. An implementation of FaceNet was used to map each face image to a 128-dimension embedding vector, where Euclidian distance is used as a measure of similarity (18,19). After embeddings for a cohort are measured, clustering methods can be applied to identify distinct members.
We first considered the 15 participants of the full-dose cohort since images could be rendered at 6 separate time points (90 images for each modality). After rendering and creating facial embeddings for each PET and CT image, a nearest-neighbor classifier was used to identify the most likely matching subject. Cross validation was repeated 6 times (folds), at each stage leaving out 1 time point for each subject during training. The remaining time point was then used for testing. Accuracy at each stage was then measured as the fraction of faces matched to the correct subject and averaged over the 6-folds. To create a visual representation of clusters within the 128-dimension FaceNet-generated embeddings, we applied t-distributed stochastic neighbor embedding (t-SNE) to reduce dimensionality from 128 to 2 and plotted the resulting values (25). To estimate the degree of clustering in t-SNE plots, the mean within-cluster and between-cluster deviations were measured. Deviation was measured as…
where n is the number of imaging time points and  is the centroid of the cluster on the t-SNE plot. For within-cluster deviation, the mean deviation was averaged over all subjects. For between-cluster deviation, the mean deviation of the per-subject centroids was calculated. The Levene test for unequal variance was used to calculate the likelihood that the within-cluster deviation was significantly different from that of the between-cluster deviation (26). P values are reported on the t-SNE plots. Significantly lower within-cluster deviation indicates identifiability. Within-cluster deviation equal to or greater than between-cluster deviation indicates a loss of identifiability.
In addition to these evaluations of the high-dose cohort, we measured the identifiability of CT images acquired from all 30 subjects at the first 3 time points only (90 images). We performed a similar series of cross-validations as well as clustering through t-SNE with this larger cohort.
When measuring the identifiability of PET images, we considered both PET-to-PET identification and PET-to-CT identification. The latter is more alike to some prior studies, which matched renderings to facial photographs (15,16). Identifiability was measured at each time point, as activity decayed and image quality decreased.
To verify the quantitative impact of our defacing method, we reconstructed PET raw data twice: first using the original CT image for attenuation correction and then using the defaced CT image for attenuation correction. Various brain regions of interest (ROIs) were compared with measured quantitative differences between the 2 reconstructed PET images. Five 1-cm-diameter spheric ROIs were placed at 5 positions along the outer aspect of the cerebral cortex, from the front of the brain moving posteriorly. The selected transverse plane was near the top of the defaced region, just above the brow. The relative difference at each point was measured and plotted.
RESULTS
Performance of Automated Workflow
Among 135 CT images, faces were correctly identified for all subjects using the MTCNN detector, and the Haar cascade classifier was not needed as a fallback option. The CT protocol (low-dose vs. ultra-low-dose) had no major visual impact on the quality of the rendered image or the performance of the face detector (Fig. 1). Among the 135 PET images (Fig. 2), the success of the face detector was influenced by the image activity; high-activity images produced renderings of the face with lower noise and a smoother surface, from which faces were more easily identified. The MTCNN detector performed better at earlier time points, and the Haar cascade classifier was necessary for robust face detection at later time points (Supplemental Fig. 2). In either case, faces were completely obscured after correct detection in all cases (Fig. 2, bottom).

(Top) Faces rendered from CT images at 6 time points. Ninety-minute time point used clinical low-dose CT protocol. All others used research ultra-low-dose protocol. (Bottom) Rendering of defaced images at each time point.

(Top) Faces rendered from PET images at 6 time points. (Bottom) Rendering of defaced images at each time point.
CT Identification Accuracy—Full-Dose Cohort
Before defacing, faces rendered from CT scans were matched to the correct subject at a rate of 96% ± 4%. After defacing, faces were matched in 10% of cases, marginally exceeding the probability of random chance (7%, 1/15). In the t-SNE plot before defacing (Fig. 3A), 15 well-defined clusters corresponded to faces rendered from the CT images of each subject. Variance of the within- and between-cluster deviance was statistically different in the original CT images, with a P value of 8.53 × 10⁻²⁰. After defacing, no statistical difference was observed between with within- and between-cluster deviance, with a P value of 0.668. The absence of subject-specific clusters after facial blurring (Fig. 3B) implies a relative loss of distinction between faces.

(A) Facial embeddings for 15 full-dose cohort subjects at 6 time points, plotted in 2 dimensions using t-SNE. Before defacing, facial embeddings are highly clustered. (B) After defacing, data are no longer clustered.
CT Identification Accuracy—Full- and Low-Dose Cohorts
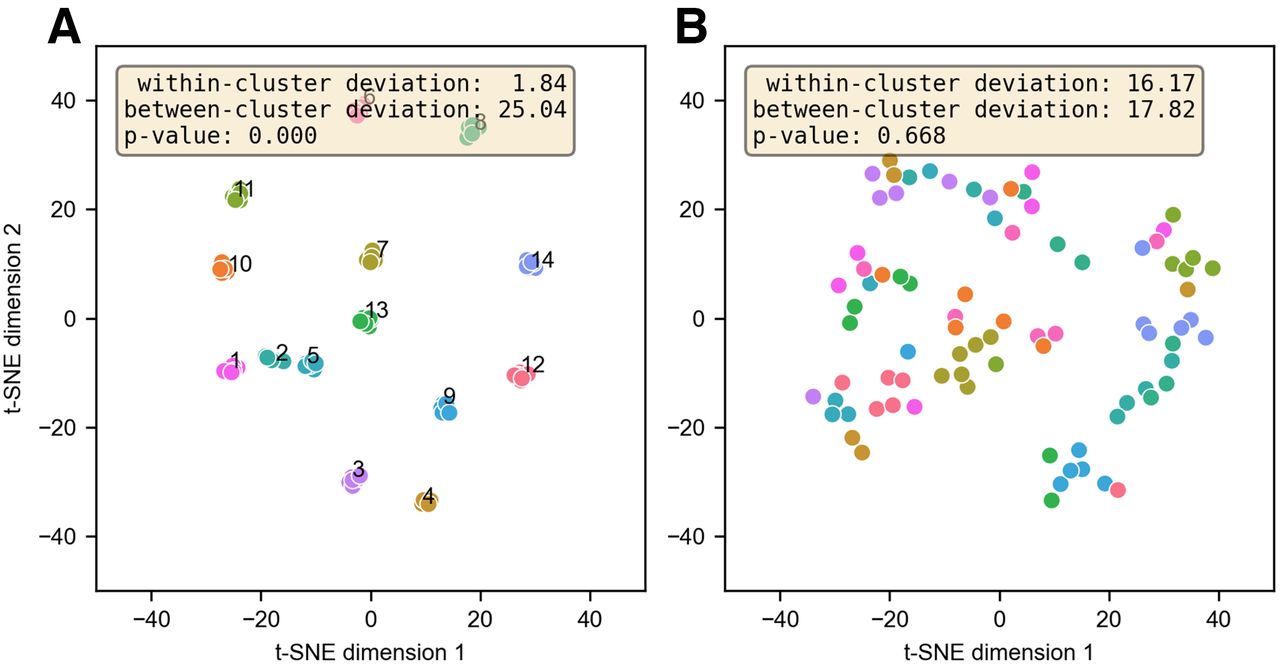
When the first 3 time points were used for all 30 subjects, the identification accuracy of rendered images from CT scans was 93% ± 3%. After anonymization, faces were matched in 6% of cases, marginally exceeding the probability of random chance (3.3%, 1/30). The t-SNE plots showed 30 distinct clusters corresponding to each subject—the P value for clustering was 3.32 × 10⁻²⁶ (Fig. 4A). After defacing, the P value for clustering was 0.211, indicating a loss of identifiability (Fig. 4B). Some clusters were still present after defacing; these were random and related to t-SNE parameter selection. The number of clusters was less than the number of subjects, and subjects were no longer uniquely associated with individual clusters.

(A) Facial embeddings for all 30 full- and low-dose cohort subjects at first 3 time points. Before defacing, clusters are present for each participant. (B) After defacing, participants are not uniquely associated with clusters.
PET Identification Accuracy—Full-Dose Cohort
In cross-validation of faces rendered from PET images, identifiability depended on the imaging time point (Table 2). PET-to-PET identifiability reflects the accuracy of a classifier trained using PET images only, when querying the identity of a PET image. PET-to-CT identifiability reflects the accuracy of a classifier trained using CT images, when querying the identity of a PET image. Before defacing, the maximum PET-to-PET identifiability was 64% and PET-to-CT identifiability was 50%, both at the initial 40-min time point. After defacing, the average PET-to-CT and PET-to-PET identifiability were both 7%, equivalent to the probability of random chance (7%, 1/15).
Identifiability of PET Images Using Classifier Trained with PET (PET-to-PET) or CT (PET-to-CT) Images
The P value for clustering in the original PET images was 0.03, although the magnitude of the difference between the within- and between-cluster deviations was less than for CT-derived faces (Fig. 5A). The P value for clustering after defacing was 0.035, in this case indicating that the within-cluster deviation was significantly greater than the between-cluster deviation, as is consistent with a lack of identifiability (Fig. 5B).

(A) Facial embeddings for 15 full-dose cohort subjects at 6 time points. Clustered facial embeddings for PET images indicate modest but significant (P < 0.05) degree of identifiability. (B) No clusters are present after defacing. Within-cluster deviation is significantly greater than between-cluster deviation.
PET Quantitation with Anonymized CT for Attenuation Correction
After reconstruction of the PET raw data with the original and defaced CT scans, the images were qualitatively similar (Fig. 6A). The normalized difference approached 30% in the face and around the chin and eyebrow, in the regions where the CT image was modified (Supplemental Fig. 3). Immediately behind the face and modified regions, the percentage change decreased rapidly. As shown in Figure 7, the difference in PET activity in ROI 0, nearest the modified face region, was −3.3%. In ROI 4, the difference was −0.24%.

(A) Grid showing CT slices before and after defacing. PET images are reconstructed from same raw data, with different CT scans for attenuation correction. (B) Normalized difference image showing percentage change in PET activity. High-intensity region in brain largely overlaps ventricles, which have low [18F]FDG uptake. (C) Absolute difference in PET SUV.

(A) Percentage change when using defaced CT for PET attenuation correction. Values were measured at 5 spheric ROIs along cerebral cortex. Error bars correspond to SD within ROI. (B) Difference image and corresponding CT slice, overlaid with 5 ROIs.
DISCUSSION
The proposed workflow reliably detected and obscured faces in both CT (Fig. 1) and [18F]FDG PET (Fig. 2) images. It should also scale equally well to other tracers, provided that there is sufficient superficial uptake and that an appropriate threshold for binarization is selected. Validation will be required, however. Images in this study included scans with both arms up and arms down and of patients with a range of heights and sizes—factors that pose a unique challenge to defacing in total-body PET images. Although the quality of the facial rendering is consistently high in CT (Fig. 1), PET images vary greatly depending on the degree to which the radiotracer has decayed, resulting in degraded image quality (Fig. 2). At delayed time points (or when scan duration or injected activity is reduced), automated face detection is prone to false-negative and -positive detections due to increased image noise (Supplemental Fig. 2). In these cases, however, the images retain fewer potentially identifying facial features. For reference, the 3-h time point in the high-dose cohort is closest to the standard clinical protocol used at our institution (296 MBq, 120 min after injection) (17). At this time point, PET-to-CT identifiability was 28.6% (Table 2).
In our validation, we found that identifiability between modalities (PET-to-CT) was generally lower than that within a single modality (Table 2). This difference likely reflects the changing appearance of faces rendered from PET and CT. PET images have a lower resolution, and patterns of [18F]FDG uptake may not directly correspond to the structures imaged in CT. This difference in identifiability is notable since prior studies on image defacing have focused primarily on the identifiability of medical images to photographs, such as those mined from social media (16). Using the Microsoft Azure Face application programming interface, 1 prior study measured an identification rate of 78% between faces rendered from CT and photographs (14). This rate is consistent with the high rate of CT-to-CT identification measured here, although different numbers of participants and methods for facial recognition will lead to different identification rates.
For most purposes, the defacing process should have no major impact on image quantitation. Image voxels outside the immediate region of the face are not altered. We have not tested the impact of our defacing process on automated brain segmentation methods, which may be impacted by defaced images (15). When defaced PET or CT images are used for reconstruction or reprojection, as in motion correction or other advanced applications, we expect that PET values outside the immediate region of the face should not show substantial changes beyond a few percentage points (Fig. 7). When defacing is called for, it is a necessary trade-off that the measured uptake or attenuation in regions around the nose, eyes, and cheeks will be altered substantially, potentially obscuring skin or other superficial lesions.
We note that for many institutions and applications, defacing of volumetric image data is not standard practice and is not currently required for regulatory compliance. Furthermore, whereas we have demonstrated identifiability of faces under very specific circumstances, these do not necessarily represent those of our presumed motivated attacker. As in any task of identifying anonymized data, there still exists the problem of the perfect register—a reference database with one and only one match for the desired target (27). Image data may indeed make creation of such a database more possible, since an individual’s face has the potential to be a highly identifying feature (as opposed to name, address, birthday, or other identifiers). However facial recognition is probabilistic, and images must still be mined from social media or elsewhere, which may not be trivial. Institutional bodies considering the adoption of defacing should weigh these factors against the associated complexity and loss of image information.
CONCLUSION
We have described a method for defacing total-body [18F]FDG PET and CT data that makes facial identification of volumetric images more challenging and has a minimal impact on PET quantification. We believe that the presented workflow provides a baseline of patient privacy and discretion and will be a valuable component of data-sharing workflows, which are expected to become more widespread in the future.
DISCLOSURE
This work was funded in part through National Institutes of Health grants R01CA249422 and R01CA206187. The University of California–Davis has a research agreement and a sales-based revenue-sharing agreement with United Imaging Healthcare. No other potential conflict of interest relevant to this article was reported.
KEY POINTS
QUESTION: What are the unique privacy concerns from surface renderings in total-body PET/CT, and how can we mitigate them?
PERTINENT FINDINGS: Total-body PET/CT images are identifiable and uniquely sensitive because of their capacity for rendering of the whole surface of the body. The presented defacing workflow minimizes the possibility of facial identification without impacting image quantitation.
IMPLICATIONS FOR PATIENT CARE: Image processing developments that benefit patient care often depend on the availability of large volumes of image data. Robust anonymization processes, such as facial anonymization, help to support the requisite data sharing and archiving.
Footnotes
Published online Jun. 2, 2023.
- © 2023 by the Society of Nuclear Medicine and Molecular Imaging.
REFERENCES
- Received for publication December 1, 2022.
- Revision received March 30, 2023.
In this issue


Jump to section
Related Articles
Cited By...
- No citing articles found.