


Abstract
3281
Introduction: The commonly employed standardized uptake value ratio (SUVR) and Centiloid scale (CL) metrics to quantify extracellular Aβ-amyloid (Aβ) plaques are influenced by PET spatial resolution. The choice of reconstruction algorithm and associated parameters are primary factors that effect the quantitation. There has been limited research on the impact of PET reconstruction on Aβ-PET quantitation (Akamatsu et al, 2016; Lindström et al, 2020). We examined the impact of PET spatial resolution, as determined by reconstruction configuration choices, on Aβ-PET quantitation in cross-sectional and longitudinal studies.
Methods: Cross-sectional study: Data for 89 subjects with [18F] florbetapir scans (44 Aβ-, 45 Aβ+) were reconstructed using 69 reconstruction configurations across reconstruction algorithms (OP, OP+TOF, OP+TOF+PSF), number of subsets, number of iterations and post-reconstruction Gaussian smoothing. For each reconstruction, Aβ-PET SUVR was calculated using CapAIBL and the spatial resolution was estimated by calculating full width at half maximum (FWHM) using the barrel phantom method (Lodge et al, 2018). The change of Aβ-PET SUVR and the effect size of the difference in Aβ-PET SUVR between Aβ- and Aβ+ groups with FWHM was examined.
Longitudinal study: 79 subjects with three [18F] flutemetamol scans within a five year period were analysed. All scans were reconstructed using one low-resolution (OP with 4 iterations, 4 subsets and 2 mm post-reconstruction Gaussian smoothing) and two high-resolution (OP+TOF and OP+TOF+PSF with 4 iterations, 21 subsets, no post-reconstruction Gaussian smoothing) reconstruction configurations. Aβ CL was quantified for all scans using CapAIBL. Subjects were divided into Aβ- and Aβ+ groups before analysis using Aβ CL=20 from the low-resolution baseline scan as the Aβ positivity threshold. For each reconstruction configuration, rate differences between second and first periods were calculated for all the subjects and compared using right- and left-tail Mann-Whitney U tests in both Aβ- and Aβ+ groups, respectively. Zero rate difference was used as a consistency metric. Positive gradients of lines-of-best-fit were used to identify Aβ accumulators.
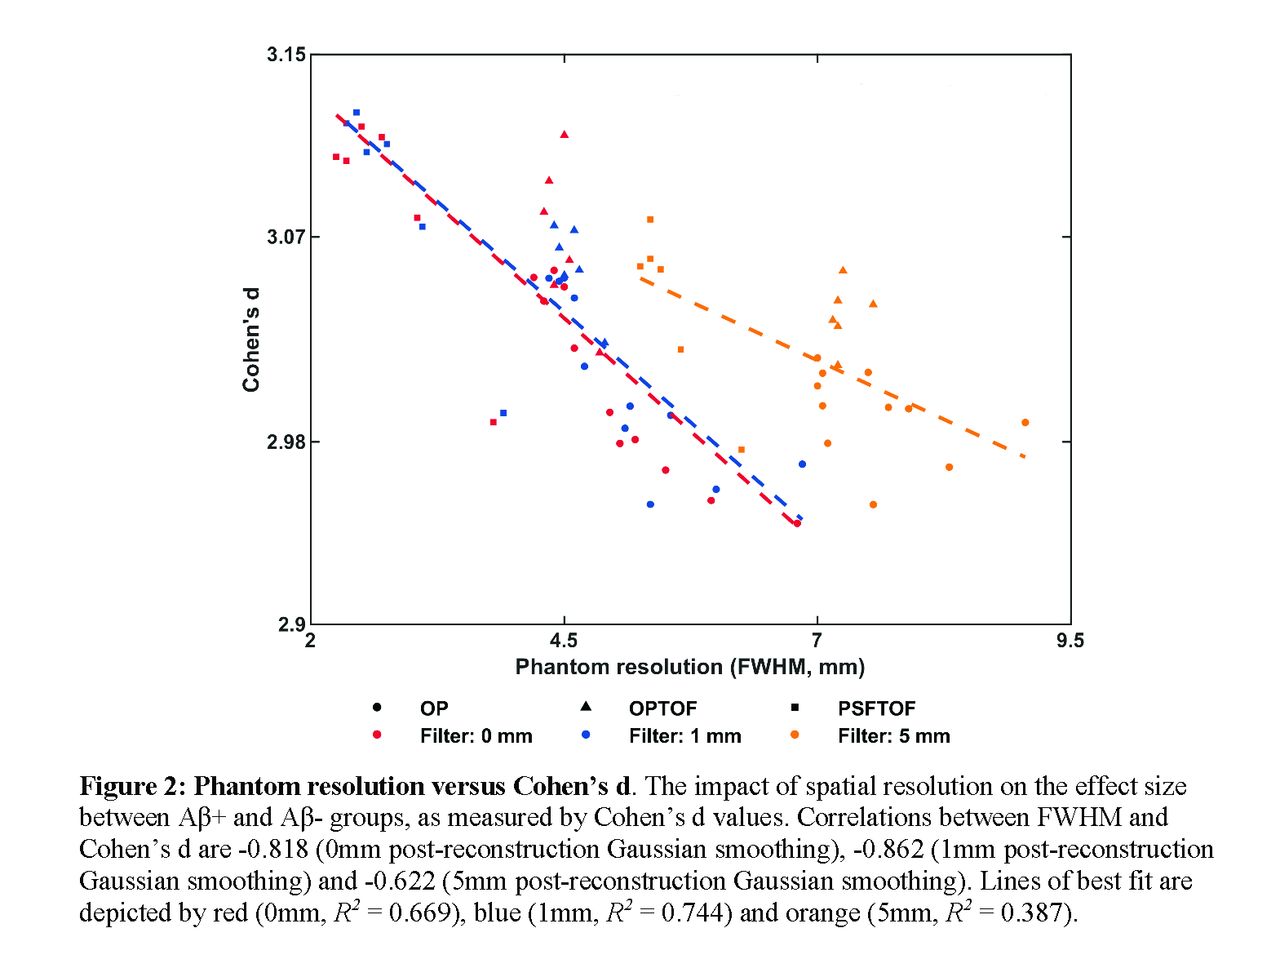
Results: Cross-sectional study: SUVRs in both Aβ- and Aβ+ groups were impacted by the spatial resolution of the reconstruction method; Aβ- SUVRs increased for FWHM of 4.5 mm or more, while Aβ+ SUVRs decreased with FWHM. High-resolution reconstructions provided the best statistically significant separation between groups.
Longitudinal study: In the Aβ- group, the median rate difference of low-resolution OP reconstructed data was greater than zero and trended towards a significantly larger value than high-resolution OP+TOF (p = 0.06) and OP+TOF+PSF (p = 0.08) rate differences that were close to zero, indicating less consistent rates in the low- than high-resolution data. A significant change in rate differences between reconstructions was not observed in the Aβ+ group. High-resolution reconstructions identified 10 additional Aβ accumulators in Aβ- group compared to the low-resolution reconstructions. No notable difference in the number of accumulators in the Aβ+ group between reconstructions was identified.
Conclusions: High-resolution PET reconstructions can facilitate improved Aβ-PET quantitation in both cross-sectional and longitudinal Aβ-PET data, given less susceptibility to partial voluming with increased spatial resolution. We demonstrated improved separation between Aβ- and Aβ+ groups in cross-sectional SUVR analysis with high-resolution reconstructions, along with identification of more numerous Aβ accumulators among Aβ- subjects. Our longitudinal analysis demonstrated better consistency of results in high- compared to low-resolution reconstructions, indicated by less Aβ CL rate variation over the maximum five year interval of the longitudinal study.


