


Abstract
3128
Introduction: Metabolic tumor volume (MTV) has been shown to be a strong independent prognostic factor in diffuse large B cell lymphoma (DLBCL). Calculating MTV can be tedious and time consuming using currently available semiautomatic software limiting its routine application in clinical practice. There can also be inherent variability to calculating MTV in that it requires manual input from the reader. Our goal was to develop a fully automated method for calculating MTV and to validate the algorithm by comparing the automated results with 2 experienced nuclear medicine (NM) readers.
Methods: The automated method designed for this study employed a deep convolutional neural network to segment normal physiologic structures from the CT scans which demonstrate intense avidity on FDG PET scans, including the brain, heart, kidneys, and bladder. The contours obtained for these structures were then automatically transferred and adapted to the PET scans according to their respective PET presentations. MTV was derived on the PET scans by thresholding with respect to 41% of the maximum SUV within the imaged body volume excluding the above-mentioned normal physiologic structures followed by filtering with a cutoff volume of 1 mL. The study cohort consisted of 50 patients with newly diagnosed DLBCL who were randomly selected from the Alliance/CALGB 50303 (NCT00118209) trial. De-identified imaging and clinical data were retrieved from The Cancer Imaging Archive (TCIA). MTV 41% and SUV of the lesion with the highest metabolic activity (SUV max) were analyzed for the included patients by 2 experienced NM physicians using the Hermes Affinity Viewer and compared to the fully automated results from the developed algorithm. For examining agreement, we estimated Pearson’s correlation coefficients and inter-class correlation coefficients (ICCs) along with corresponding 95% confidence intervals and p-values. For visualization, we displayed scatter plots and Bland-Altman plots between readers and the automated method. All tests were two-sided and statistical significance was considered when p<.05. Statistical software R was used for all statistical analyses.
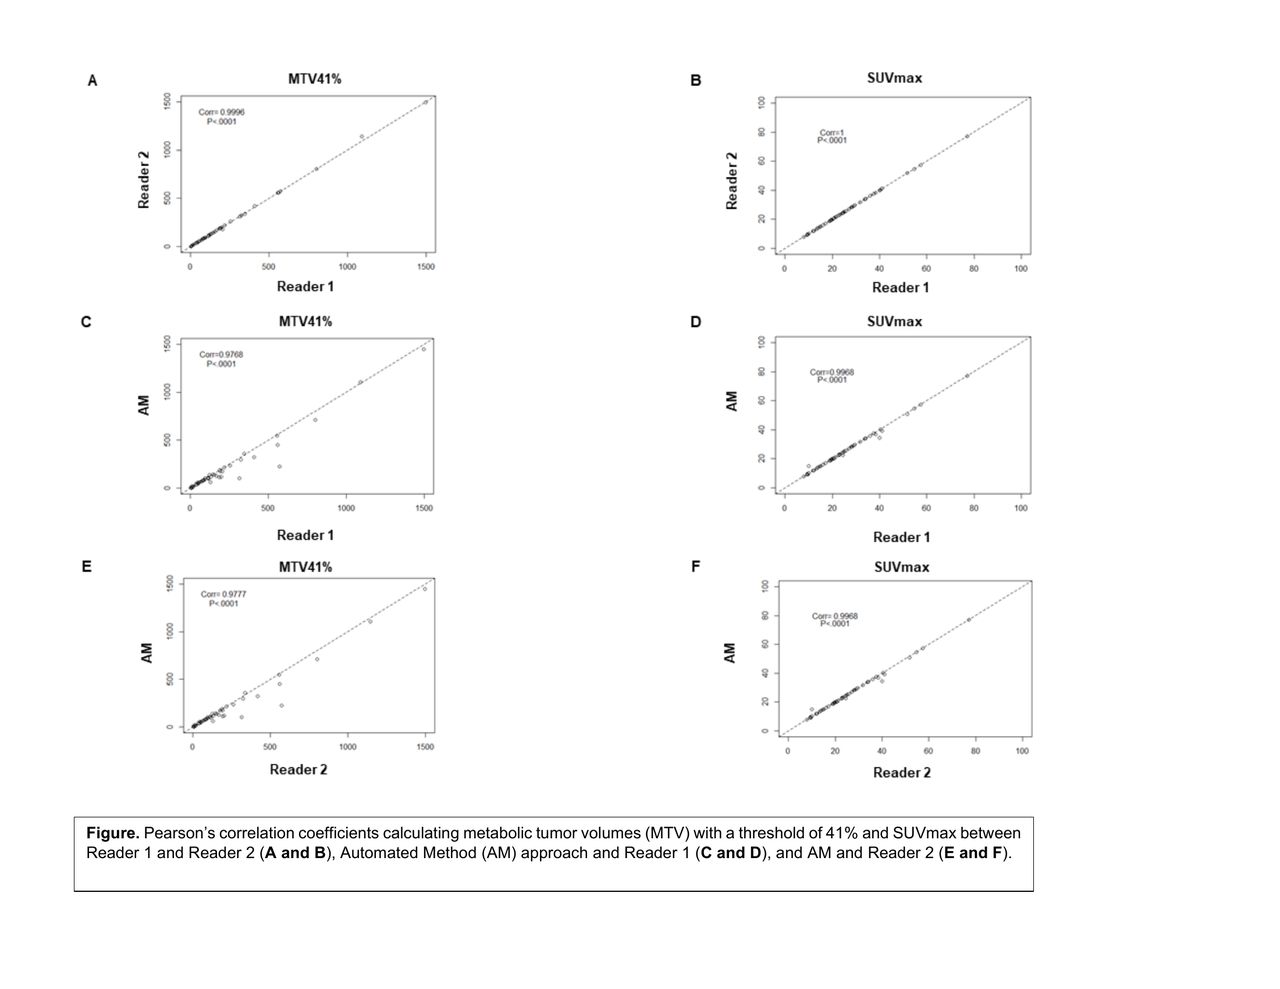
Results: The mean MTV 41% calculated by reader 1 (R1) was 198.79 mL (standard deviation (SD) 283.26 and coefficient of variation (CV) 1.425), for reader 2 (R2) was 199.45 mL (SD 286.82 and CV 1.438) and for the automated method (AM) was 176.52 mL (SD 269.23 and CV 1.525). Comparing R1 to R2, the Pearson’s correlation coefficients and ICCs were 0.9996, p<.0001 and 1, p<.0001 (95%CI=1 to 1) for MTV 41% and 1, p<.0001 and 1, p<.0001 (95%CI=1 to 1) for SUV max, respectively. Comparing R1 to AM, the Pearson’s correlation coefficients and ICCs were 0.9768, p<.0001 and 0.97, p<.0001 (95%CI=0.94 to 0.98) for MTV 41% and 0.9968, p<.0001 and 1, p<.0001 (95%CI=0.99 to 1) for SUV max, respectively. Comparing R2 to AM, the Pearson’s correlation coefficients and ICCs were 0.9777, p<.0001 and 0.97, p<.0001 (95%CI=0.94 to 0.98) for MTV 41% and 0.9968, p<.0001 and 1, p<.0001 (95%CI=0.99 to 1) for SUV max, respectively (Figure). The Bland-Altman plots showed only relatively small systematic errors between the proposed method and the manual readings across the entire data range being examined for both MTV 41% and SUV max (Supplemental data). Limitations of the segmentation algorithm occur when tumor activity is located in close proximity to normal physiologic structures such as the bladder or kidneys or when normal anatomy has been distorted either due to the disease process or image artifacts such as misregistration or patient motion.
Conclusions: The proposed automated method for calculating MTV is robust demonstrating a high agreement with 2 experienced NM readers. In order to determine whether the observed variability is significant for the purpose of risk stratifying patients, further investigation is needed comparing our results with clinical outcome data which is currently ongoing.


In this issue


Jump to section
Related Articles
Cited By...
- No citing articles found.