


Abstract
2327
Introduction: Cytotoxic T cells, which express CD8 cell surface protein, serve as key players in cell-mediated immune response against viral infections. Attention has been drawn to the expected importance of their role in response to COVID-19 infection, related pathological conditions, and vaccination response. However, 95% of T cells are in tissues, not the circulation; peripheral blood assays are complex; and tissue sampling has been minimal. To provide an in vivo quantitative measure of tissue distribution of CD8+ T cells, total-body imaging of a labeled minibody with high affinity to human CD8 (89Zr-Df-Crefmirlimab-Berdoxam) on the uEXPLORER PET/CT scanner was proposed. This pilot study aimed to quantify pathophysiological changes in CD8+ T cell distribution in patients recovering from COVID-19 and provide a step change in understanding the immunological response and role of T cells in COVID-19 morbidity and immunity.
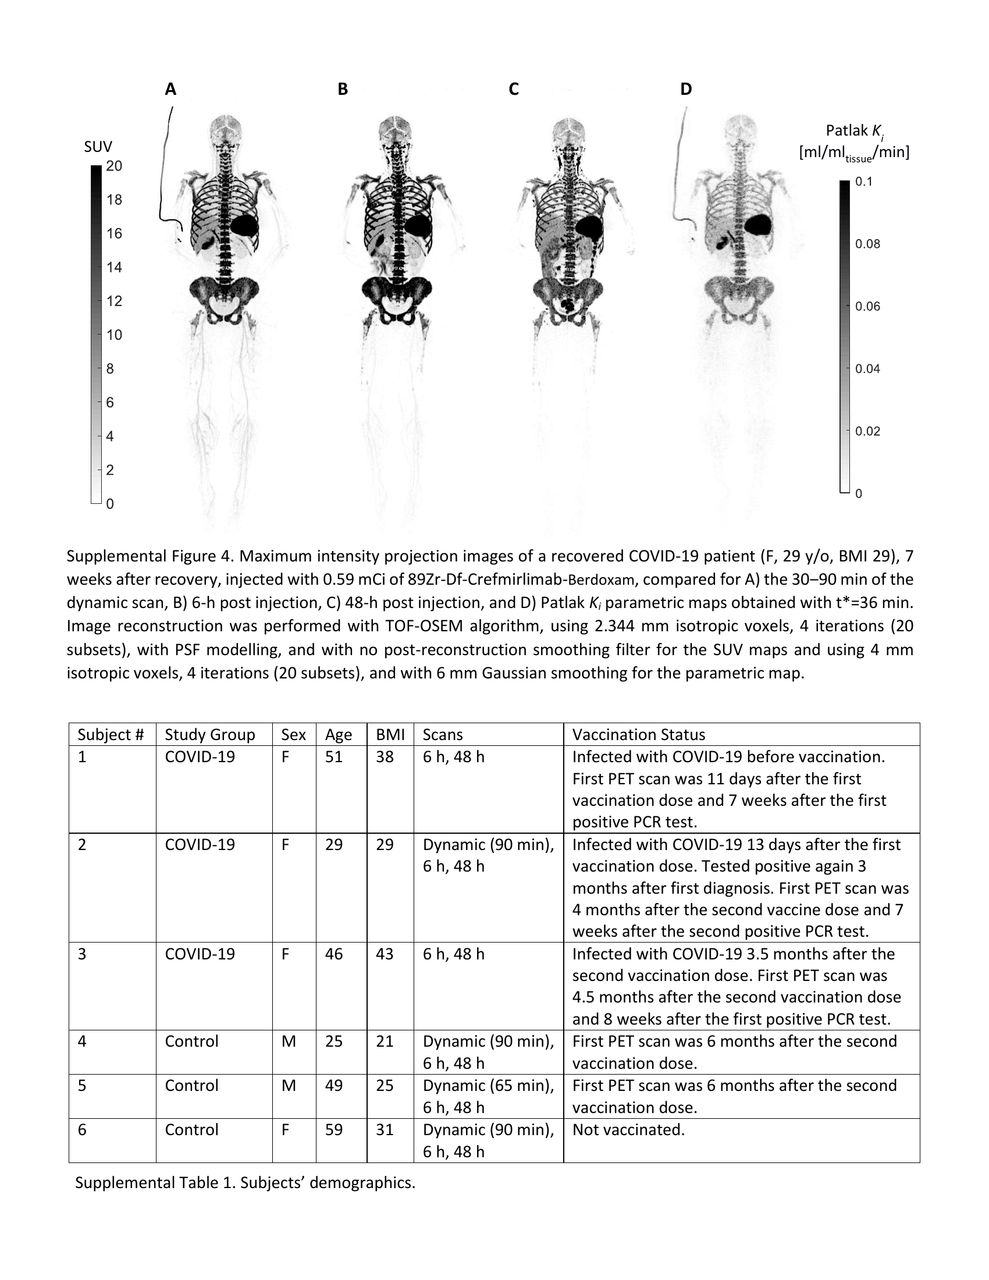
Methods: Six subjects were studied: 3 recovering COVID-19 patients (within 8 weeks of diagnosis, all vaccinated females, not hospitalized) and 3 healthy controls (2 vaccinated males, 1 unvaccinated female). Age range was similar between the two groups (25–59 y/o). Subjects received ~0.5 mCi of 89Zr-Df-Crefmirlimab-Berdoxam at mini-body mass dose of 1.5 mg, infused using a syringe pump over 10 min. Total-body 60-min PET/CT scans were performed on all subjects at 6-h and 48-h post injection. Control subjects and one COVID-19 subject had an additional 90-min dynamic scan. PET/CT scans of the COVID-19 patients were repeated after 4 months. For analysis, ~100 volumes of interest were drawn on each image to assess SUV in spleen, liver, bone marrow, lymph nodes, tonsils, large intestine, and aorta blood pool. Patlak model fitting was performed on the dynamic data (t*=36 min) to derive parametric images.
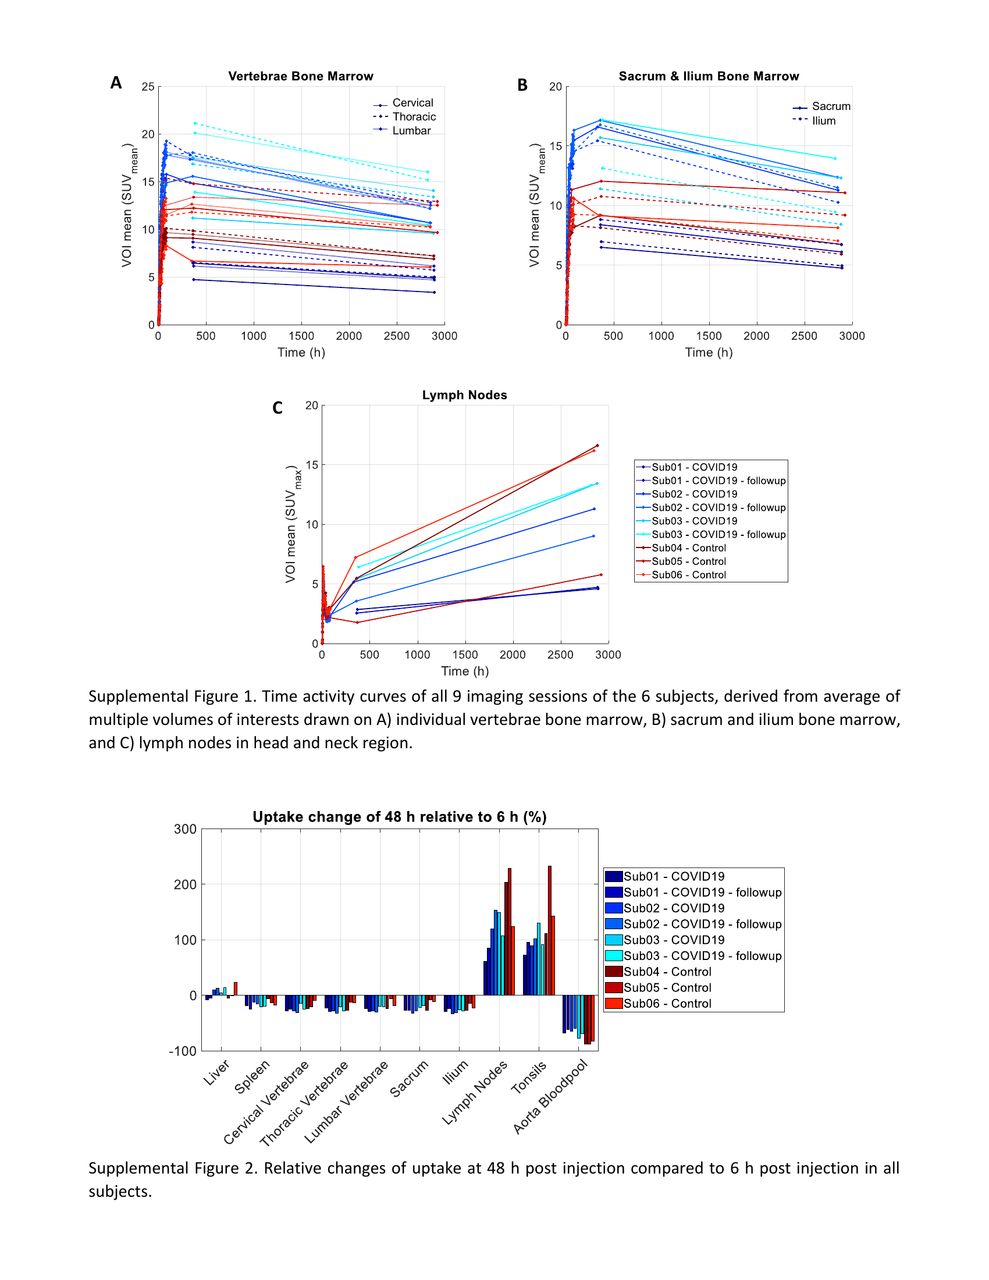
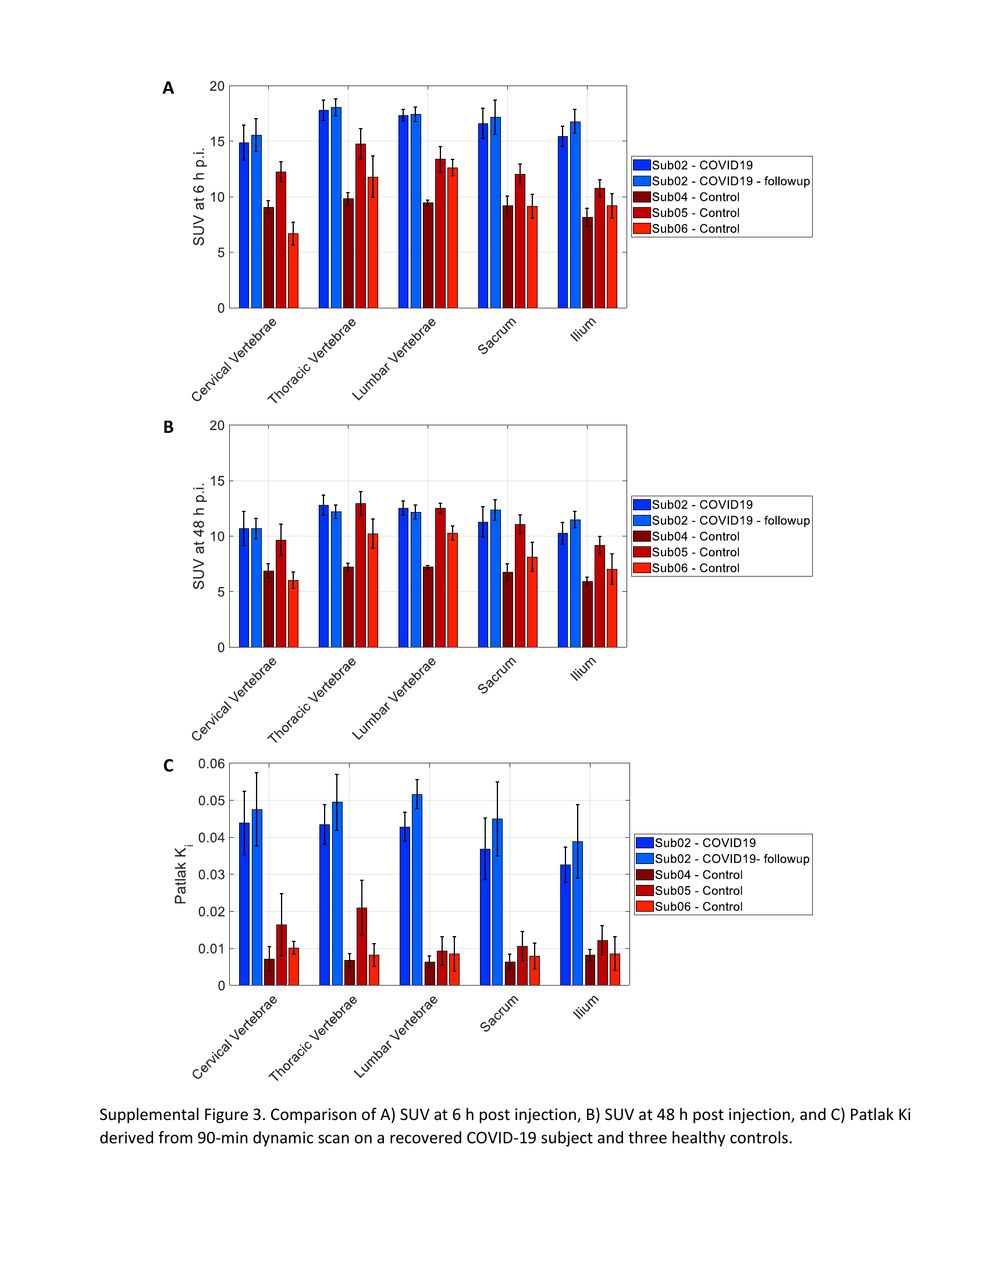
Results: In all subjects, the highest uptake was observed in spleen, followed by bone marrow. Extensive lymph node uptake was visible, most prominent at 48 h. Tracer biodistribution varied among subjects, but consistent trends were observed in time activity curves of all subjects, showing decrease of activity in bone marrow and spleen between 6 h to 48 h with parallel increase of activity in lymph nodes and tonsils, suggesting T cell trafficking. The measurements in vaccinated and unvaccinated controls were similar. Spleen uptake was higher in the 3 COVID-19 patients compared to controls. Bone marrow uptake varied among the COVID-19 subjects and 1 subject had substantially lower uptake. The 4-month follow-up scans showed similar biodistribution to the first imaging sessions in COVID-19 subjects, with on average 18% increase in bone marrow SUVmean at 6 h and 17% increase of Patlak Ki in the subject with dynamic scan. Comparing the Patlak Ki in bone marrow of the subjects with dynamic scans showed significantly larger differences between the COVID-19 and control subjects, compared to the differences observed in the SUVmean at 6 h or 48 h timepoints. In sacrum, ilium, and the 23 vertebrae, the SUVmean at 6 h was 1.2–2.3 times higher in the COVID-19 subject than the controls, whereas Patlak Ki was 2.1–8.2 times higher.
Conclusions: Total-body imaging of CD8+ T cells with sub-millicurie levels of 89Zr-labeled tracer resulted in high definition of the expected distribution of T cells in lymphoid organs and deriving high-quality Patlak parametric maps was possible. T cell migration over a 48-h period was demonstrated, along with a preliminary finding that recovering COVID-19 subjects have higher T cell mass compared to the controls. Preliminary results with Patlak modelling suggest that dynamic scans may provide more accurate measurements of T cell density, due to smaller kinetic effects from cell migration. This study makes a compelling case to explore such in vivo functional aspects of T cells across a wide range of COVID related conditions, vaccine response, and in clinical immunological research in general; using the unique tools that total-body PET provides.


In this issue


Jump to section
Related Articles
Cited By...
- No citing articles found.