


Visual Abstract

Abstract
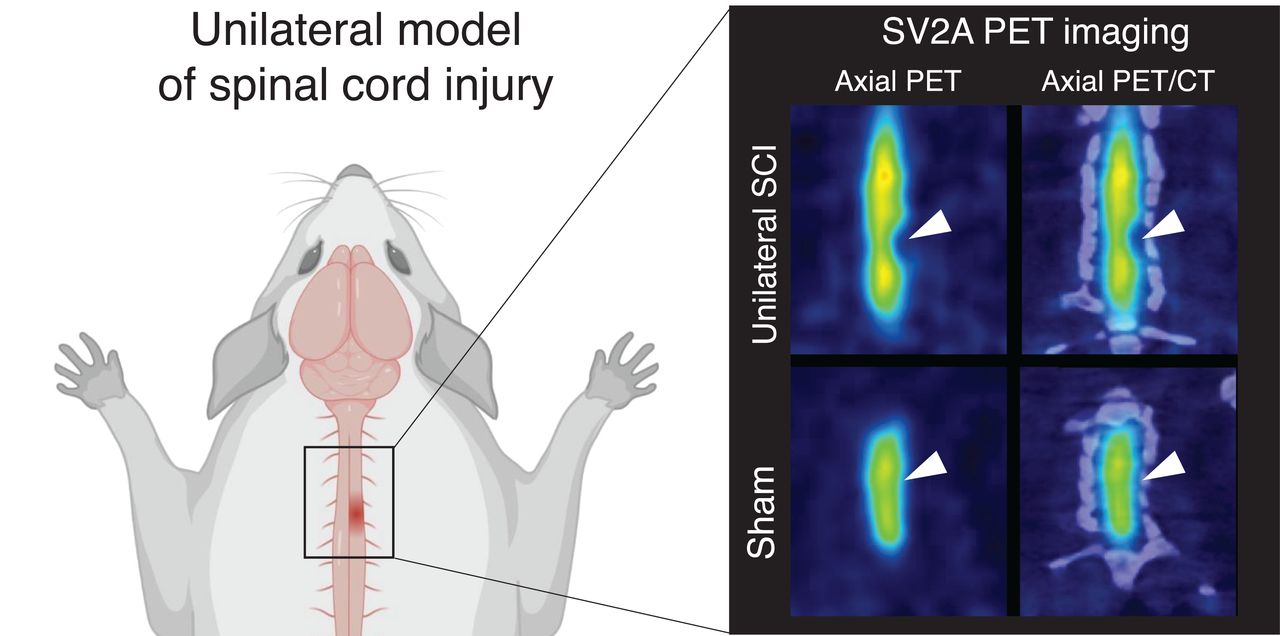
Traumatic spinal cord injury (SCI) is a neurologic condition characterized by long-term motor and sensory neurologic deficits as a consequence of an external physical impact damaging the spinal cord. Anatomic MRI is considered the gold-standard diagnostic tool to obtain structural information for the prognosis of acute SCI; however, it lacks functional objective information to assess SCI progression and recovery. In this study, we explored the use of synaptic vesicle glycoprotein 2A (SV2A) PET imaging to detect spinal cord lesions noninvasively after SCI. Methods: Mice (n = 7) and rats (n = 8) subjected to unilateral moderate cervical (C5) contusion were euthanized 1 wk after SCI for histologic and autoradiographic (3H-labeled (4R)-1-[(3-methylpyridin-4-yl)methyl]-4-(3,4,5-trifluorophenyl)pyrrolidin-2-one [UCB-J]) investigation of SV2A levels. Longitudinal 11C-UCB-J PET/CT imaging was performed in sham (n = 7) and SCI rats (n = 8) 1 wk and 6 wk after SCI. Animals also underwent an 18F-FDG PET scan during the latter time point. Postmortem tissue SV2A analysis to corroborate in vivo PET findings was performed 6 wk after SCI. Results: A significant SV2A loss (ranging from −70.3% to −87.3%; P < 0.0001) was measured at the epicenter of the impact in vitro in both mouse and rat contusion SCI models. Longitudinal 11C-UCB-J PET imaging detected SV2A loss in SCI rats (−49.0% ± 8.1% at 1 wk and −52.0% ± 12.9% at 6 wk after SCI), with no change observed in sham rats. In contrast, 18F-FDG PET imaging measured only subtle hypometabolism (−17.6% ± 14.7%). Finally, postmortem 3H-UCB-J autoradiography correlated with the in vivo SV2A PET findings (r = 0.92, P < 0.0001). Conclusion: 11C-UCB-J PET/CT imaging is a noninvasive marker for SV2A loss after SCI. Collectively, these findings indicate that SV2A PET may provide an objective measure of SCI and thus represent a valuable tool to evaluate novel therapeutics. Clinical assessment of SCI with SV2A PET imaging is highly recommended.
Spinal cord injury (SCI) is a devastating condition characterized by long-term motor and sensory neurologic deficits as well as a strong impact on the cognitive and social life of patients (1). Traumatic SCI is the consequence of an external physical impact damaging the spinal cord, with the neurologic outcomes being related to the extent of the primary lesion (1,2).
Currently, MRI is considered the gold-standard diagnostic tool to obtain structural information on spinal cord lesions and neighboring tissues during the acute phase of SCI (3–5). Although offering a clear view of the cord edema, hemorrhage, or syrinx formation, routine 1.5-T MRI has been shown to inconsistently correlate with the neurologic findings (6–8). Since MRI-based prognostication, treatment, and rehabilitation planning for spinally injured patients remain a daily clinical challenge (9), there has been increasing interest in developing objective imaging modalities to assess SCI progression and recovery for the noninvasive assessment of emerging therapeutic approaches (4–6).
PET imaging of glucose metabolism using 18F-FDG may represent an imaging modality to monitor metabolic activation and functional neuronal viability at the trauma epicenter. 18F-FDG PET imaging has been performed on both animal models and SCI patients, demonstrating abnormal metabolic activity in animals during the acute phase of experimental SCI or in patients during the active phases of compressive myelopathies (10–15). Although useful, the significance of the 18F-FDG signal remains flawed by its unspecific nature, mixing neuronal metabolism and glial activation (16), and by the lack of correlation with neurologic functions (17).
Recently, novel radioligands based on the antiepileptic drug levetiracetam and targeting the synaptic vesicle glycoprotein 2A (SV2A), a presynaptic protein regulating neurotransmitter release (18), have been developed (19). These ligands, including the selective and high-affinity radioligand 11C-labeled (4R)-1-[(3-methylpyridin-4-yl)methyl]-4-(3,4,5-trifluorophenyl)pyrrolidin-2-one (UCB-J), have emerged as powerful tools to quantify synaptic density in vivo noninvasively (20,21). SV2A PET imaging has already proven a useful tool for assessing synaptic density in various neurodegenerative and neuropsychiatric disorders at clinical and preclinical stages (22–24).
Although SV2A PET imaging has been applied mainly to the brain, SV2A is also present in the gray matter of the spinal cord (25). Furthermore, we recently showed that 11C-UCB-J PET imaging can quantify SV2A density noninvasively in the rodent spinal cord (23). We therefore postulated that SV2A PET imaging could serve as a biomarker of synaptic loss after SCI. In this study, we explored SV2A levels in experimental models of cervical contusion (26,27), investigated the potential of noninvasive 11C-UCB-J PET imaging to detect spinal damage in rats after SCI, and compared 11C-UCB-J and 18F-FDG PET imaging to verify whether SV2A PET could provide enhanced specificity and sensitivity in detecting spinal injury.
MATERIALS AND METHODS
Animals and Experimental Design
All experiments complied with the European Communities Council Directive (2010/63/EU) and were authorized by the local animal ethic committees (University of Namur [UN19-339] and University of Antwerp [ECD2019-49]). Experiment outcomes were determined at 1 wk after SCI (subacute phase) and 6 wk after SCI (chronic phase), as outlined in Supplemental Figure 1 (supplemental materials are available at http://jnm.snmjournals.org). First, we investigated in vitro both mouse and rat models to assess whether SV2A levels were affected differentially between species. For the longitudinal in vivo study, the rat model was preferred given its favorable body and spinal cord size compared with mice. Nonetheless, investigation in mice is relevant given the abundance of genetic mouse models with relevant spinal cord diseases (23,28).
Adult male C57BL/6J mice (n = 7; body weight, 20–25 g) (internally bred at the University of Namur) and female Sprague–Dawley rats (n = 8; body weight, 225–275 g) (Charles River Laboratories) underwent SCI and were euthanized 1 wk after SCI for histologic and autoradiographic assessment of SV2A. An additional 15 female Sprague–Dawley rats (225–275 g) were subjected either to SCI (n = 8) or laminectomy only (sham, n = 7) and were included in the longitudinal PET study and euthanized at 6 wk after SCI. The animals were group-housed under a 12-h light/dark cycle in a temperature- and humidity-controlled environment with food and water ad libitum.
Contusion SCI
The animals underwent a cervical C5 unilateral right-sided contusion as previously described for mice (26) and rats (27). The animals were anesthetized using a mix of ketamine, 100 mg/kg (ketamine 1000; Ceva), and xylazine, 5 mg/kg (XYL-M 2%; VMD). Briefly, dorsal skin and underlying muscles were cut to access the spine between the spinous processes C2 and T1. The paravertebral muscles overlying C3–C5 were carefully removed. The animals were then subjected to laminectomy at the C5 vertebra before receiving a computer-controlled impact of 51.3 ± 1.7 kdyne for mice and 407 ± 6.1 kdyne for rats (dwell time of 0 s) using an IH Spinal Cord Impactor (Precision Systems and Instrumentation, LLC). The full procedure included unilateral laminectomy on the right side, clamping of the spinous processes of C2 and T2 using toothed Adson forceps to stabilize the whole spinal column, raising of the impactor tip (1.0-mm-diameter impactor for mice and 1.5 mm for rats) 2.5 mm above the dura, and contusion of the right hemicord (bathed in 0.9% sterile saline for rats). Muscles were sutured in layers using silk 2.0 (mice) or 4.0 (rats), and the skin was closed using surgical clippers. The animals received buprenorphine subcutaneously (Vetergesic; Ceva) at a dose of 0.05 mg/kg for analgesia after surgery and again 12 and 24 h after surgery. Saline was subcutaneously administered for rehydration immediately after surgery and 24 h later. One SCI rat did not recover from the surgical procedure and was euthanized. Sham animals underwent the full laminectomy procedure without contusion.
Radiosynthesis
11C-UCB-J synthesis was performed on an automated synthesis module (Carbosynthon I; Comecer) as previously described (20,23), with an average molar activity of 52.9 ± 12.4 GBq/μmol. Radiochemical purity was greater than 99% for both 11C-UCB-J and 18F-FDG. 3H-UCB-J (Novandi Chemistry AB) was synthetized with a molar radioactivity of 2,997 MBq/μmol and radiochemical purity of more than 99%.
Small-Animal PET Imaging
Small-animal PET/CT was performed on 2 Siemens Inveon PET/CT scanners (Siemens Preclinical Solutions). The animals were prepared as previously described (29). For the 18F-FDG PET scan, the animals were kept fasting starting the evening before the scan, for an average of 17.7 ± 1.6 h. Glucose strips (OneTouch Ultra 2; LifeScan) were used to measure the glucose concentration (81.2 ± 15.1 mg/dL) in duplicate from blood samples obtained via the tail vein of the rats before radioligand injection. The rats were anesthetized using isoflurane (Forane; Ohio Medical Products) in medical oxygen (induction, 5%; maintenance, 2%–2.5%). The respiration rate and body temperature were monitored and kept constant during the scan. 11C-UCB-J PET images were acquired dynamically (50-min scan), whereas static (20-min) 18F-FDG PET scans were obtained for glucose metabolism after 30 min of radioligand uptake in animals that were awake (29,30). Into a catheterized tail vein over a 30-s interval (1 mL/min) using an automated pump (Pump 11 Elite; Harvard Apparatus), a bolus of 11C-UCB-J (6.7 ± 4.0 MBq) or 18F-FDG (25.1 ± 2.0 MBq) was injected. Data were acquired in list-mode format. After the small-animal PET scan, a 10-min 80 kV/500 μA CT scan was performed for coregistration and attenuation correction.
Image Processing and Analysis
11C-UCB-J data were reconstructed into 31 frames of increasing length (12 × 10 s, 3 × 20 s, 3 × 30 s, 3 × 60 s, 3 × 150 s, and 7 × 300 s), whereas a static reconstruction was applied to 18F-FDG data using 8 iterations and 16 subsets of the 3-dimensional ordered-subset expectation maximization algorithm with spatially variant modeling (31) and normalization, dead-time, and CT-based attenuation corrections. Images were reconstructed on a 128 × 128 × 159 grid with 0.776 × 0.776 × 0.796 mm3 voxels. PET/CT images were processed and analyzed using PMOD software (version 3.6; PMOD Technologies).
To align all brains to a common space and use the same volume of interest to extract the whole-brain activity, brain PET images were rigid-matched to the Schiffer rat 18F-FDG template (32) or the 11C-UCB-J PET template (generated in the same space as the Schiffer one). Cervical spinal cord volumes of interest were manually delineated using the individual coregistered PET/CT images from C3 to C7, with C5 subdivided into right and left segments. Since we anticipated a potential partial-volume effect on the contralateral C5 segment, comparisons were made against the C3 section. The volumes of interest were kept at the same volume across subjects (0.016 cm3 at each C3–C7 level and 0.008 cm3 for left and right C5). Across animals, volumes of interest were manually reoriented to follow the profile of the spine. Supplemental Figure 2 shows the CT image of the spine in a representative sham rat with laminectomy.
For 11C-UCB-J analysis, the interval from 25 to 45 min after injection was selected to determine radioligand uptake measured using SUV, calculated as brain activity multiplied by body weight and divided by the injected dose. No difference in cerebral uptake was observed for either 11C-UCB-J (SUV) (Supplemental Fig. 3) or 18F-FDG (SUV corrected for glucose levels) (Supplemental Fig. 4); therefore, spinal uptake was measured as the ratio of regional spinal uptake over whole-brain uptake.
Histologic Analysis
At 1 or 6 wk after injury, the animals were deeply anesthetized with sodium pentobarbital (50 mg/kg, intraperitoneally) and transcardially perfused with ice-cold phosphate-buffered saline (pH 7.4). The spinal cords were dissected, and a cervical segment containing the contusion injury was snap-frozen in 2-metylbuthane at −35°C for 2 min and preserved at −80°C until use. Coronal sections (30 μm thick) were collected on Superfrost Plus slides (Thermo Fischer Scientific) using a cryostat (Leica) and were distributed into a series of 12 slices so that each slide covered rostral, trauma, and caudal sections.
SV2A immunostaining was performed as previously described (23), using the primary antibody anti-SV2A (rabbit IgG; 1:400; catalog number 66724 [Cell Signaling Technologies]) followed by the secondary fluorescent antibody (donkey antirabbit; 1:100; Alexa Fluor 488 [Jackson ImmunoResearch]). Images were acquired at ×10 magnification for quantification with a fluorescence microscope (Olympus) using CellSens software. Images were analyzed using Fiji (version 2.1.0) ImageJ software (National Institutes of Health). SV2A signal intensity was measured in regions of interest (right and left gray matter spinal cord) manually delineated on each section. Adjacent slides were stained with hematoxylin and eosin to visualize tissue morphology.
Autoradiography
In vitro 3H-UCB-J (Novandi Chemistry AB) autoradiography was performed as previously reported (23). Mouse and rat SV2A selectivity in the spinal cord was validated using a blocking solution (1 nM of 3H-UCB-J plus 1 mM of levetiracetam in binding buffer) (Supplemental Fig. 5).
Regional quantification was performed using Fiji (version 2.1.0) ImageJ software. Specific binding of 3H-UCB-J was measured by converting the mean gray values into radioactivity density (Bq/mg), calculated using commercial tritium standards (American Radiolabeled Chemicals). Next, from 3H-UCB-J molar activity on the experimental day, radioactivity density was converted into binding density (pmol/mg) for each region.
Statistical Analysis
In vivo spinal cord PET data, as well as postmortem analyses, were investigated using 2-way ANOVA (experimental group and region as variables). A decrease in spinal PET signal compared with C3 and cerebral binding was assessed using the Mann–Whitney test. Autoradiographic blocking experiments were analyzed using paired t tests. Correlations between in vivo and postmortem SV2A signals were evaluated using a Spearman r test. P values were corrected for multiple comparisons using the Šídák multiple-comparisons test. Statistical analyses were performed with GraphPad Prism (version 9.1) statistical software. Data are represented as mean ± SD. All tests were 2-tailed, and statistical significance was set at a P value of less than 0.05.
RESULTS
SV2A Levels Are Decreased Subacutely in Experimental Models of Contusion SCI
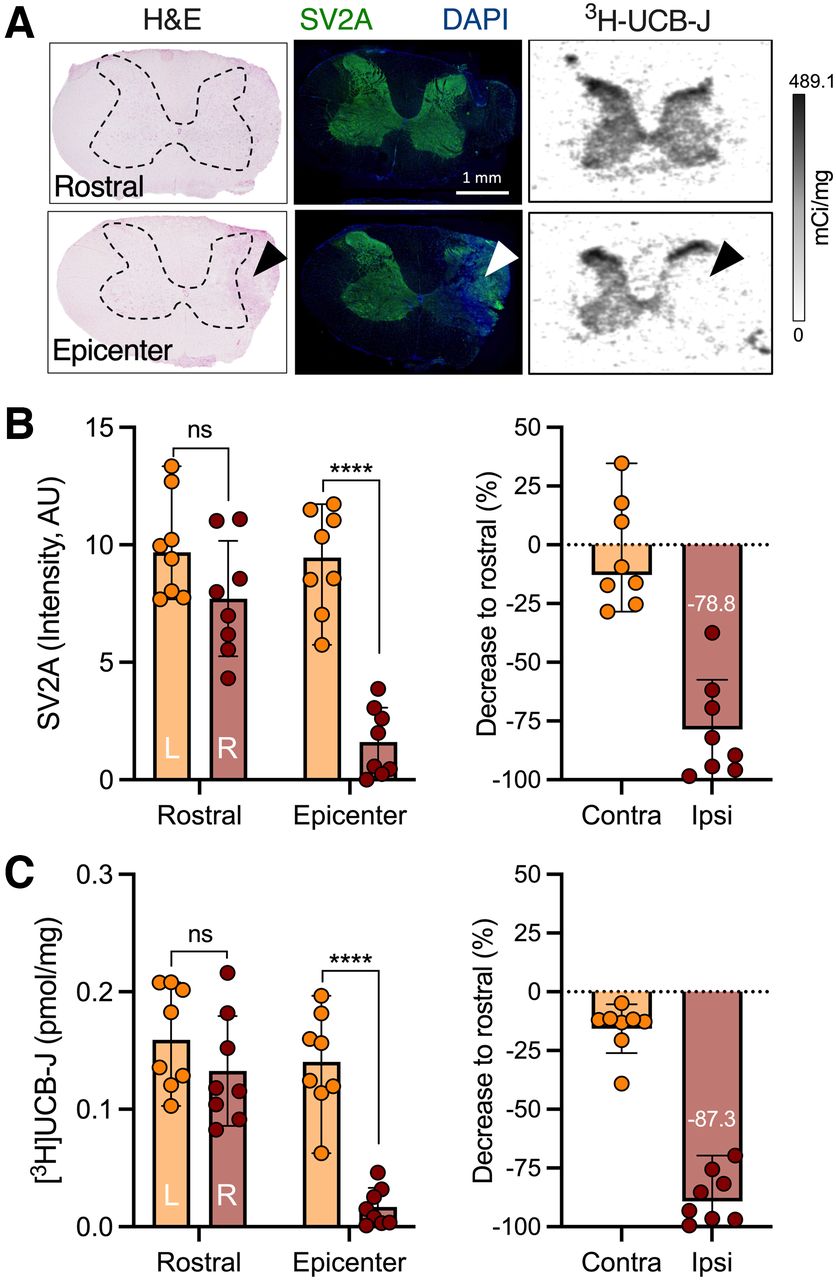
To determine whether SV2A levels are changed after a spinal injury, we performed SV2A histologic and autoradiographic assessment on 2 experimental models of contusion SCI during the subacute phase (Fig. 1A; Supplemental Fig. 6A). In both mouse and rat spinal cord, a significant SV2A loss at the epicenter of impact, but not in rostral sections (C3–C4 level), was observed with SV2A immunostaining (contralateral effect: mouse, F1,24 = 140.4 [P < 0.0001]; rat, F1,28 = 20.2 [P < 0.0001]), which corresponded to an approximately 80% decline compared with rostral sections (mouse, −81.2% ± 8.6% [post hoc P < 0.0001]; rat, −78.8% ± 21.1% [post hoc P < 0.0001]) (Fig. 1B; Supplemental Fig. 6B). Analogously, 3H-UCB-J binding was significantly affected at the epicenter of the contusion compared with the contralateral side (contralateral effect: mouse, F1,24 = 42.3 [P < 0.0001]; rat, F1,28 = 24.4 [P < 0.0001]), with a clear decline in relation to rostral sections (mouse, −70.3% ± 11.5% [post hoc P < 0.0001]; rat, −87.3% ± 10.9% [post hoc P < 0.0001]) (Fig. 1C; Supplemental Fig. 6C). Notably, the SV2A loss was not due to loss of spinal tissue, as depicted by the hematoxylin and eosin staining.

SV2A levels are decreased in rat model of contusion SCI. (A) Representative hematoxylin and eosin, SV2A, and 3H-UCB-J images depicting rostral and epicenter spinal cord sections. Arrowheads indicate contusion site at right C5 vertebra; dashed lines outline spinal gray matter. (B and C) SV2A (B) and 3H-UCB-J (C) quantification in spinal cord sections and decrease in C5 section compared with rostral for both contralateral (left) and ipsilateral (right) sides. AU = arbitrary units; H&E = hematoxylin and eosin; ns = not statistically significant. ****P < 0.0001.
11C-UCB-J PET Detects In Vivo SV2A Loss After SCI
Given the wider diameter of the spinal cord in the rat, the rat model was chosen to investigate 11C-UCB-J PET imaging after SCI. Figure 2 displays representative 11C-UCB-J uptake images in a SCI rat compared with a sham control rat 1 wk after injury. Spinal cord 11C-UCB-J uptake at the contusion site (right C5) was significantly changed compared with sham animals (group effect, F1,54 = 100.2 [P < 0.0001]) (Fig. 3A). 11C-UCB-J uptake was also significantly reduced in surrounding areas (C4, left C5, and C6). Accordingly, SCI animals displayed a 11C-UCB-J binding decline in right C5 compared with C3 (−49.0% ± 8.1%), which significantly differed from sham rats (P = 0.0043) (Fig. 3B).

Representative 11C-UCB-J PET images are shown of sham and SCI rat 1 wk after trauma. Arrowheads indicate contusion site at C5 vertebra. Interval is 25–45 min after injection. Scale bar = 5 mm.
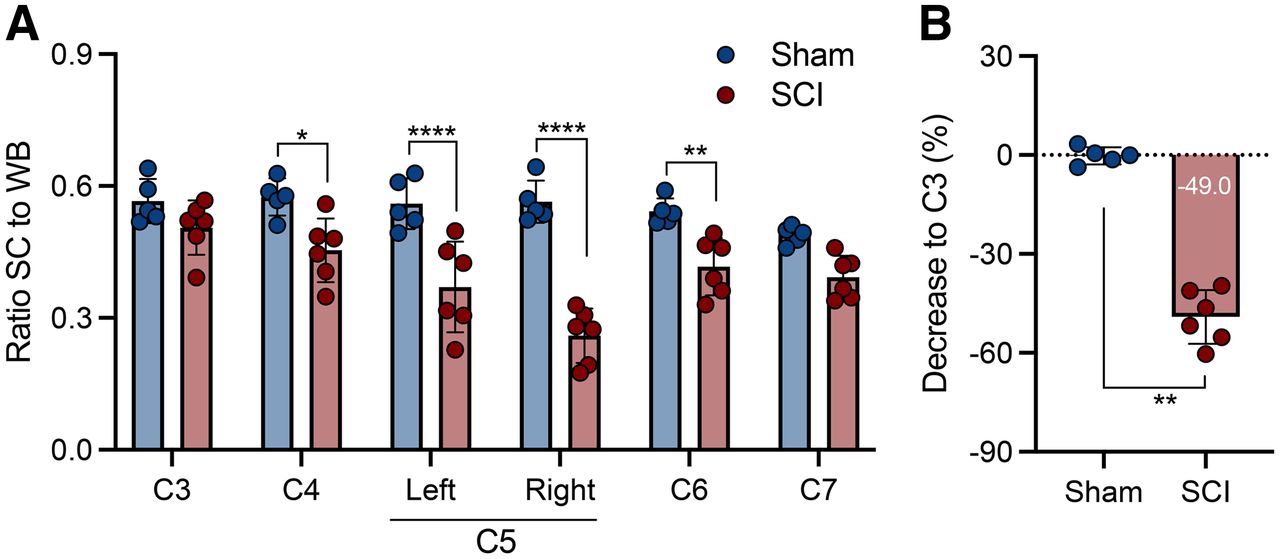
11C-UCB-J PET detects SV2A loss in contusion SCI rat model. (A) Significant reduction in spinal cord 11C-UCB-J uptake around contusion site (right C5), compared with sham animals. (B) Spinal cord 11C-UCB-J uptake at epicenter (right C5) compared with C3 level within each animal. SC = spinal cord; WB = whole brain. *P < 0.05. **P < 0.01. ****P < 0.0001.
11C-UCB-J PET Outperforms 18F-FDG PET for Detection of Chronic SCI
Similarly to 1 wk after injury, the reduction in 11C-UCB-J uptake around the contusion site (right C5) in SCI rats was significant and sustained at 6 wk after injury compared with sham animals (group effect, F1,60 = 190.4 [P < 0.0001]) (Fig. 4A). Hence, SCI animals displayed a 11C-UCB-J binding decline in right C5 compared with C3 (−52.0% ± 12.9%), which significantly differed from sham rats (P = 0.0025) (Fig. 4B). Interestingly, 11C-UCB-J uptake at the site of chronic trauma in SCI rats was significantly affected until C7 (P < 0.01), unlike at 1 wk after SCI (P > 0.05), suggesting that the local contusion might induce SV2A loss caudal to the lesion epicenter.
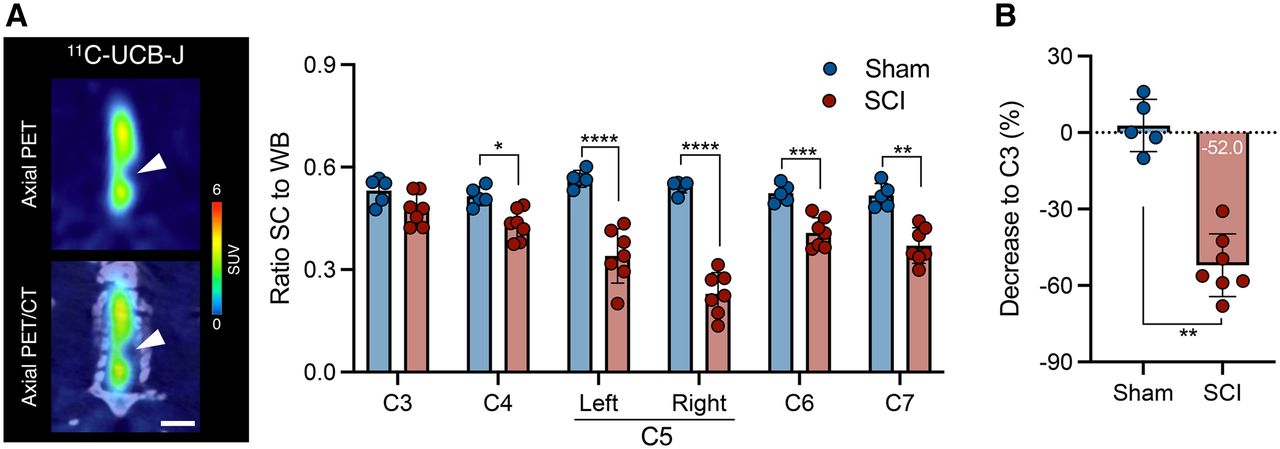
11C-UCB-J reduction is sustained during chronic SCI in contusion rat model. (A) Representative PET image of SCI rat and 11C-UCB-J PET analysis of sham animals and rats with chronic SCI. Interval is 25–45 min after injection. Scale bar = 5 mm. (B) Spinal cord 11C-UCB-J uptake at epicenter compared with C3 level within each animal. SC = spinal cord; WB = whole brain. *P < 0.05. **P < 0.01. ***P < 0.001. ****P < 0.0001.
Six weeks after SCI, the animals underwent 11C-UCB-J and 18F-FDG PET to assess whether SV2A PET could provide enhanced sensitivity in detecting spinal injury. 18F-FDG PET could detect hypometabolism at the contusion epicenter (right C5) compared with sham animals (group effect, F1,60 = 70.9 [P < 0.0001]) (Fig. 5A), as well as hypometabolism in surrounding tissue (left C5 and C6). However, the difference compared with C3 was subtle (−17.6% ± 14.7%), with no significant change from sham rats (P = 0.106) (Fig. 5B).
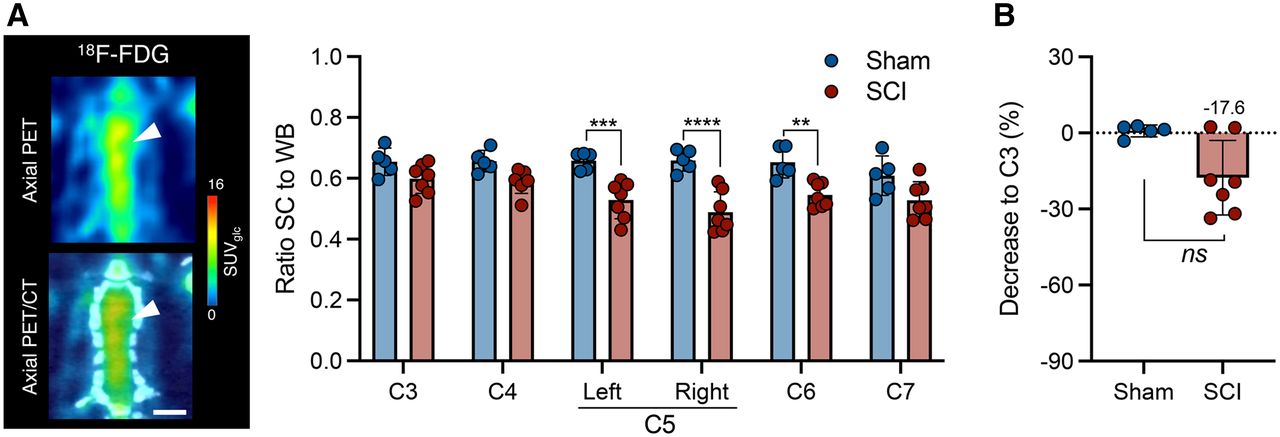
18F-FDG reduction is limited during chronic SCI in contusion rat model. (A) Representative PET image of SCI rat and 18F-FDG PET analysis of sham animals and rats with chronic SCI. Scale bar = 5 mm. (B) Spinal cord 18F-FDG uptake at epicenter compared with C3 level within each animal. SC = spinal cord; WB = whole brain. **P < 0.01. ***P < 0.001. ****P < 0.0001.
Postmortem Analysis Corroborates 11C-UCB-J PET Findings
Similar to the analyses at the subacute phase, a significant SV2A loss at the epicenter, but not in rostral (C3 and C4) sections, was observed at the chronic phase with SV2A immunostaining (group effect, F1,22 = 62.0 [P < 0.0001]), corresponding to an 86% ± 17.4% decline compared with rostral sections (Fig. 6A), showing strong consistency with the in vivo 11C-UCB-J PET measurements (r = 0.86, P = 0.0013; Fig. 6B).
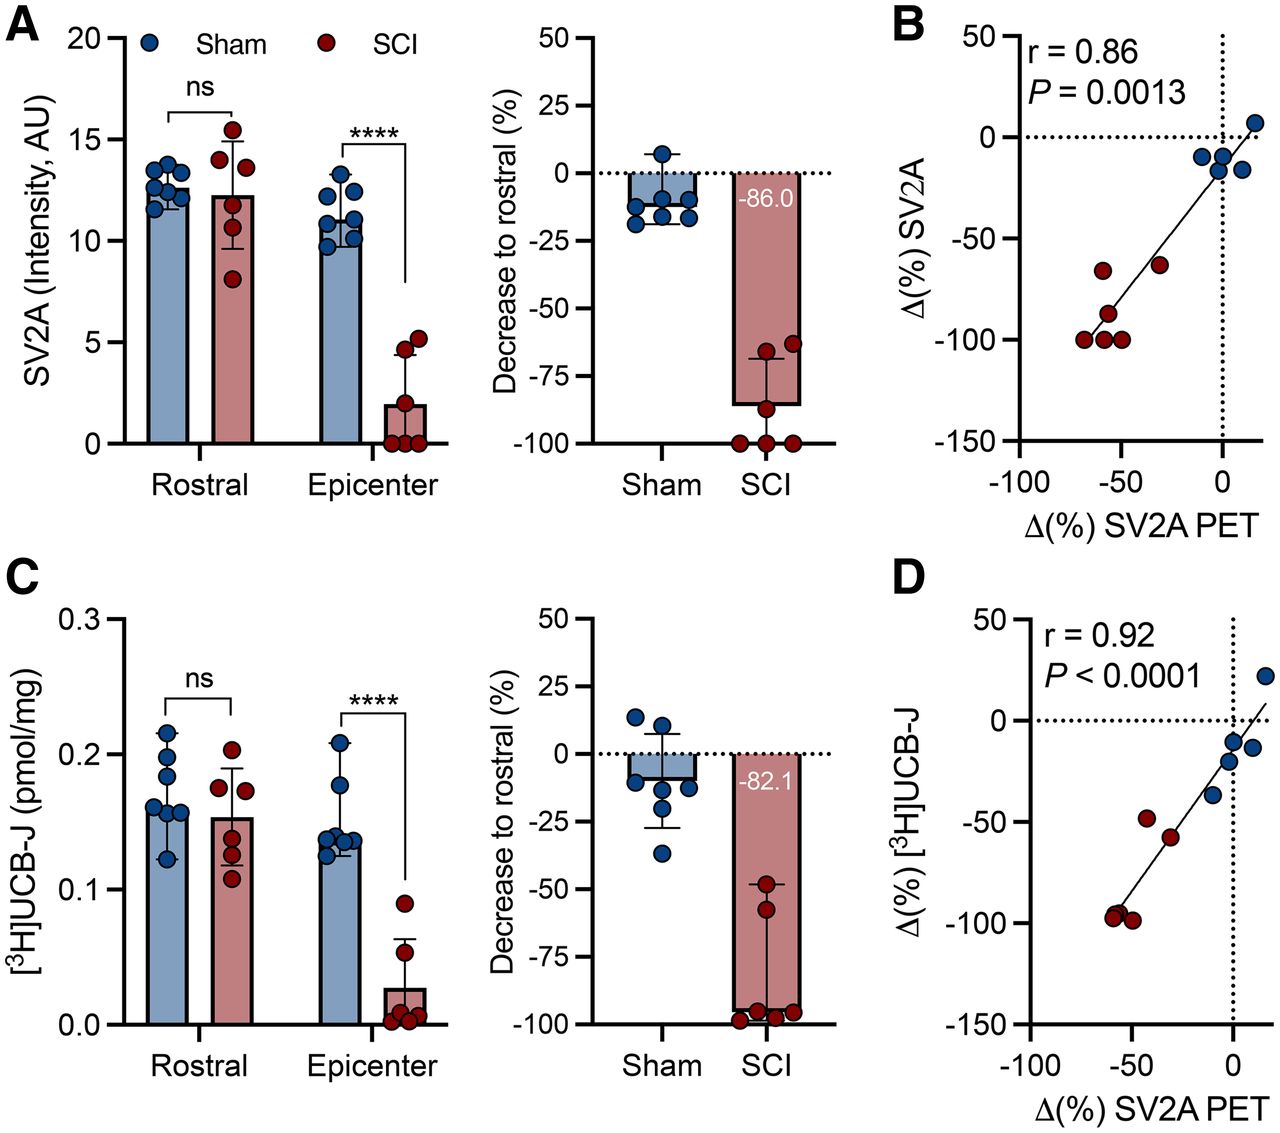
Postmortem analyses corroborated sustained SV2A loss measured with 11C-UCB-J PET during chronic SCI. (A) SV2A immunofluorescence quantification. (B) Correlation between rostral and epicenter decrease measured with 11C-UCB-J PET. (C) 3H-UCB-J autoradiography quantification. (D) Correlation between rostral and epicenter decrease measured with 11C-UCB-J PET. ns = not statistically significant. ****P < 0.0001.
3H-UCB-J binding was significantly affected as well (group effect, F1,22 = 31.2 [P < 0.0001]), with a 82.1% ± 22.8% decline compared with rostral sections (Fig. 6C). 3H-UCB-J autoradiography reflected the in vivo 11C-UCB-J PET quantification (r = 0.92, P < 0.0001; Fig. 6D).
DISCUSSION
This study showed that SV2A is decreased in mouse and rat experimental models of SCI contusion and that synaptic loss after SCI can be measured noninvasively. Also, the SV2A decrease is sustained over time, and 11C-UCB-J PET imaging provides a 3-fold enhanced sensitivity compared with 18F-FDG PET imaging in assessing spinal damage. Collectively, these findings suggest that SV2A PET imaging could serve as a robust biomarker capable of detecting subtle synaptic loss after SCI.
Validation by histologic and autoradiographic findings confirmed that SV2A is restricted to gray matter (25) and that 3H-UCB-J binding was blocked by levetiracetam (19). Both experimental models of SCI displayed a comparable unilateral SV2A loss; most importantly, the SV2A decline was not due to a mere tissue loss caused by the initial trauma.
For in vivo PET quantification, we focused on the comparison to the rostral C3 level (which is morphologically unaffected) to avoid the partial-volume effect that is likely present in the uninjured C5 hemicord. We measured a sustained reduction in 11C-UCB-J binding at the SCI epicenter over time, suggesting little-to-no regeneration of synaptic connections and sprouting of spared axons. Notably, a decrease in SV2A was observed in SCI rats over time at the caudal level (C6 and C7). This decrease is a possible result of the deafferentation of the gray matter and consequent caudal synaptic loss, overall reflecting an extension of the secondary lesion, which comprises many processes: apoptosis, demyelination of surviving axons, axonal die-back, and building of a glial scar around the injury site (1,33,34).
Previous studies have reported only transient changes in 18F-FDG uptake in rat and canine models (13,14). Thus, one objective of the current study was to compare the performance of 11C-UCB-J with 18F-FDG in detecting spinal cord damage. Despite the extensive neurodegeneration at the trauma site (1), the observed reduction in glucose uptake was only a fraction (−17.6%) compared with the SV2A loss (−52.0%). This is likely related to the enhanced gliosis driven by microglia/macrophage and astrocyte activation related to primary and secondary injuries. Since glucose uptake is the result of neuronal and glial metabolism (16), the gliosis occurring at the trauma site can largely mask the reduced uptake associated with neurodegeneration. As such, understanding the biologic process driving the 18F-FDG uptake is challenging, especially for the assessment of therapeutics, because of the plethora of processes occurring at the injury site (1,34). In contrast, the precise nature of SV2A as the molecular target of 11C-UCB-J offers a specific measure of synaptic density without being affected by secondary processes. Thus, SV2A PET imaging might provide a powerful tool for the assessment of synaptic loss in traumatic, neurodegenerative, inflammatory, and vascular spinal cord pathologies, as well as for synaptic loss, regeneration (24), and axonal connectivity after gene and cell therapy approaches (35). Future studies investigating the association between spinal SV2A density and degree of motor impairment will be needed to understand whether SV2A loss might represent a biomarker with functional relevance.
Despite being the gold-standard diagnostic tool to obtain structural information on spinal cord lesions during the acute phase of SCI (4), functional assessment based on MRI remains elusive, resulting in inconsistent correlations with the neurologic findings (6–8). Although novel approaches such as diffusion tensor imaging and myelin water transfer can provide added value in terms of axon and myelin integrity (4), their readouts are likely to be affected by evolving edema, hemorrhage, or syrinx formation. SV2A PET imaging can offer an attractive complementary alternative to objectively measure synaptic integrity at the lesion site in preclinical and clinical settings. Although we describe here for the first time (to our knowledge) spinal SV2A changes, SV2A PET imaging has already been performed in several clinical studies of neurologic disorders (22). With a more favorable resolution ratio (spinal cord/scanner resolution) available for human PET imaging, we foresee no limitation for clinical application, as supported by a preliminary report on healthy subjects (36). The high sensitivity of SV2A as compared with 18F-FDG PET and the added value of 18F-FDG PET as compared with MRI (15) suggest that SV2A PET may be of particular interest in the diagnosis and prognosis of cervical spondylotic myelopathy, which is common in the elderly (37).
CONCLUSION
Using 11C-UCB-J PET/CT imaging, we successfully detected SV2A loss in the contusion SCI rat model. The presented findings indicate that synaptic loss after SCI can be quantified noninvasively, SV2A decrease is sustained over time, and 11C-UCB-J PET imaging provides enhanced sensitivity compared with 18F-FDG PET imaging for assessment of spinal damage. Collectively, these findings indicate that SV2A PET may provide an objective measure of SCI and thus be a valuable tool to evaluate novel therapeutics. Clinical assessment of SCI with SV2A PET imaging is highly recommended.
DISCLOSURE
Daniele Bertoglio is supported by the Research Foundation Flanders (FWO, 1229721N). Antwerp University also funded the work through a partial assistant professor position for Jeroen Verhaeghe and a full professor position for Steven Staelens. Daniele Bertoglio, Jeroen Verhaeghe, and Steven Staelens are members of the μNeuro Research Centre of Excellence at the University of Antwerp. No other potential conflict of interest relevant to this article was reported.
KEY POINTS
QUESTION: Does SV2A represent a biomarker for SCI?
PERTINENT FINDINGS: SV2A levels are significantly reduced in animal models of contusion SCI. Longitudinal 11C-UCB-J PET imaging showed that SV2A loss can be quantified noninvasively, is sustained over time, and outperforms 18F-FDG PET imaging.
IMPLICATIONS FOR PATIENT CARE: SV2A PET imaging offers a novel noninvasive method to quantify SCI, which may provide a promising diagnostic tool for the assessment of functional recovery after SCI therapeutics.
ACKNOWLEDGMENTS
We thank Philippe Joye, Romy Raeymakers, and Annemie Van Eetveldt of MICA for their valuable technical assistance. Part of the graphical abstract and Supplemental Figure 1 were generated using BioRender.
Footnotes
Published online Jan. 13, 2022.
- © 2022 by the Society of Nuclear Medicine and Molecular Imaging.
Immediate Open Access: Creative Commons Attribution 4.0 International License (CC BY) allows users to share and adapt with attribution, excluding materials credited to previous publications. License: https://creativecommons.org/licenses/by/4.0/. Details: http://jnm.snmjournals.org/site/misc/permission.xhtml.
REFERENCES
- Received for publication September 14, 2021.
- Accepted for publication November 30, 2021.
In this issue


Jump to section
Related Articles
Cited By...
- Imaging Demyelinated Axons After Spinal Cord Injuries with PET Tracer [18F]3F4AP
- Preclinical validation and kinetic modelling of the SV2A PET ligand [18F]UCB-J in mice
- Repetitive mild closed-head injury induced synapse loss and increased local BOLD-fMRI signal homogeneity
- Imaging demyelinated axons after spinal cord injuries with PET tracer [18F]3F4AP
- Resting-State Functional MRI and PET Imaging as Noninvasive Tools to Study (Ab)Normal Neurodevelopment in Humans and Rodents