
Main menu

  • Home
  • Content
    • Current
    • Ahead of print
    • Past Issues
    • JNM Supplement
    • SNMMI Annual Meeting Abstracts
    • Continuing Education
    • JNM Podcasts
  • Subscriptions
    • Subscribers
    • Institutional and Non-member
    • Rates
    • Journal Claims
    • Corporate & Special Sales
  • Authors
    • Submit to JNM
    • Information for Authors
    • Assignment of Copyright
    • AQARA requirements
  • Info
    • Reviewers
    • Permissions
    • Advertisers
  • About
    • About Us
    • Editorial Board
    • Contact Information
  • More
    • Alerts
    • Feedback
    • Help
    • SNMMI Journals
  • SNMMI
    • JNM
    • JNMT
    • SNMMI Journals
    • SNMMI

User menu

  • Subscribe
  • My alerts
  • Log in
  • Log out
  • My Cart

Search

  • Advanced search
Journal of Nuclear Medicine
  • SNMMI
    • JNM
    • JNMT
    • SNMMI Journals
    • SNMMI
  • Subscribe
  • My alerts
  • Log in
  • Log out
  • My Cart
Journal of Nuclear Medicine

Advanced Search

  • Home
  • Content
    • Current
    • Ahead of print
    • Past Issues
    • JNM Supplement
    • SNMMI Annual Meeting Abstracts
    • Continuing Education
    • JNM Podcasts
  • Subscriptions
    • Subscribers
    • Institutional and Non-member
    • Rates
    • Journal Claims
    • Corporate & Special Sales
  • Authors
    • Submit to JNM
    • Information for Authors
    • Assignment of Copyright
    • AQARA requirements
  • Info
    • Reviewers
    • Permissions
    • Advertisers
  • About
    • About Us
    • Editorial Board
    • Contact Information
  • More
    • Alerts
    • Feedback
    • Help
    • SNMMI Journals
  • View or Listen to JNM Podcast
  • Visit JNM on Facebook
  • Join JNM on LinkedIn
  • Follow JNM on Twitter
  • Subscribe to our RSS feeds
Research ArticleNeurology

TauIQ: A Canonical Image Based Algorithm to Quantify Tau PET Scans

Alex Whittington, Roger N. Gunn and for the Alzheimer’s Disease Neuroimaging Initiative
Journal of Nuclear Medicine September 2021, 62 (9) 1292-1300; DOI: https://doi.org/10.2967/jnumed.120.258962
Alex Whittington
1Invicro LLC, London, United Kingdom; and
  • Find this author on Google Scholar
  • Find this author on PubMed
  • Search for this author on this site
Roger N. Gunn
1Invicro LLC, London, United Kingdom; and
2Department of Brain Sciences, Imperial College London, Hammersmith Hospital Campus, London, United Kingdom
  • Find this author on Google Scholar
  • Find this author on PubMed
  • Search for this author on this site
  • Article
  • Figures & Data
  • Supplemental
  • Info & Metrics
  • PDF
Loading

Article Figures & Data

Figures

  • Tables
  • Additional Files
  • Figure
    • Download figure
    • Open in new tab
    • Download powerpoint
  • FIGURE 1.
    • Download figure
    • Open in new tab
    • Download powerpoint
    FIGURE 1.

    Methodology for creating 18F-flortaucipir canonical images. (A) Creation of chronological 18F-flortaucipir dataset using associated 18F-florbetapir data. (B) Generation of 18F-flortaucipir K and NS canonical images from voxelwise modeling of chronological dataset.

  • FIGURE 2.
    • Download figure
    • Open in new tab
    • Download powerpoint
    FIGURE 2.

    Canonical images for 18F-flortaucipir PET derived from spatiotemporal modeling of chronological AD data in MNI152 space: tau canonical image (K) (A), nonspecific canonical image (NS) (B), and reference structural T1-weighted MR image (C).
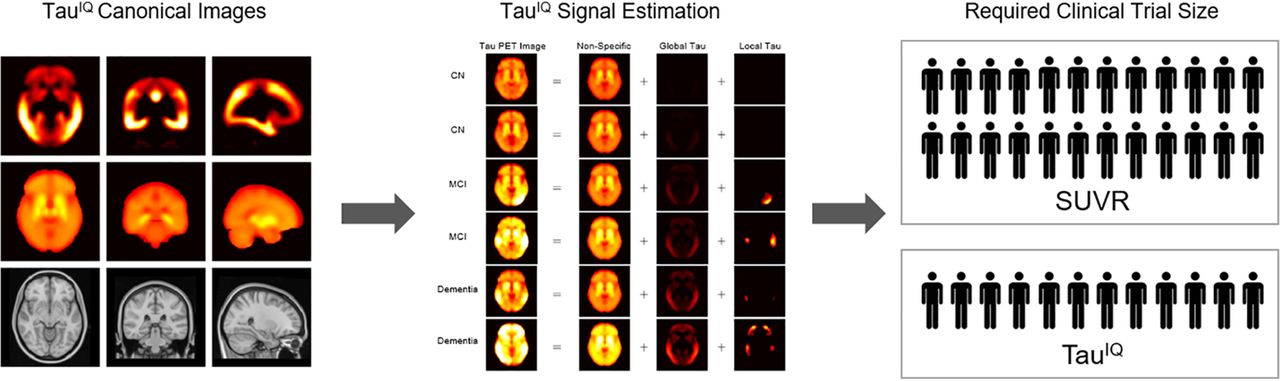
  • FIGURE 3.
    • Download figure
    • Open in new tab
    • Download powerpoint
    FIGURE 3.

    TauIQ algorithm that estimates global and local tau outcome measures.

  • FIGURE 4.
    • Download figure
    • Open in new tab
    • Download powerpoint
    FIGURE 4.

    Examples of TauIQ decomposition of 18F-flortaucipir data into nonspecific, global, and local tau signals.
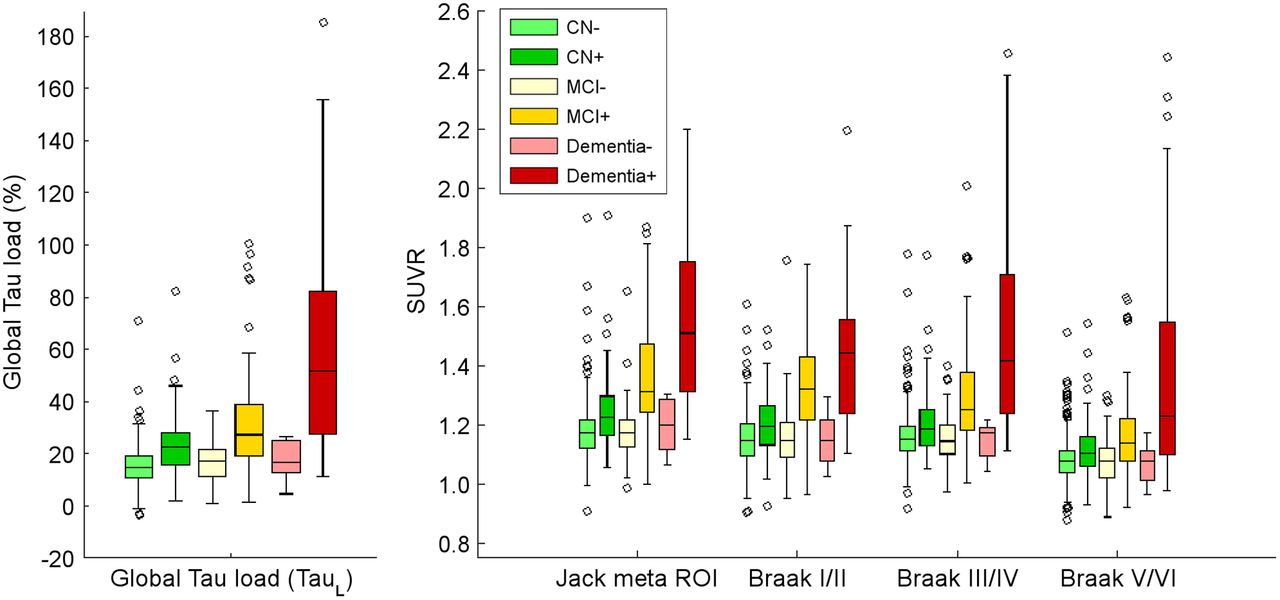
  • FIGURE 5.
    • Download figure
    • Open in new tab
    • Download powerpoint
    FIGURE 5.

    Cross-sectional analysis shown as box plots of distributions of 18F-flortaucipir TauL and SUVR outcome measures by clinical group.

  • FIGURE 6.
    • Download figure
    • Open in new tab
    • Download powerpoint
    FIGURE 6.

    Longitudinal analysis shown as box plots of distributions of change in 18F-flortaucipir TauL and SUVR outcome measures.

  • FIGURE 7.
    • Download figure
    • Open in new tab
    • Download powerpoint
    FIGURE 7.

    Correlations between clinical scores (CDR-SB, MMSE, and ADAS-Cog) and tau imaging outcome measures.

Tables

  • Figures
  • Additional Files
    • View popup
    TABLE 1

    Cross-Sectional Analysis*

    Outcome measureCN− vs. CN+CN− vs. MCI+CN− vs. dementia+
    TauIQ TauL1.00 (0.69–1.35), P < 0.101.53 (1.21–1.88)2.70 (2.28–3.26), P < 0.44
    SUVR Jack meta-ROI0.69 (0.39–1.03)1.58 (1.21–2.01)2.64 (2.16–3.27)
    SUVR Braak I/II0.55 (0.26–0.85)1.62 (1.24–2.04), P < 0.642.46 (1.98–3.03)
    SUVR Braak III/IV0.57 (0.28–0.88)1.34 (0.99–1.72)2.37 (1.93–2.92)
    SUVR Braak V/VI0.49 (0.19–0.80)0.97 (0.63–1.32)1.90 (1.48–2.40)
    • ↵* Effect sizes with CIs for 18F-flortaucipir TauL and SUVR outcome measures derived from group comparisons. Best-performing method in terms of effect size is highlighted in bold along with probability it is best method.

    • View popup
    TABLE 2

    Longitudinal Analysis*

    ParameterTauIQ TauLSUVR Jack meta-ROISUVR Braak I/IISUVR Braak III/IVSUVR Braak V/VI
    CN−
     Mean and SD1.20 (2.31)0.003 (0.037)0.001 (0.037)0.003 (0.036)−0.001 (0.037)
     Effect size and CI0.52 (0.28 to 0.79), P < 0.0160.09 (−0.18 to 0.37)0.02 (−0.25 to 0.30)0.08 (−0.19 to 0.37)−0.02 (−0.30 to 0.24)
     n94033,812557,74537,422847,562
    CN+
     Mean and SD2.01 (2.97)0.009 (0.044)0.007 (0.039)0.007 (0.041)0.007 (0.039)
     Effect size and CI0.68 (0.43 to 0.98), P < 0.0220.21 (−0.12 to 0.55)0.19 (−0.15 to 0.52)0.18 (−0.16 to 0.55)0.17 (−0.16 to 0.55)
     n5465,7266,6998,1709,019
    MCI−
     Mean and SD1.87 (2.28)0.008 (0.032)−0.002 (0.040)0.004 (0.031)0.010 (0.025)
     Effect size and CI0.82 (0.57 to 1.58), P < 0.130.24 (−0.22 to 0.82)−0.04 (−0.49 to 0.53)0.13 (−0.31 to 0.79)0.40 (−0.05 to 0.94)
     n3774,458190,97014,5121,610
    MCI+
     Mean and SD3.61 (3.31)0.023 (0.049)0.008 (0.052)0.023 (0.047)0.017 (0.044)
     Effect size and CI1.09 (0.79 to 1.54), P < 0.0200.47 (0.12 to 0.85)0.16 (−0.24 to 0.57)0.49 (0.13 to 0.93)0.39 (0.00 to 0.89)
     n2131,13010,2291,0631,655
    Dementia−
     Mean and SD1.53 (2.43)−0.001 (0.032)−0.007 (0.019)0.002 (0.024)0.002 (0.024)
     Effect size and CI0.63 (−0.13 to 2.14), P < 0.28−0.04 (−1.55 to 0.76)−0.34 (−1.32 to 0.76)0.09 (−1.18 to 1.01)0.06 (−1.52 to 1.01)
     n640147,8602,08029,59563,426
    Dementia+
     Mean and SD2.52 (6.64)0.004 (0.085)−0.011 (0.079)0.002 (0.080)−0.005 (0.078)
     Effect size and CI0.38 (−0.17 to 1.42), P < 0.270.05 (−0.44 to 0.83)−0.13 (−0.58 to 0.71)0.02 (−0.56 to 0.76)−0.06 (−0.64 to 0.71)
     n1,74199,38513,98532,260767,106
    • ↵* Change in 18F-flortaucipir TauL and SUVR outcome measures per year for each clinical group. Best-performing method in terms of effect size (mean/SD) is highlighted in bold along with probability that it is the best method. n is number of subjects, in both active and placebo arms of simulated clinical trial, required to show 25% reduction in tau accumulation in active arm over period of 1 y (power = 80%, α = 0.05).

Additional Files

  • Figures
  • Tables
  • Supplemental Data

    Files in this Data Supplement:

    • Supplemental Data
PreviousNext
Back to top

In this issue

Journal of Nuclear Medicine: 62 (9)
Journal of Nuclear Medicine
Vol. 62, Issue 9
September 1, 2021
  • Table of Contents
  • Table of Contents (PDF)
  • About the Cover
  • Index by author
  • Complete Issue (PDF)
Print
Download PDF
Article Alerts
Sign In to Email Alerts with your Email Address
Email Article

Thank you for your interest in spreading the word on Journal of Nuclear Medicine.

NOTE: We only request your email address so that the person you are recommending the page to knows that you wanted them to see it, and that it is not junk mail. We do not capture any email address.

Enter multiple addresses on separate lines or separate them with commas.
TauIQ: A Canonical Image Based Algorithm to Quantify Tau PET Scans
(Your Name) has sent you a message from Journal of Nuclear Medicine
(Your Name) thought you would like to see the Journal of Nuclear Medicine web site.
Citation Tools
TauIQ: A Canonical Image Based Algorithm to Quantify Tau PET Scans
Alex Whittington, Roger N. Gunn, for the Alzheimer’s Disease Neuroimaging Initiative
Journal of Nuclear Medicine Sep 2021, 62 (9) 1292-1300; DOI: 10.2967/jnumed.120.258962

Citation Manager Formats

  • BibTeX
  • Bookends
  • EasyBib
  • EndNote (tagged)
  • EndNote 8 (xml)
  • Medlars
  • Mendeley
  • Papers
  • RefWorks Tagged
  • Ref Manager
  • RIS
  • Zotero
Share
TauIQ: A Canonical Image Based Algorithm to Quantify Tau PET Scans
Alex Whittington, Roger N. Gunn, for the Alzheimer’s Disease Neuroimaging Initiative
Journal of Nuclear Medicine Sep 2021, 62 (9) 1292-1300; DOI: 10.2967/jnumed.120.258962
Twitter logo Facebook logo LinkedIn logo Mendeley logo
  • Tweet Widget
  • Facebook Like
  • Google Plus One
Bookmark this article

Jump to section

  • Article
    • Visual Abstract
    • Abstract
    • MATERIALS AND METHODS
    • RESULTS
    • DISCUSSION
    • CONCLUSION
    • DISCLOSURE
    • Acknowledgments
    • Footnotes
    • REFERENCES
  • Figures & Data
  • Supplemental
  • Info & Metrics
  • PDF

Related Articles

  • This Month in JNM
  • PubMed
  • Google Scholar

Cited By...

  • Protocol for a double-blind placebo-controlled randomised controlled trial assessing the impact of oral semaglutide in amyloid positivity (ISAP) in community dwelling UK adults
  • Google Scholar

More in this TOC Section

Neurology

  • Dopamine D1 Receptor Agonist PET Tracer Development: Assessment in Nonhuman Primates
  • Hypermetabolism on Pediatric PET Scans of Brain Glucose Metabolism: What Does It Signify?
Show more Neurology

Clinical

  • Dopamine D1 Receptor Agonist PET Tracer Development: Assessment in Nonhuman Primates
  • Hypermetabolism on Pediatric PET Scans of Brain Glucose Metabolism: What Does It Signify?
  • TauIQ: A Canonical Image Based Algorithm to Quantify Tau PET Scans
Show more Clinical

Similar Articles

Keywords

  • Statistical Analysis
  • canonical images
  • flortaucipir
  • IQ platform
  • power in clinical trials
  • tau PET
SNMMI

© 2025 SNMMI

Powered by HighWire