


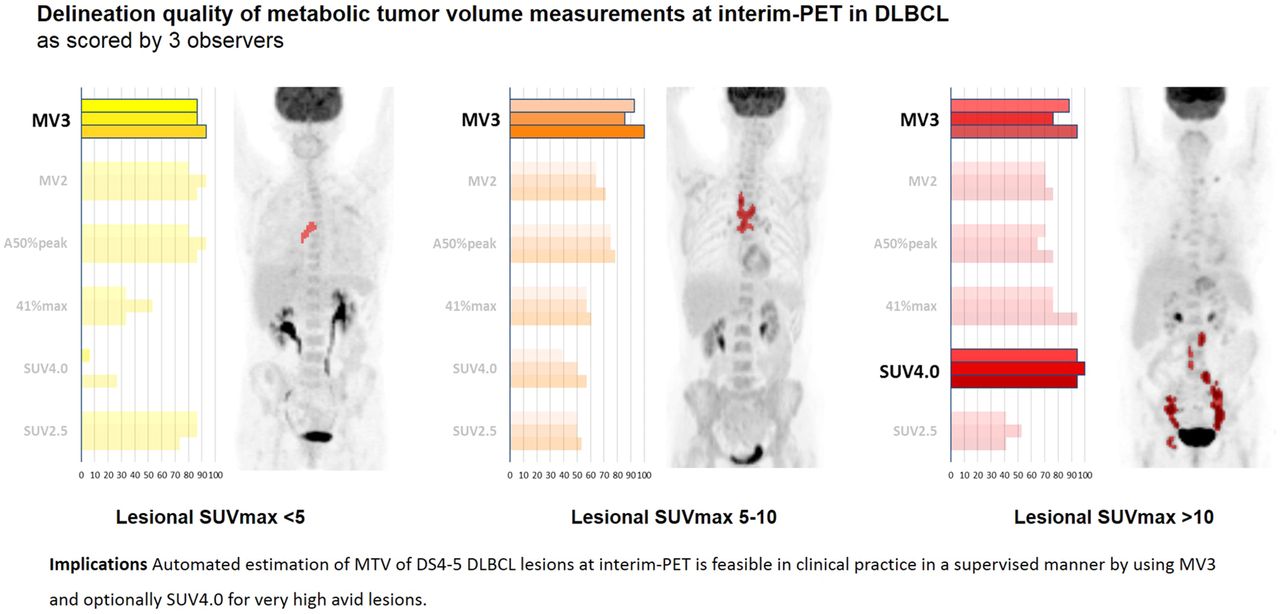
Visual Abstract
Abstract
Metabolic tumor volume (MTV) on interim PET (I-PET) is a potential prognostic biomarker for diffuse large B-cell lymphoma (DLBCL). Implementation of MTV on I-PET requires a consensus on which semiautomated segmentation method delineates lesions most successfully with least user interaction. Methods used for baseline PET are not necessarily optimal for I-PET because of lower lesional SUVs at I-PET. Therefore, we aimed to evaluate which method provides the best delineation quality for Deauville score (DS) 4–5 DLBCL lesions on I-PET at the best interobserver agreement on delineation quality and, second, to assess the effect of lesional SUVmax on delineation quality and performance agreement. Methods: DS 4–5 lesions from 45 I-PET scans were delineated using 6 semiautomated methods: a fixed SUV threshold of 2.5 g/cm3, a fixed SUV threshold of 4.0 g/cm3, an adaptive threshold corrected for source-to-local background activity contrast at 50% of the SUVpeak, 41% of SUVmax per lesion, a majority vote including voxels detected by at least 2 methods, and a majority vote including voxels detected by at least 3 methods (MV3). Delineation quality per MTV was rated by 3 independent observers as acceptable or nonacceptable. For each method, observer scores on delineation quality, specific agreement, and MTV were assessed for all lesions and per category of lesional SUVmax (<5, 5–10, >10). Results: In 60 DS 4–5 lesions on I-PET, MV3 performed best, with acceptable delineation in 90% of lesions and a positive agreement of 93%. Delineation quality scores and agreement per method strongly depended on lesional SUV: the best delineation quality scores were obtained using MV3 in lesions with an SUVmax of less than 10 and using SUV4.0 in more 18F-FDG–avid lesions. Consequently, overall delineation quality and positive agreement improved by applying the most preferred method per SUV category instead of using MV3 as the single best method. The MV3- and SUV4.0-derived MTVs of lesions with an SUVmax of more than 10 were comparable after exclusion of visually failed MV3 contouring. For lesions with an SUVmax of less than 10, MTVs using different methods correlated poorly. Conclusion: On I-PET, MV3 performed best and provided the highest interobserver agreement regarding acceptable delineations of DS 4–5 DLBCL lesions. However, delineation-method preference strongly depended on lesional SUV. Therefore, we suggest exploration of an approach that identifies the optimal delineation method per lesion as a function of tumor 18F-FDG uptake characteristics, that is, SUVmax.
For staging and response evaluation in malignant lymphoma, 18F-FDG PET is a cornerstone (1,2). In Hodgkin lymphoma, the utility of interim PET (I-PET) in early response-adapted therapy has been demonstrated (3). In diffuse large B-cell lymphoma (DLBCL), the role of I-PET–adapted strategies is still controversial, mainly because of their insufficient positive predictive value (4).
To date, I-PET scans are classified using the 5-point Deauville score (DS) as described in the guidelines of the International Conference on Malignant Lymphoma (2). However, DS of 4–5, which usually are considered treatment failures, suffer from a poor positive predictive value (4,5). Discrimination between true nonresponders and responders might improve by quantification (e.g., the relative change in standardized tracer uptake) (5–11). Quantification will reduce observer variability, and this is essential for successful clinical implementation.
Metabolic tumor volume (MTV) before treatment seems to have prognostic value (12–14). It has been suggested that MTV at I-PET might add prognostic value as well (7–9,15–17). Measuring MTV on I-PET is, however, challenging since lesional contrast in I-PET is often limited. Moreover, 18F-FDG uptake can be heterogeneous within and between lesions. Low, heterogeneous uptake results in poor delineation reproducibility (18). In addition, manual tumor segmentation is extremely time-consuming. Semiautomated or fully automated segmentation methods may partially eliminate these drawbacks (19–21), such as the so-called threshold-based methods, in which the delineation threshold is based on a fixed SUV (e.g., a fixed SUV threshold of 2.5 g/cm3 [SUV2.5] or a fixed SUV threshold of 4.0 g/cm3 [SUV4.0]), a fixed percentage of tumor SUV (e.g., ≥41% of SUVmax), or a contrast-oriented algorithm (adaptive thresholds, e.g., an adaptive threshold corrected for source-to-local background activity contrast at 50% of the SUVpeak [A50%peak]) (22).
The prognostic relevance of baseline MTV is relatively independent of delineation methodology (albeit with different cutoffs) (12–14). Here, SUV4.0 seems to be most successful on the basis of interobserver reliability and ease of use (13,23). However, this method is not necessarily optimal at I-PET, because at that time point, lesional tracer uptake and target-to-background contrast are lower, which may affect delineation quality. Consequently, more user interaction is needed to obtain proper delineations, resulting in a potentially higher interobserver variability. Initial studies evaluating MTV at I-PET showed prognostic value, but each applied a different threshold method (37%, 40%–42% SUVmax, SUV2.5, SUV4.0, gradient-based method). Moreover, observer variation was not reported.
The delineation performance of these methods may depend on tumor 18F-FDG uptake characteristics (24,25). Therefore, selection of the optimal method based on lesional imaging characteristics, as suggested by the ATLAAS (Automatic Decision Tree-Based Learning Algorithm) selection approach, might improve delineation quality over use of a single method for all lesions (26).
Successful validation and implementation of I-PET MTV in clinical trials and practice require reliable, reproducible MTV measurements at minimal operator interaction. Therefore, the aim of this study was to evaluate which method provides qualitative acceptable delineations of DS 4–5 DLBCL lesions on I-PET most often, with high interobserver agreement; to study whether lesional SUVmax affects delineation performance agreement; and, finally, to assess to what extent overall delineation performance improves through selection of the best delineation method based on lesional SUVmax.
MATERIALS AND METHODS
Patient and PET Imaging Selection
This study included newly diagnosed DLBCL patients, with available I-PET data, from the HOVON (Stichting Hemato-Oncologie voor Volwassenen Nederland)-84 study, an international randomized clinical trial approved by institutional review board or ethics committees, conducted between November 2007 and April 2012 (EudraCT 2006-005174-42, NTR10140) (27,28).
HOVON-84 was designed to evaluate early intensification of rituximab in the first 4 cycles combined with cyclophosphamide, doxorubicin, vincristine, and prednisone on the response rate and time to reach response in previously untreated eligible patients with CD-20–positive DLBCL. I-PET was performed after 4 cycles and was centrally reviewed by 2 independent, experienced nuclear medicine physicians using the DS system and by a third reviewer when adjudication was required (27).
For the present study, we randomly selected 45 I-PET/CT scans of patients with an incomplete metabolic response (DS 4–5).
Automated PET Delineation Methods
Using in-house–developed software (ACCURATE tool), we applied 6 automated PET delineation methods. Four of these delineation methods were threshold-based, using SUV2.5, SUV4.0, a threshold at 41% of the SUVmax per lesion (41%max), and A50%peak (19,29). The A50%peak method segments lesions when lesional uptake is less than twice the local background, defined as the mean uptake of a single-voxel shell 2.5 cm around the edge of a 70%-of-SUVmax isocontour, excluding voxels with an SUVmax of more than 2.5 (30). SUVpeak was defined as the highest average SUV of a 1 cm3 sphere volume of interest across all positions within the target lesion (31).
The 2 remaining delineation methods were based on a majority-vote approach by which contours were determined by the intersection of the 4 threshold-based delineations. For these majority votes, a voxel was included in the consensus delineation according to the results of the majority of the threshold-based methods. If there was agreement between at least 2 of the threshold-based methods, the method was called majority-vote 2 (MV2); if there was agreement between at least 3 of the threshold-based methods, the method was called majority-vote 3 (MV3).
These 6 methods semiautomatically segmented MTVs on the basis of the voxel with the highest detected SUV (SUVmax/SUVpeak) within the manually selected lymphoma target lesion. Semiautomated derived delineations were not manually adapted.
Observer Evaluation
Volumes of interest from these 6 methods were visualized on all I-PET images to allow assessment of delineation quality separately by 3 observers (a nuclear medicine physician [5 y of experience], a radiologist [5 y of experience], and a hematologist [15 y of experience]). Observers were masked to the delineation method and clinical outcomes but not to the baseline PET/CT results. Each observer evaluated the quality of the MTV segmentation on a lesional basis.
The delineation quality per method was scored as follows (Supplemental Fig. 1; supplemental materials are available at http://jnm.snmjournals.org) (23): acceptable (MTV required no [“good”] or minimal [“moderate”] manual adaption to obtain a visually accurate lymphoma segmentation) or nonacceptable (MTV included a lot of physiologic background activity or visually did not select the complete lymphoma lesion, requiring extensive manual adaption [“poor”], or MTV was so poorly defined that even extensive manual adaption was no longer considered feasible [“failed”]).
Statistical Analysis
The median and interquartile range of the observed MTVs were calculated for each delineation method.
For all lesions, the dichotomous delineation quality scores, as rated by the observers, were summarized as frequencies for each of the 6 delineation methods. Additionally, observer scores were calculated for lesions categorized by their SUVmax (<5, 5–10, or >10) to evaluate the effect of lesional SUVmax on these quality scores.
To evaluate which method obtained the best agreement among observers on providing acceptable delineations (i.e., without the need for extensive manual correction) of DLBCL I-PET lesions, we used percentage agreement, specified for a rating of “acceptable” (for a positive test result: positive agreement, PA) (32,33). PA implies the percentage probability that observer B scores a method’s MTV as acceptable identically to observer A. The negative agreement (NA) measure reflects the probability that observers agreed that the delineation performance rating was not acceptable. We focused primarily on the agreement on the best-performing method; therefore, NA measures are reported only to provide a complete overview of the results.
Additional specific agreement analyses were performed per SUVmax category. On the basis of the highest acceptable delineation quality score and its PA, we explored which method was preferred per SUVmax category. Next, we evaluated the extent to which the overall interobserver scoring performance improved when, per SUVmax category, the most preferred method was used.
We explored whether MTV calculated with the multiple-methods-of-preference approach could be converted—by applying a mathematic transformation—into values that are comparable when using the single method of preference. Therefore, we tested whether these MTVs per SUVmax category were log-normally distributed, and we assessed their correlation with a Pearson correlation coefficient.
RESULTS
The 45 I-PET scans showed 60 DS 4–5 lesions (range, 1–4 per scan) with a median SUVmax of 6.9 (interquartile range, 5.0–10.2). The smallest median MTV was obtained with SUV4.0 (2.3 cm3) and MV3 (4.9 cm3) and the largest with SUV2.5 (29.9 cm3) and 41%max (27.6 cm3) (Table 1).
Description of Observed MTVs per Method
Regarding delineation quality scores, the MV3-derived MTVs were most frequently considered visually acceptable, with an average of 90% of the lesions receiving an observer score of acceptable (Fig. 1; Table 2; Supplemental Table 1). A50%peak and MV2 showed a lower delineation performance (in 77.2% and 72.8% of lesions, respectively), whereas SUV4.0 least frequently provided acceptable delineations (52.8%). The observer scores per method differed among SUVmax categories: for the SUV2.5 and A50%peak methods, a score of acceptable was given more frequently for lesions with an SUVmax of less than 5 than for lesions with an SUVmax of more than 5. The opposite trend was observed for the SUV4.0 and 41%max methods. For the MV3 method, the frequency of a score of acceptable varied by 6.6% among the SUV categories; this method was therefore less affected by lesional SUVmax than the other methods.
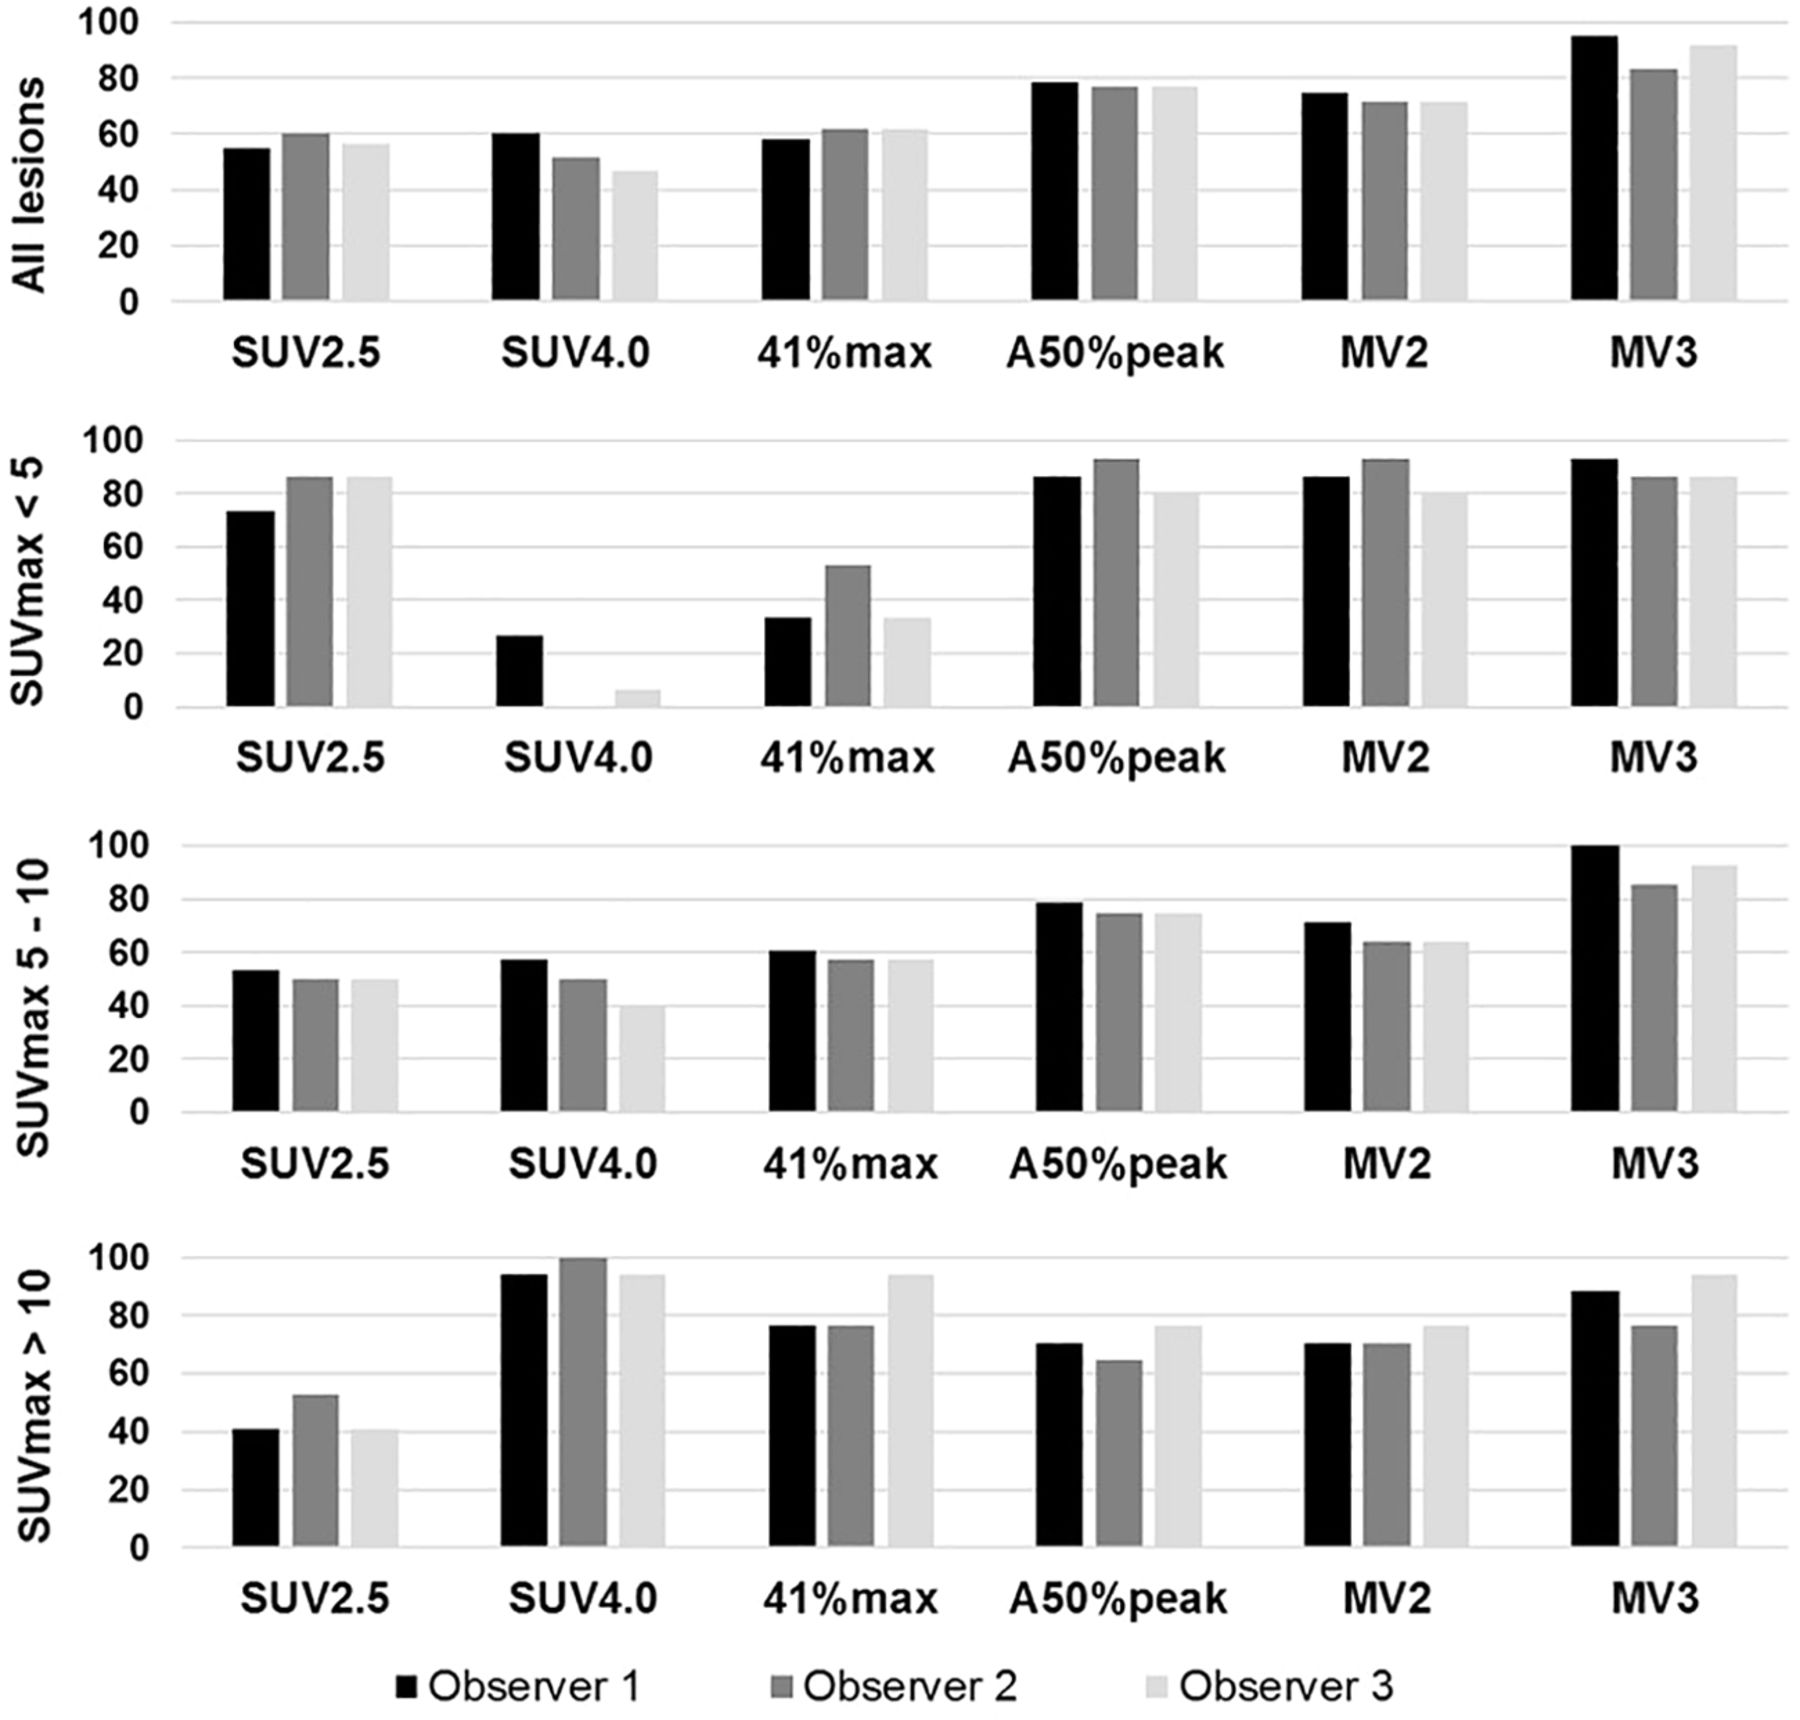
Frequency of delineation quality score of acceptable per delineation method as rated by observers.
Frequency of Delineation Quality Scores and Specific Agreement
Specific agreement on a rating of acceptable, calculated over all lesions, revealed that the PA was highest for the MV3 (93.2%), A50%peak (92.1%), and MV2 (90.8%) methods, whereas the PA for the other methods was lower, at 79.6% for SUV2.5, 84.2% for SUV4.0, and 87.2% for 41%max. The observers agreed that for only 38.9% of the lesions, MV3 did provide nonacceptable delineations (NA). The highest NA for a rating of acceptable was reached for the 41%max method (80.3%) and the SUV4.0 method (82.4%).
The specific agreement per method depended on lesional SUVmax (Table 2; Fig. 2). The absolute threshold methods showed opposite trends, in which the SUV2.5 method performed well mainly in lesions with a low SUVmax, and the SUV4.0 method performed well mainly in lesions with a high SUVmax. Of the relative threshold methods, the 41%max method performed suboptimally in lesions with an SUVmax of less than 5 (PA of 77.8%), compared with higher avid lesions (SUVmax 5–10, PA 91.8% and SUVmax >10, PA 85.7%), whereas A50%peak performed best in lesions with low avidity (SUVmax < 5; PA, 94.9%). Both majority-vote methods showed a high PA in lesions with an SUVmax of less than 10, but MV3 performed best, with a lower NA, in these lesions with low or medium avidity (SUVmax, 5–10).
MV3 was the method of preference for lesions with an SUVmax of less than 10, based on the highest frequency for an observer score of acceptable combined with one of highest PA and lowest NA values (Table 2; Supplemental Table 1). SUV4.0 was considered the most preferred method for lesions with an SUVmax of more than 10. Comparing the method-of-preference approach with MV3, as the overall best-performing method, resulted in an overall increase from 90% to 92.8% in the frequency of a score of acceptable, an increase from 93.2% to 95.2% in PA, and a decrease from 38.9% to 30.5% in NA.
Log-transformed MTVs obtained using MV3 and SUV4.0 for lesions with an SUVmax of more than 10, both normally distributed (Shapiro-Wilk, P > 0.05), showed a strongly positive linear relationship (R2 = 0.87, P < 0.001). All SUV4.0- and MV3-derived MTVs for lesions with an SUVmax of more than 10 were nearly equal and within 1.96 SDs or 10 cm3 from the line of identity, except for 2 outliers (*A and *B in Fig. 3; Supplemental Fig. 2). The MV3 method for both of these outlier MTVs was rated as nonacceptable by the observers, each suggesting an underestimation of lesion volume, whereas MV3 was rated as acceptable for the other MTVs in this SUV category.
Since MV3 was considered the overall single method of preference and the preferred method for lesions with an SUVmax of less than 10, no additional transformation analyses were required. None of the log-transformed method-derived volumes of lesions with an SUVmax of less than 10, including MV3 and SUV4.0, were normally distributed or showed high Spearman correlation coefficients (Supplemental Fig. 3).
DISCUSSION
To the best of our knowledge, this was the first multiobserver study that evaluated the delineation performance of several semiautomated segmentation methods for DS 4–5 DLBCL lesions at I-PET. Overall, MV3-derived MTVs were most frequently scored as acceptable, with the highest PA and lowest NA.
Previous studies suggested that, in DLBCL, a low MTV on I-PET or a major decrease in MTV versus baseline PET predicts response at end-of-treatment PET and progression-free survival (7–9,15–17). However, MTV cutoffs were different, and it is unclear whether or to what extent this difference relates to the use of different semiautomated delineation algorithms. Oñate-Ocaña et al. used a 40% SUVmax threshold (9); Zhang et al., 41% (17); Wu et al., 42% (34); and Malek et al., 37% (7), along with a gradient-based segmentation method, whereas Islam et al. applied an SUV4.0 threshold (8) and Yang et al. (15) and Mikhaeel et al. (16) an SUV2.5 threshold of 2.5. These differences preclude any meaningful metaanalysis to build the case of evidence for MTV as a predictor of clinical outcome additional to ΔSUVmax and the 5-point DS (10,11)—the latter, particularly for I-PET DLBCL studies, frequently prevailing at I-PET in contrary to baseline PET, since correlation between MTVs obtained by different segmentation methods is generally low for lesions with an SUVmax of less than 10 (Supplemental Fig. 3).
The delineation quality and reproducibility of a method based on a fixed SUV threshold may be most sensitive to lesion uptake and local tumor-to-background contrast (24,25). Evaluating this hypothesis in our DLBCL I-PET cohort indeed showed that besides MTV correlations, quality scores and interobserver agreement also strongly depended on the lesional SUVmax (Fig. 2; Table 2; Supplemental Fig. 3). This dependence explains, at least partly, the discordance in method preference at baseline PET/CT, when SUV4.0 was preferred, versus the preference for MV3 at I-PET, as the lesional tracer uptake is much lower at I-PET than at baseline (13,23). The delineation performance of SUV4.0 was still successful at I-PET for highly avid lesions (SUVmax > 10), that is, for lesions with uptake levels comparable to baseline levels.
The delineation performance of the 41%max method was also considered less successful in lesions with low avidity—that is, with a low tumor-to-background ratio (Table 2; frequency of 40% for a delineation-quality score of acceptable; PA, 78%). This finding is in line with the European Association of Nuclear Medicine guidelines for tumor imaging (35). Our results suggest that delineating lesions of low avidity is most successful using SUV2.5, A50%peak, MV2, and MV3 (Figs. 1 and 2; Table 2). Overall, for MV3, the observer score frequency and PA for successful delineation was best and was least affected by lesional SUV. Therefore, MV3 might be considered the single method of choice for assessing MTV in patients or PET studies showing a large variation in lesional tracer uptake.
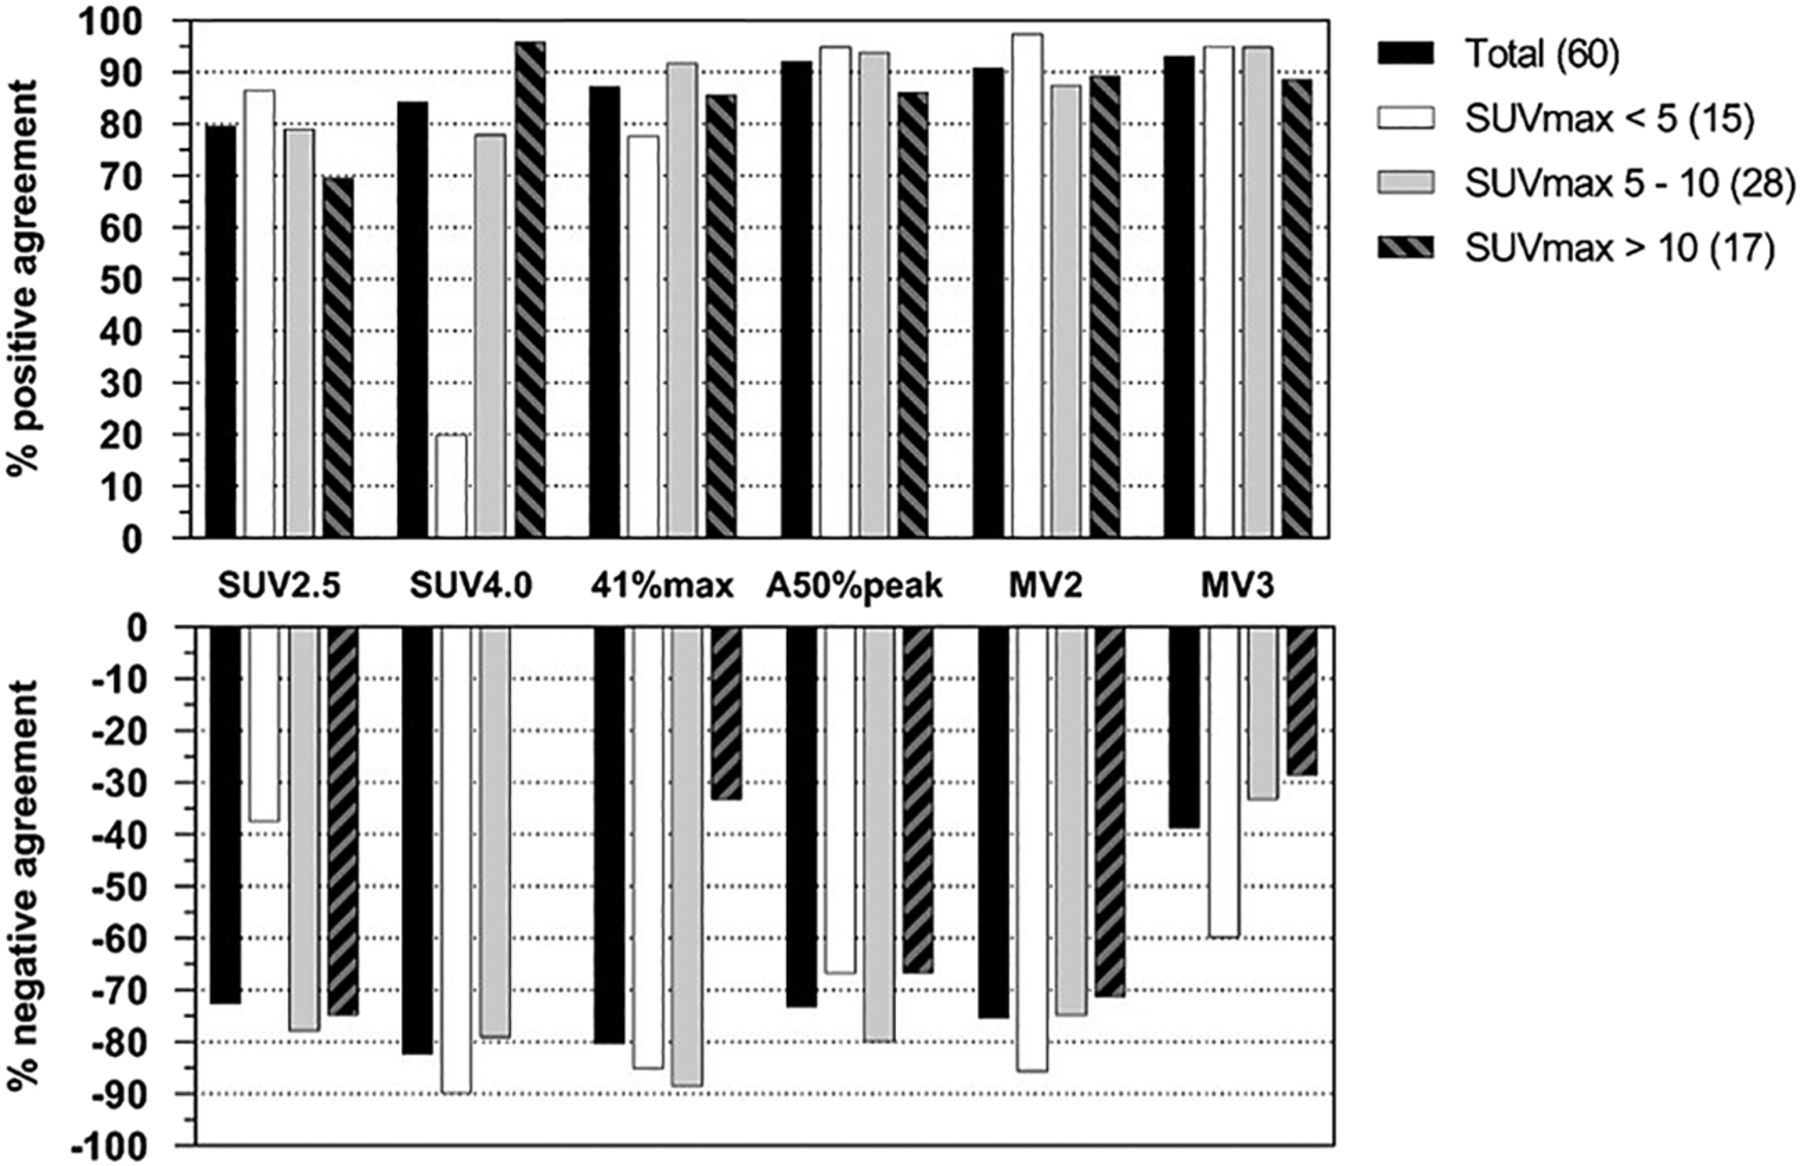
PA and NA on delineation quality score of acceptable as function of lesional SUVmax per method.
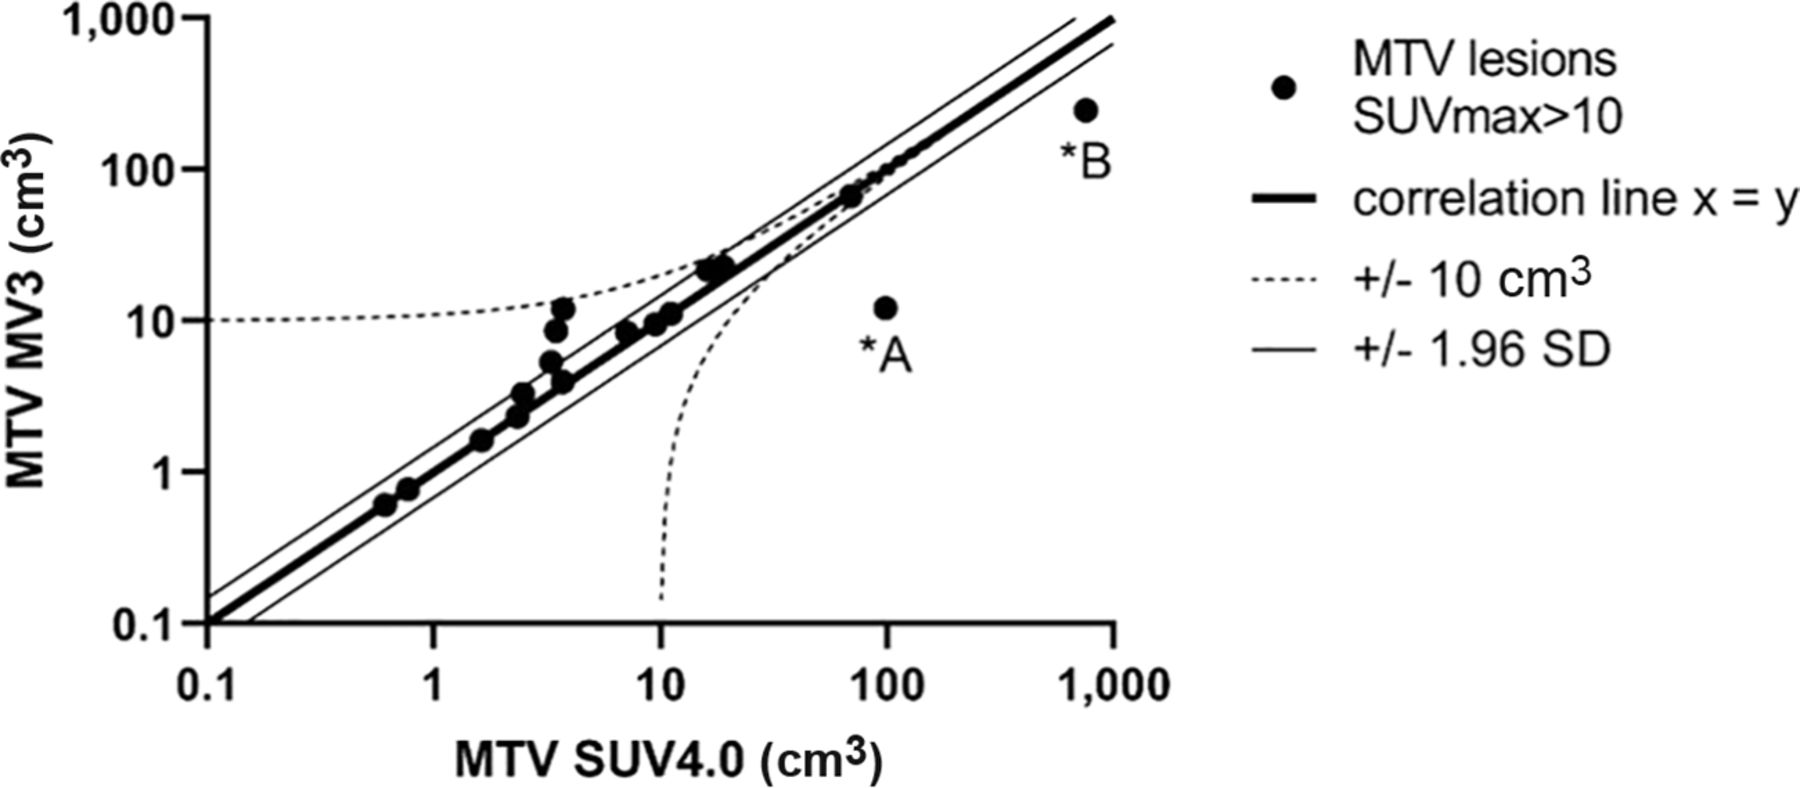
Scatterplot of MTVs derived from MV3 vs. SUV4.0 for lesions with SUVmax > 10. MTV *A and *B applied by MV3 and SUV4.0 differed by more than 10 cm3 and 1.96 SD from line of identity (*A and *B are demonstrated in Supplemental Fig. 2).
However, no single semiautomated delineation method—not even MV3—performs optimally for different types of lymphoma at different therapeutic stages without the need for manual correction (25). Therefore, a workflow in which observers select the visually best-performing method per lesion might improve overall delineation success while minimizing interobserver variability compared with manual segmentation (36). Translating this workflow at I-PET for DBLCL might imply that lesions with an SUVmax of less than 10 should be delineated using the MV3 method and that the SUV4.0 method should be used if lesions have an SUVmax of more than 10 or if the observers consider contouring with the MV3 to have failed.
Berthon et al. introduced an approach to selecting a delineation method; in this approach, an ATLAAS is used to further improve accurate and reproducible lesion segmentation (26). This concept is based on selecting the best method from several predefined methods using lesion characteristics as input, and the approach outperformed the PET segmentation accuracy of each single method. We also found that compared with use of each delineation method separately, use of the method with the highest acceptable score frequency per SUV category resulted in a more successful delineation performance (Table 2). The overall good performance of MV3 is to some extent in line with the ATLAAS approach, as the two approaches are both consensus-based; that is, the MV3 method is based on majority-vote selection of the voxels to be included in the final MV3 volume of interest using 4 segmentation methods as input. Therefore, other consensus approaches, such as STAPLE (simultaneous truth and performance level estimation), might demonstrate an overall good delineation performance in DLBCL I-PET as well (37). However, identifying a single MTV delineation algorithm that is accurate, is easy to use, is reliable when applied in multicenter or multiobserver settings, and has good prognostic performance may need to be reconsidered against an approach based on selecting the most preferred method on a lesional basis, in particular for I-PET. Adding tumor volume, tumor SUVpeak-to-background ratio, and other PET metrics for selecting the best delineation method per lesion might further improve the delineation performance (26). Nevertheless, development of such an approach requires a much larger dataset. Other advanced semiautomated segmentation methods, such as those based on artificial intelligence, might also increase the delineation success but are not yet available and presently hamper implementation in a multicenter setting (38). Our proposed approach is readily available because it can be applied simply by first determining SUVmax and then using the MV3 or SUV4.0 method without the need to develop complicated new tools.
Overall, we agree that the current literature has not made a convincing case that MTV outperforms ΔSUVmax at I-PET. However, its potential added value can be demonstrated only if MTV methodology is optimized and harmonized. Finally, it is unclear whether inconclusive I-PET–guided trials are caused by inappropriate patient selection (relying solely on the far-from-perfect accuracy of the positivity criteria used so far). Therefore, attempts to improve and standardize the I-PET response criteria, possibly including MTV, are urgently needed.
CONCLUSION
To delineate DS4–5 DLBCL lesions on I-PET, the semiautomatic delineation approach MV3 was most often successful, and at the highest interobserver agreement. However, delineation quality and interobserver agreement strongly depended on SUVmax. Therefore, a delineation-method selection strategy using lesional tracer uptake metrics as input may provide better segmentation. Since MV3 already showed a very high success rate of 90% across all lesions, we propose use of this method for measuring the MTV of DS 4–5 lesions at I-PET in a supervised manner, that is, by visually inspecting the delineation and optionally choosing the SUV4.0 method for lesions of very high avidity (SUVmax > 10) when deemed necessary.
DISCLOSURE
Some authors (and their time) are partially funded by the PETRA and RADIOMICS projects. The PETRA and RADIOMICS studies are supported by Alpe d’HuZes/KWF (Dutch Cancer Society; VU2012-5848 and VU2018-11648). No other potential conflict of interest relevant to this article was reported.
KEY POINTS
QUESTION: Which method best delineates DS 4–5 DLBCL lesions on I-PET and has the highest interobserver agreement regarding acceptable delineation, and how should the effect of lesional SUVmax on delineation quality and performance agreement be assessed?
PERTINENT FINDINGS: MV3 performed best and at the highest interobserver agreement regarding acceptable delineation of DS 4–5 DLBCL lesions on I-PET. Delineation-method preference strongly depended on lesional SUV.
IMPLICATIONS FOR PATIENT CARE: Automated estimation of the MTV of DS 4–5 DLBCL lesions at I-PET is feasible in clinical practice in a supervised manner using MV3 and, optionally, SUV4.0 for lesions of very high avidity.
Footnotes
Published online March 5, 2021.
- © 2021 by the Society of Nuclear Medicine and Molecular Imaging.
REFERENCES
- Received for publication October 15, 2020.
- Accepted for publication February 16, 2021.
In this issue


Jump to section
Related Articles
Cited By...
- No citing articles found.