
Main menu

  • Home
  • Content
    • Current
    • Ahead of print
    • Past Issues
    • JNM Supplement
    • SNMMI Annual Meeting Abstracts
    • Continuing Education
    • JNM Podcasts
  • Subscriptions
    • Subscribers
    • Institutional and Non-member
    • Rates
    • Journal Claims
    • Corporate & Special Sales
  • Authors
    • Submit to JNM
    • Information for Authors
    • Assignment of Copyright
    • AQARA requirements
  • Info
    • Reviewers
    • Permissions
    • Advertisers
  • About
    • About Us
    • Editorial Board
    • Contact Information
  • More
    • Alerts
    • Feedback
    • Help
    • SNMMI Journals
  • SNMMI
    • JNM
    • JNMT
    • SNMMI Journals
    • SNMMI

User menu

  • Subscribe
  • My alerts
  • Log in
  • My Cart

Search

  • Advanced search
Journal of Nuclear Medicine
  • SNMMI
    • JNM
    • JNMT
    • SNMMI Journals
    • SNMMI
  • Subscribe
  • My alerts
  • Log in
  • My Cart
Journal of Nuclear Medicine

Advanced Search

  • Home
  • Content
    • Current
    • Ahead of print
    • Past Issues
    • JNM Supplement
    • SNMMI Annual Meeting Abstracts
    • Continuing Education
    • JNM Podcasts
  • Subscriptions
    • Subscribers
    • Institutional and Non-member
    • Rates
    • Journal Claims
    • Corporate & Special Sales
  • Authors
    • Submit to JNM
    • Information for Authors
    • Assignment of Copyright
    • AQARA requirements
  • Info
    • Reviewers
    • Permissions
    • Advertisers
  • About
    • About Us
    • Editorial Board
    • Contact Information
  • More
    • Alerts
    • Feedback
    • Help
    • SNMMI Journals
  • View or Listen to JNM Podcast
  • Visit JNM on Facebook
  • Join JNM on LinkedIn
  • Follow JNM on Twitter
  • Subscribe to our RSS feeds
Research ArticleThe State of the Art
Open Access

Imaging Cancer Metabolism: Underlying Biology and Emerging Strategies

Austin R. Pantel, Daniel Ackerman, Seung-Cheol Lee, David A. Mankoff and Terence P. Gade
Journal of Nuclear Medicine September 2018, 59 (9) 1340-1349; DOI: https://doi.org/10.2967/jnumed.117.199869
Austin R. Pantel
1Department of Radiology, University of Pennsylvania, Philadelphia, Pennsylvania
  • Find this author on Google Scholar
  • Find this author on PubMed
  • Search for this author on this site
Daniel Ackerman
2Penn Image-Guided Interventions Laboratory, Department of Radiology, University of Pennsylvania, Philadelphia, Pennsylvania; and
  • Find this author on Google Scholar
  • Find this author on PubMed
  • Search for this author on this site
Seung-Cheol Lee
1Department of Radiology, University of Pennsylvania, Philadelphia, Pennsylvania
  • Find this author on Google Scholar
  • Find this author on PubMed
  • Search for this author on this site
David A. Mankoff
1Department of Radiology, University of Pennsylvania, Philadelphia, Pennsylvania
  • Find this author on Google Scholar
  • Find this author on PubMed
  • Search for this author on this site
Terence P. Gade
1Department of Radiology, University of Pennsylvania, Philadelphia, Pennsylvania
2Penn Image-Guided Interventions Laboratory, Department of Radiology, University of Pennsylvania, Philadelphia, Pennsylvania; and
3Department of Cancer Biology, University of Pennsylvania, Philadelphia, Pennsylvania
  • Find this author on Google Scholar
  • Find this author on PubMed
  • Search for this author on this site
  • Article
  • Figures & Data
  • Info & Metrics
  • PDF
Loading

Article Figures & Data

Figures

  • FIGURE 1.
    • Download figure
    • Open in new tab
    • Download powerpoint
    FIGURE 1.

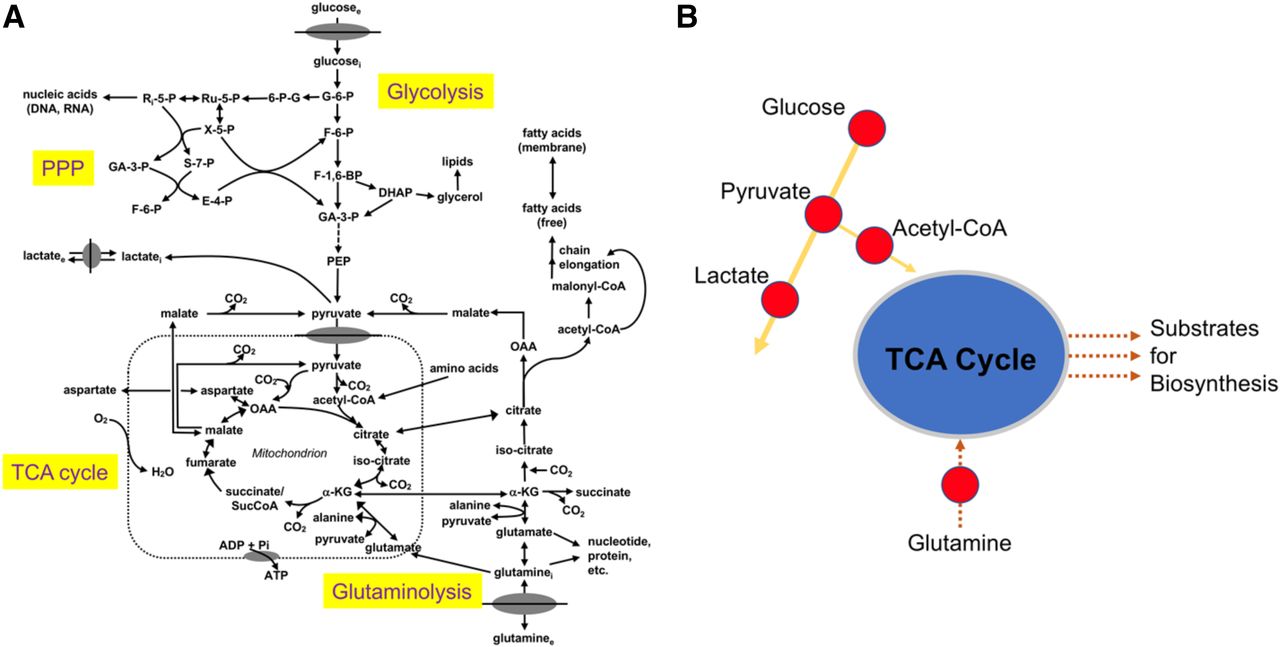
    Simplified schematic of central cellular metabolic pathways (A) emphasizing key branch points and imaging targets (B). glucosee = extracellular glucose; glucosei = intracellular glucose; G-6-P = glucose-6-phosphate; 6-P-G = 6-phosphogluconate; Ru-5-P = ribulose-5-phosphate; Ri-5-P = ribose-5-phosphate; X-5-P = xylulose 5-phosphate; S-7-P = sedoheptulose 7-phosphate; GA-3-P = glyceraldehyde 3-phosphate; F-6-P = fructose 6-phosphate; E-4-P = erythrose 4-phosphate; PPP = pentose phosphate pathway; F-1,6-BP = fructose 1,6-bisphosphate; DHAP = dihydroxyacetone phosphate; PEP = phosphoenolpyruvate; lactatei = intracellular lactate; lactatee = extracellular lactate; CO2 = carbon dioxide; α-KG = α-ketoglutarate; OAA = oxaloacetate; O2 = oxygen; ADP = adenosine diphosphate; Pi = inorganic phosphate; glutaminee = extracellular glutamine; glutaminei = intracellular glutamine. (Adapted and reprinted with permission of (4).)

  • FIGURE 2.
    • Download figure
    • Open in new tab
    • Download powerpoint
    FIGURE 2.

    (A, top) Chemical diagram showing metabolism of [1-13C]pyruvate to [1-13C]lactate catalyzed by lactate dehydrogenase. (A, bottom) Representative 13C spectra obtained after injection of hyperpolarized [1-13C]pyruvate show increased [1-13C]lactate relative to [1-13C]pyruvate in prostate cancer compared with normal prostate. (B) T2-weighted MR image from different patient shows findings of prostate cancer (yellow square) and adjacent normal contralateral prostate (turquoise square), as well as a vessel outside prostate (green square). (C–E) Curves fit from 2-dimensional 13C dynamic MRSI acquisitions in this patient demonstrate increased flux of [1-13C]pyruvate to [1-13C]lactate in corresponding regions of prostate cancer (D) compared with normal prostate (C) and vasculature outside prostate (E). (Adapted and reprinted with permission of (75).)

  • FIGURE 3.
    • Download figure
    • Open in new tab
    • Download powerpoint
    FIGURE 3.

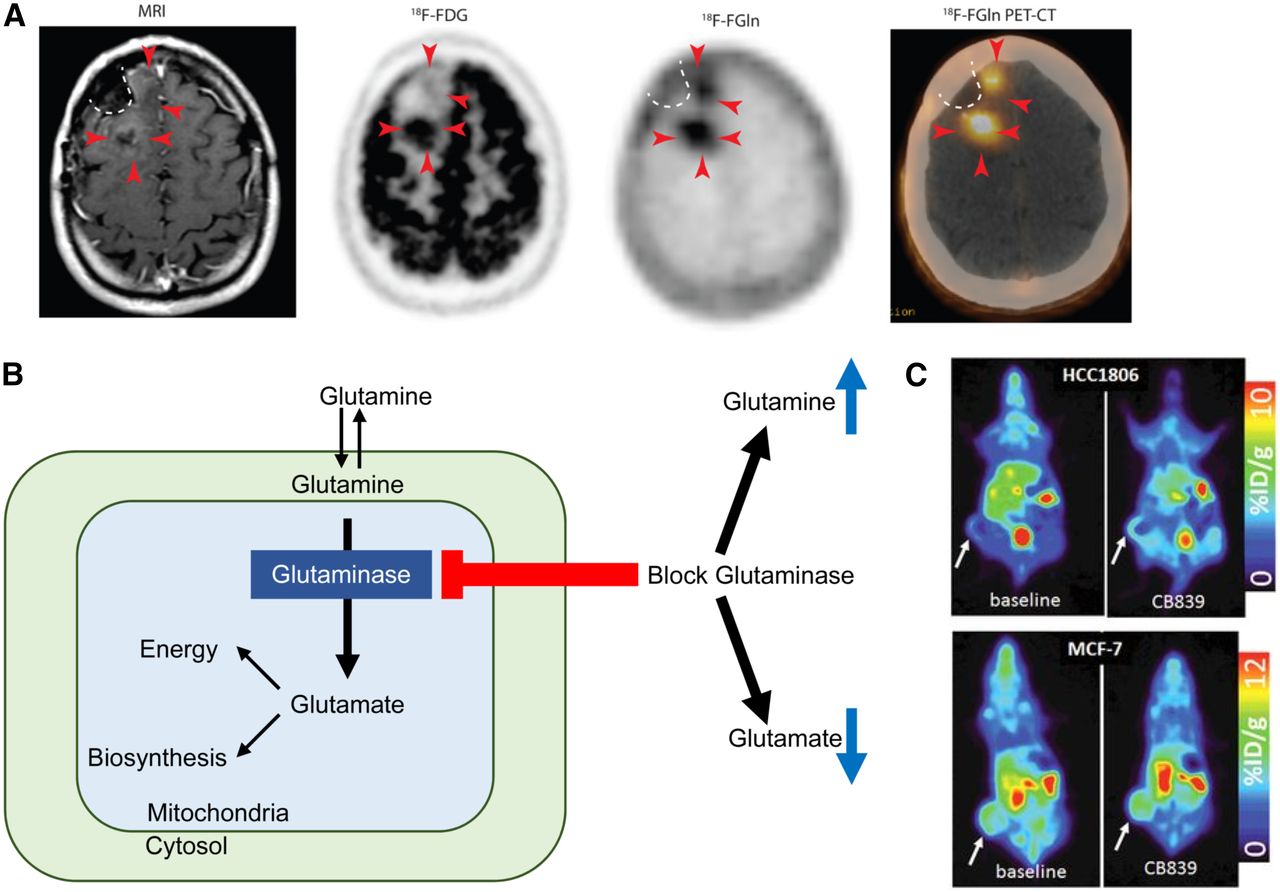
    (A) T1-weighted MRI with contrast shows minimal enhancement (arrowheads) along surgical cavity (dotted line) in glioma patient. Corresponding 18F-FDG PET image shows uptake in tumor posteriorly but not anteriorly (arrowheads). Corresponding 18F-glutamine (Gln) PET image shows tumor uptake both posteriorly and anteriorly. This patient had clinically progressive disease. (Adapted and reprinted with permission of (79).) (B) Schematic of glutamine metabolism and effect of glutaminase inhibitors. With glutaminase inhibition, cellular glutamine increases whereas cellular glutamate decreases. (C, top) 18F-glutamine PET images of triple-negative breast cancer xenograft show increased 18F-glutamine uptake after glutaminase inhibition reflecting increased glutamine pool size. (C, bottom) In contrast, receptor-positive breast cancer xenograft shows high uptake of 18F-glutamine at baseline without increase after glutaminase inhibition reflecting inherently low glutaminase activity. (Adapted and reprinted with permission of (81).)

  • FIGURE 4.
    • Download figure
    • Open in new tab
    • Download powerpoint
    FIGURE 4.

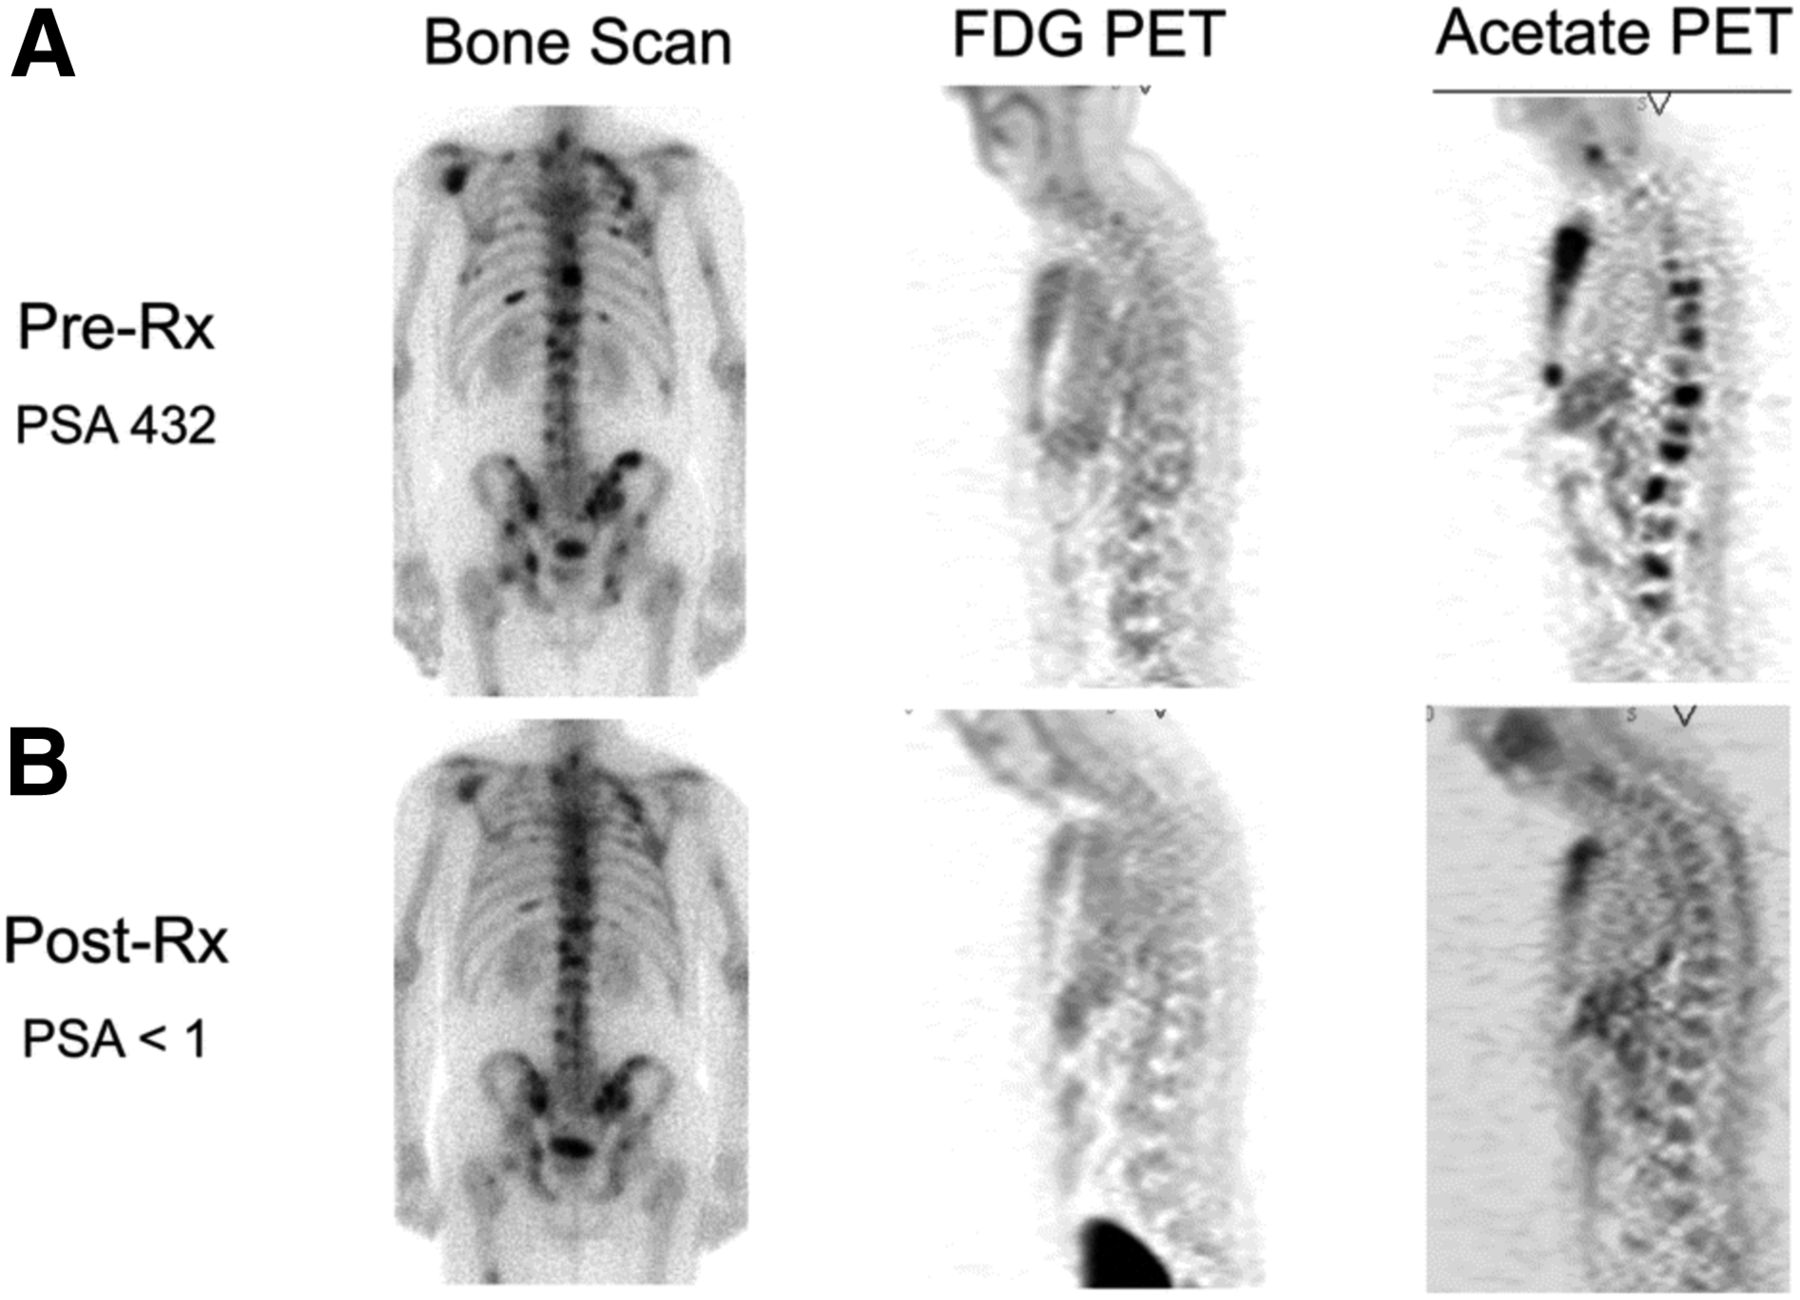
    Comparison of bone scan, 18F-FDG PET, and 11C-acetate PET before (A) and after (B) androgen deprivation therapy in patient with osseous metastases from prostate cancer. 11C-acetate demonstrates response to treatment. Bone scan does not demonstrate significant change, and 18F-FDG PET fails to detect osseous metastases at either time point. PSA = prostate-specific antigen level. (Reprinted with permission of (100).)

PreviousNext
Back to top

In this issue

Journal of Nuclear Medicine: 59 (9)
Journal of Nuclear Medicine
Vol. 59, Issue 9
September 1, 2018
  • Table of Contents
  • Table of Contents (PDF)
  • About the Cover
  • Index by author
Print
Download PDF
Article Alerts
Sign In to Email Alerts with your Email Address
Email Article

Thank you for your interest in spreading the word on Journal of Nuclear Medicine.

NOTE: We only request your email address so that the person you are recommending the page to knows that you wanted them to see it, and that it is not junk mail. We do not capture any email address.

Enter multiple addresses on separate lines or separate them with commas.
Imaging Cancer Metabolism: Underlying Biology and Emerging Strategies
(Your Name) has sent you a message from Journal of Nuclear Medicine
(Your Name) thought you would like to see the Journal of Nuclear Medicine web site.
Citation Tools
Imaging Cancer Metabolism: Underlying Biology and Emerging Strategies
Austin R. Pantel, Daniel Ackerman, Seung-Cheol Lee, David A. Mankoff, Terence P. Gade
Journal of Nuclear Medicine Sep 2018, 59 (9) 1340-1349; DOI: 10.2967/jnumed.117.199869

Citation Manager Formats

  • BibTeX
  • Bookends
  • EasyBib
  • EndNote (tagged)
  • EndNote 8 (xml)
  • Medlars
  • Mendeley
  • Papers
  • RefWorks Tagged
  • Ref Manager
  • RIS
  • Zotero
Share
Imaging Cancer Metabolism: Underlying Biology and Emerging Strategies
Austin R. Pantel, Daniel Ackerman, Seung-Cheol Lee, David A. Mankoff, Terence P. Gade
Journal of Nuclear Medicine Sep 2018, 59 (9) 1340-1349; DOI: 10.2967/jnumed.117.199869
Twitter logo Facebook logo LinkedIn logo Mendeley logo
  • Tweet Widget
  • Facebook Like
  • Google Plus One
Bookmark this article

Jump to section

  • Article
    • Abstract
    • MECHANISMS OF CELLULAR METABOLIC DYSREGULATION
    • IMAGING GLUCOSE METABOLISM
    • IMAGING METABOLIC PATHWAYS BEYOND GLYCOLYSIS
    • CONCLUSION
    • DISCLOSURE
    • Footnotes
    • REFERENCES
  • Figures & Data
  • Info & Metrics
  • PDF

Related Articles

  • This Month in JNM
  • PubMed
  • Google Scholar

Cited By...

  • Deuterium Magnetic Resonance Spectroscopy of Early Treatment-Induced Changes in Tumour Lactate in vitro
  • Hyperpolarized [1-13C]pyruvate-to-[1-13C]lactate conversion is rate-limited by monocarboxylate transporter-1 in the plasma membrane
  • Google Scholar

More in this TOC Section

  • The Role of PSMA PET Parameters as Biomarkers for Response to PSMA-Targeted Radiopharmaceutical Therapy
  • Rethinking Dosimetry: A European Perspective
  • A Vision for Gastrin-Releasing Peptide Receptor Targeting for Imaging and Therapy: Perspective from Academia and Industry
Show more The State of the Art

Similar Articles

Keywords

  • cancer metabolism
  • magnetic resonance imaging
  • molecular imaging
  • positron-emission tomography
SNMMI

© 2025 SNMMI

Powered by HighWire