


Abstract
The goal of this study was to validate the use of an MR-compatible blood sampler (BS) with a detector system based on a lutetium oxyorthosilicate scintillator and avalanche photodiodes for small-animal PET. Methods: Five rats underwent a 60-min 18F-FDG study. For each animal, the arterial input function (AIF) was derived from the BS recording, from manual sampling (MS), and from the PET image. These AIFs were applied for kinetic modeling of the striatum using the irreversible 2-tissue-compartment model. The MS-based technique with a dispersion correction served as a reference approach, and the kinetic parameters that were estimated with the BS- and the image-derived AIFs were compared with the reference values. Additionally, the effect of applying a population-based activity ratio for plasma to whole blood (p/wb) and the dispersion correction was assessed. Results: The K1, k2, and k3 values estimated with the reference approach were 0.174 ± 0.037 mL/min/cm3, 0.342 ± 0.080 1/min, and 0.048 ± 0.009 1/min, respectively. The corresponding parameters obtained with the BS- and image-derived AIFs deviated from these values by 0.6%–18.8% and 16.7%–47.9%, respectively. To compensate for the error in the BS-based technique, data from one MS collected at the end of the experiment were combined with the data from the first 10 min of the BS recording. This approach reduced the deviation in the kinetic parameters to 1.8%–6.3%. Using p/wb led to a 1.7%–8.3% difference from the reference parameters. The sensitivity of the BS was 23%, the energy resolution for the 511-keV photopeak was 19%, and the timing resolution was 11.2 ns. Conclusion: Online recording of the blood activity level with the BS allows precise measurement of AIF, without loss of blood volume. Combining the BS data with one MS is the most accurate approach for the data analysis. The high sensitivity of the device may allow application of lower radioactivity doses.
Small-animal PET provides a great opportunity to advance translational research in the field of molecular imaging. With the ultimate goal of developing specific and sensitive diagnostic tools for the patient’s benefit, small-animal studies focus on developing and characterizing new PET tracers and on investigating mechanisms of human diseases (1,2). An important aspect of all preclinical studies is reliable and accurate quantification of the PET data (3,4).
Kinetic modeling allows reliable quantification (5) but requires a longer time for the acquisition of dynamic data. Moreover, recording of the arterial input function (AIF) is necessary if a reference region is not available. The AIF consists of the time–activity curve of the PET tracer level in plasma (p) and whole blood (wb). The gold standard for acquiring AIF relies on manual sampling (MS) of blood. This, however, is challenging in small animals because the loss of blood volume affects physiologic stability (6).
Yet another difficulty is to accurately capture the peak activity after a bolus injection. Missing the peak may adversely influence the obtained kinetic parameters (KPs). Therefore, the use of a blood sampler (BS) with an arterial–venous shunt has been proposed (6). With this approach, the blood circulates in a closed system and the high sampling rate ensures accurate recording of the peak activity.
Although several BS devices have been described (7–10), only one currently available device (Twilite Two; Swisstrace) is compatible with MRI scanners, enabling the recording of AIF in PET/MRI studies (11,12). The compatibility is achieved by separation of the scintillation crystals from the photomultiplier tubes by a long optical fiber. However, this approach is known to degrade the PET signal because of severe light loss due to the optical fiber (13).
Alternatively, avalanche photodiodes, which are compact and can be operated in the magnetic field, may replace photomultiplier tubes (14). Although the active area is smaller and the signal-to-noise ratio worse in avalanche photodiodes than in photomultiplier tubes, coupling them directly to cerium-doped lutetium oxyorthosilicate crystals compensates the signal-to-noise ratio, ensuring high sensitivity (15).
A prototype BS with the avalanche photodiode/lutetium oxyorthosilicate–based design has been developed for clinical PET/MRI applications (15). However, the dimensions of this device are not suitable for use in rodents. Therefore, the goal of our work was to build and test a similar BS dedicated to small-animal studies. Specifically, we used the BS to evaluate the impact of the AIF recording method on KPs in rats. Moreover, the effect of applying a population-based p/wb activity ratio to calculate the AIF was assessed.
MATERIALS AND METHODS
BS
The BS (Supplemental Fig. 1; supplemental materials are available at http://jnm.snmjournals.org) was based on the prototype device whose design and performance evaluation have been previously described (15). In the present device, 2 3 × 4 × 5 cm lutetium oxyorthosilicate blocks are attached to two 10 × 10 mm avalanche photodiodes, and a catheter is led between the detectors. Please refer to the supplemental materials or contact the authors for more details on the device.
Nine calibration measurements ware performed before the in vivo experiments. First, the activity of an 18F-FDG solution (3–4 MBq/mL) was measured in a well-counter (Capintec Inc.). Subsequently, a 20-cm-long catheter (low-density polyethylene; inner diameter, 0.4 mm; outer diameter, 0.8 mm [Reichelt Chemietechnik GmbH]) filled with this solution was placed in the BS and a 5- to 6-min recording was taken. The sensitivity was expressed as the ratio of the measured mean count rate (corrected for the increased background of lutetium oxyorthosilicate crystals and for the decay) to the expected count rate.
The energy window for all measurements was 350–1,000 keV.
Animals
Animal procedures followed standards for the care and use of laboratory animals and were approved by the local Animal Welfare and Ethics Committee of the Country Commission, Tuebingen, Germany (animal license R2/16). Five Lister hooded male rats (330–370 g; Charles River Laboratories) were kept in individually ventilated cages with free access to food and water until the time of the experiment. The temperature and humidity in the vivarium were 22°C ± 1°C (mean ± SD) and 55% ± 1%, respectively.
Experimental Protocol
An isoflurane–oxygen mixture (CP-Pharma Handelsgesellschaft mbH) was used for anesthesia (2.5% for induction, 1.7% for maintenance), and fentanyl (Fentadon; Albrecht GmbH) was used for analgesia (5 μg/kg, intraperitoneally). A 20-cm catheter was inserted into the tail vein, and 1 mL of heparinized normal saline was administered.
Subsequently, a catheter was inserted into the right femoral artery for later MS, and an arterial–venous shunt was inserted into the contralateral femoral artery and vein. The shunt, which passed through the BS and a peristaltic pump (Ismatec REGLO-Digital; Cole-Parmer GmbH), (Supplemental Fig. 2) comprised 3 pieces: arterial (40 cm), middle (30 cm), and venous (25 cm). The arterial and venous pieces, as well as the MS and tail vein catheters, were made of the same tubing as was used for the sensitivity measurement. The middle piece was a Tygon tube (inner diameter, 0.44 mm; outer diameter, 2.26 mm [Ismatec]). The pieces were joined by 1.5-cm-long steel connectors (inner diameter, 0.3; outer diameter, 0.63 mm [Ismatec]). The length from the arterial end of the shunt to the center of the BS field of view was the same as the length of the MS catheter (25 cm).
Body temperature was monitored with a rectal probe, and breathing rate was monitored visually every 15–20 min. 18F-FDG (54–75 MBq) in normal saline was administered via the tail vein catheter with an infusion pump (0.5 mL over 25 s), directly followed by 0.1 mL of normal saline infused over 5 s. The pump, the BS recording, and the PET acquisition were started simultaneously. MS began 3 s earlier and continued until 75 s. Each sample of 3 blood drops (∼75 μL) was collected in a capillary tube (Microvette CB 300 LH; Sarstedt). The number of samples collected over the MS period was used to estimate the flow rate in the MS catheter. Subsequent samples were taken at 3, 6, 10, 15, 25, 40, and 60 min. From each sample, 10 μL of the wb and 10 μL of the separated p (centrifugation: 4,000 rpm, 5 min, 5°C, 25-cm diameter) were measured with a γ-counter (2480 WIZARD2; Perkin Elmer).
At the end of the experiment, the venous piece of the shunt was cut and the blood flowing out was collected into 2 Eppendorf tubes, each time for 30 s. These volumes were measured to calculate the mean flow rate in the shunt. Finally, the animal was sacrificed with CO2.
After each experiment, the BS was cross-calibrated with the well-counter. Moreover, the background activity was recorded and later subtracted from the BS dataset. The BS data were also decay-corrected.
PET
A small-animal PET scanner (Inveon; Siemens Healthineers) and an Inveon Acquisition Workplace (version 1.5.0.28; Siemens Healthineers) were used for a 60-min PET acquisition, followed by a 10-min transmission scan performed with a rotating 57Co source. Normalization was applied, as well as corrections for decay, dead time, and attenuation. The images were reconstructed with a filtered backprojection algorithm using the following framing: 18 × 5 s, 1 × 30 s, 3 × 60 s, 1 × 180 s, 1 × 120 s, 1 × 300 s, and 3 × 900 s. The images were subsequently analyzed with PMOD software (version 3.2; PMOD Technologies LCC). A 24-mm3 volume of interest was drawn on the left ventricle (Supplemental Fig. 3) to obtain the image-derived AIF.
Delay and Dispersion
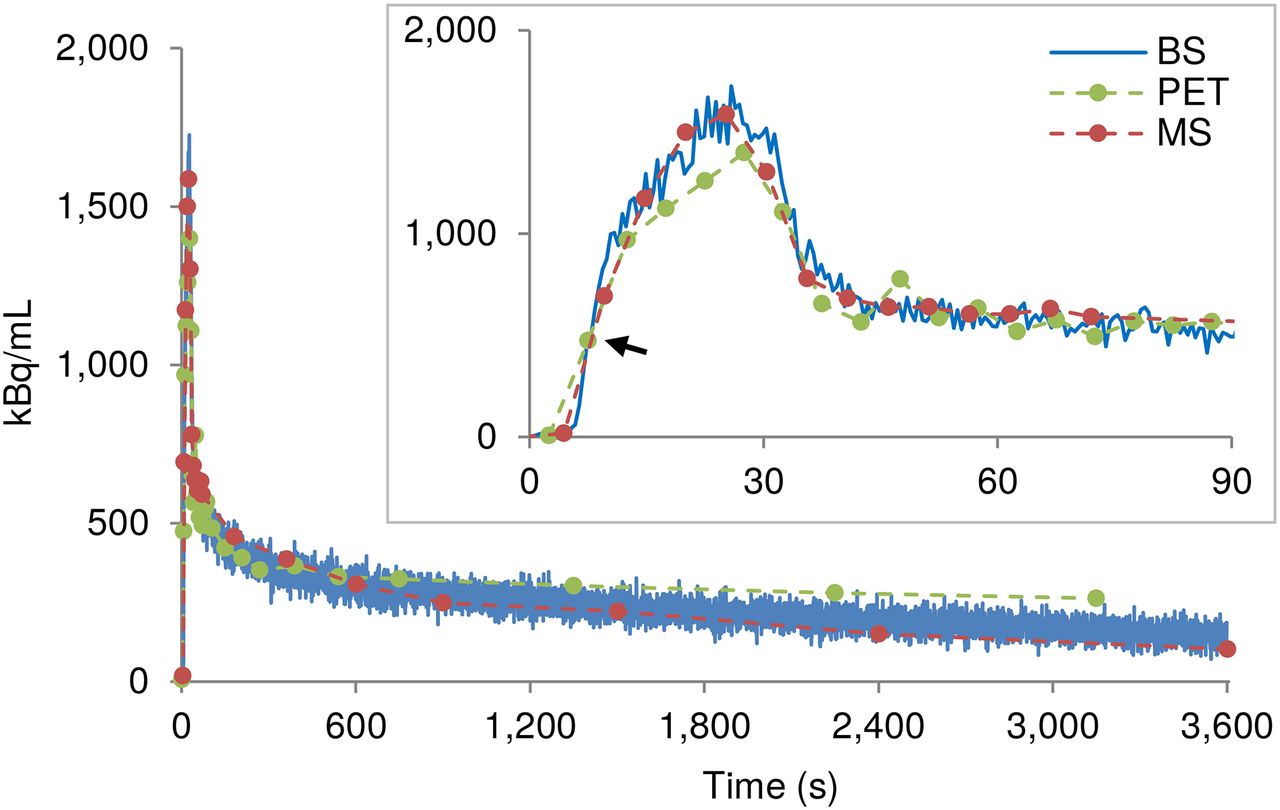
For each animal, the obtained MS and BS wb time–activity curves were shifted on the time axis such that they overlaid the first-above-baseline data point on the PET time–activity curve (Fig. 1). The average shift of the BS time–activity curves for the 5 rats was considered the delay of the system.

Example wb time–activity curves recorded by BS, MS, and PET in one rat. MS and BS time–activity curves were shifted on time axis to match first-above-baseline data point (arrow) of PET time–activity curve.
To estimate the dispersion factor (16), an in vitro measurement based on a previously proposed design (17) was performed using human venous blood (Supplemental Figs. 4 and 5). The obtained dispersion factor was used to model the impulse response function (IRF) of the system as a monoexponential function (16):  , where t is time and τ is the dispersion factor. This IRF was normalized to obtain a unit area under the curve (Supplemental Fig. 6), and the normalized IRF was used to deconvolve the MS and BS time–activity curves, as described in the next section.
AIF
For each rat, the AIF was obtained in 9 ways.
AIF from MS
The activity of MS wb and p was used as the AIF.
AIF from Fitted MS (MS-fit)
The original wb and p data were fitted using a previously described procedure (18) to remove the noise, which was necessary for the subsequent application of the dispersion correction. The obtained fits ( and
and  ) were used as the AIF to verify whether the fitting procedure itself would influence the KPs.
AIF from Fitted and Dispersion-Corrected MS (MS-fit-dc)
The normalized IRF was used to deconvolve the  and the
  obtained previously. The outcome of the deconvolution (
 and
and  ) was used as the AIF. This approach was considered the reference throughout the study.
AIF from Fitted and Dispersion-Corrected MS Calculated Using p/wb (MS-fit-dc-calc)
A biexponential function has been shown to accurately describe p/wb for 18F-FDG in rats (6). Hence, for each rat the ratio was first calculated using his original p and wb data: where t denotes time and A–E are the fit coefficients.
To avoid a strong weighting by the first 78 s of data when many samples were collected, only the first-above-baseline (i.e., >10 kBq/mL) and last sample from this period were used (Fig. 2). Subsequently, the A–E coefficients of all 5 rats were averaged, providing group mean values, Am–Em (Am = 0.418, Bm = 0.002, Cm = 0.214, Dm = 0.146, Em = 1.245). They were used to calculate p values from the wb data: The
The  and the calculated p values were used as the AIF. This procedure served to evaluate the effect of using the population-based p/wb.
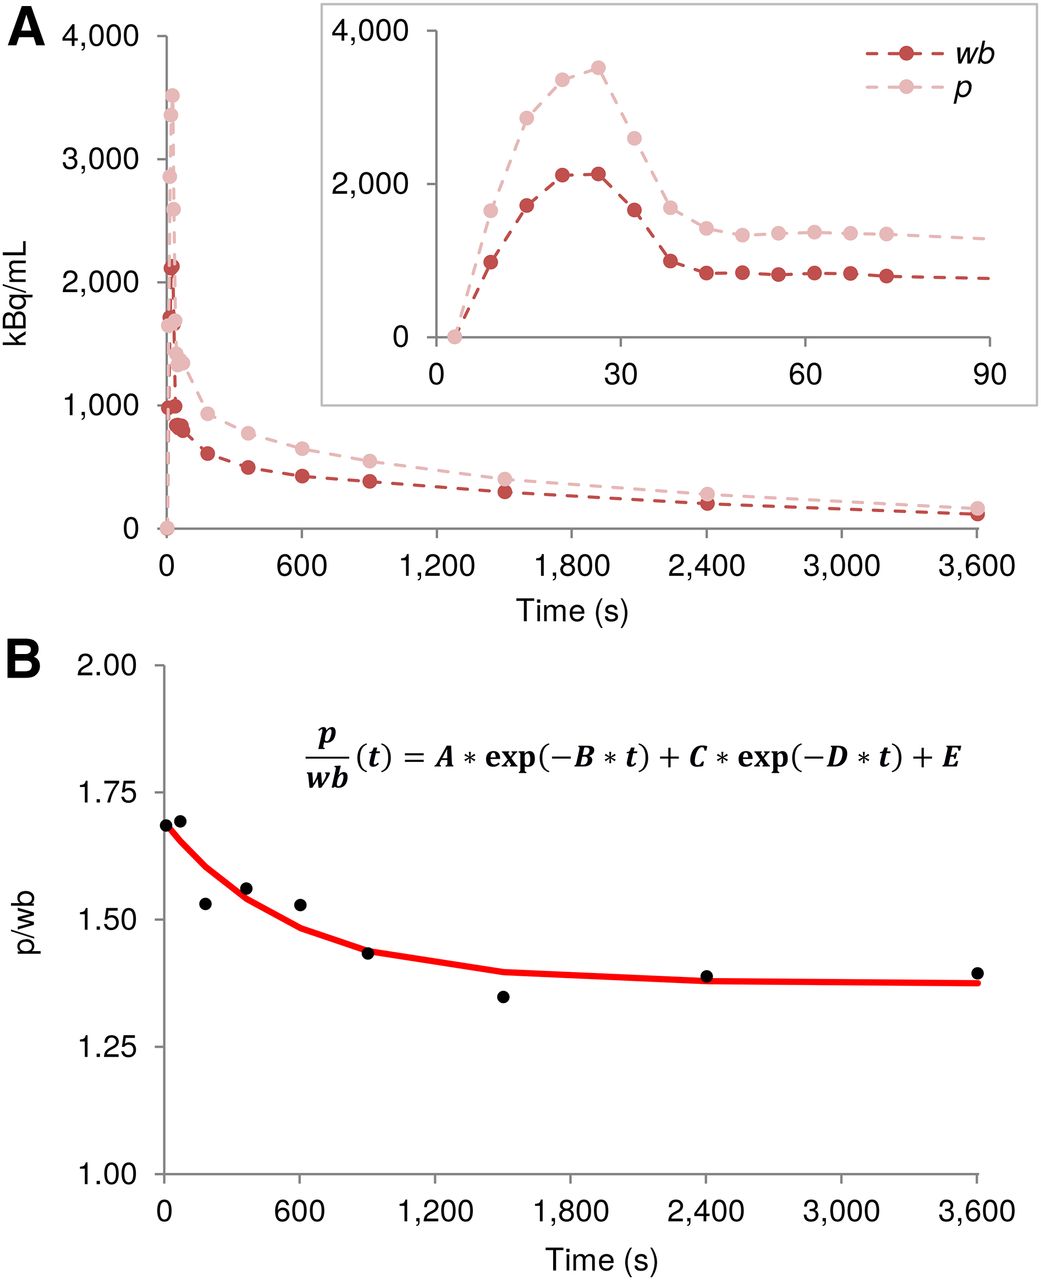
(A) Example MS wb and p time–activity curves. (B) p/wb calculated from samples shown in A (●) and biexponential fit to these data (curve).
AIF from BS Data (BS-calc)
The p values were calculated from the recorded BS wb data: The original
  data and the calculated p values were used as the AIF.
AIF from Fitted BS Data (BS-fit-calc)
Analogically to the MS data, the  was fitted with the previously mentioned method (18). The obtained
  was used to calculate the p values:
 The
The  and the obtained p values were used as the AIF.
AIF from Fitted and Dispersion-Corrected BS Data (BS-fit-dc-calc)
The dispersion correction was applied to the  in the same way as to the
  . The outcome (
 ) was subsequently used to calculate the p values:
AIF from PET Image (ID-calc)
The wb time–activity curve from the left ventricle  was used to calculate the p values:
 The resultant p values and the
  were used as the AIF.
AIF from Fitted and Dispersion-Corrected Combination of BS and MS Data (BSMS-fit-dc-calc)
The first 10 min of the BS recording was combined with one MS at 60 min. The combined data were fitted as previously (18), and the obtained  was corrected for dispersion (
 ). Then, the p values were calculated:
Kinetic Modeling
Kinetic modeling of the right striatum (44 mm3, Supplemental Fig. 7) was performed with PMOD. The irreversible 2-tissue-compartment model assuming no dephosphorylation of FDG-6-phosphate (k4 = 0) (19) was used. The blood volume in the brain was fixed at 5%. Therefore, only K1, k2, and k3 had to be estimated. No metabolite correction was applied. The estimated KPs were compared with the KPs obtained using the MS-fit-dc approach.
RESULTS
System Performance
The detection sensitivity of the BS was 23% ± 1%, and the energy resolution was 19% for the 511-keV photopeak with the timing resolution of 11.2 ns.
The flow rate was 1.2 ± 0.4 mL/min in the MS catheter and 1.2 ± 0.1 mL/min in the shunt.
The delay in the shunt was 1.7 ± 0.6 s. The mean dispersion factor assessed in the in vitro measurements was 1.94 ± 0.38 (Supplemental Table 1).
Physiologic Parameters
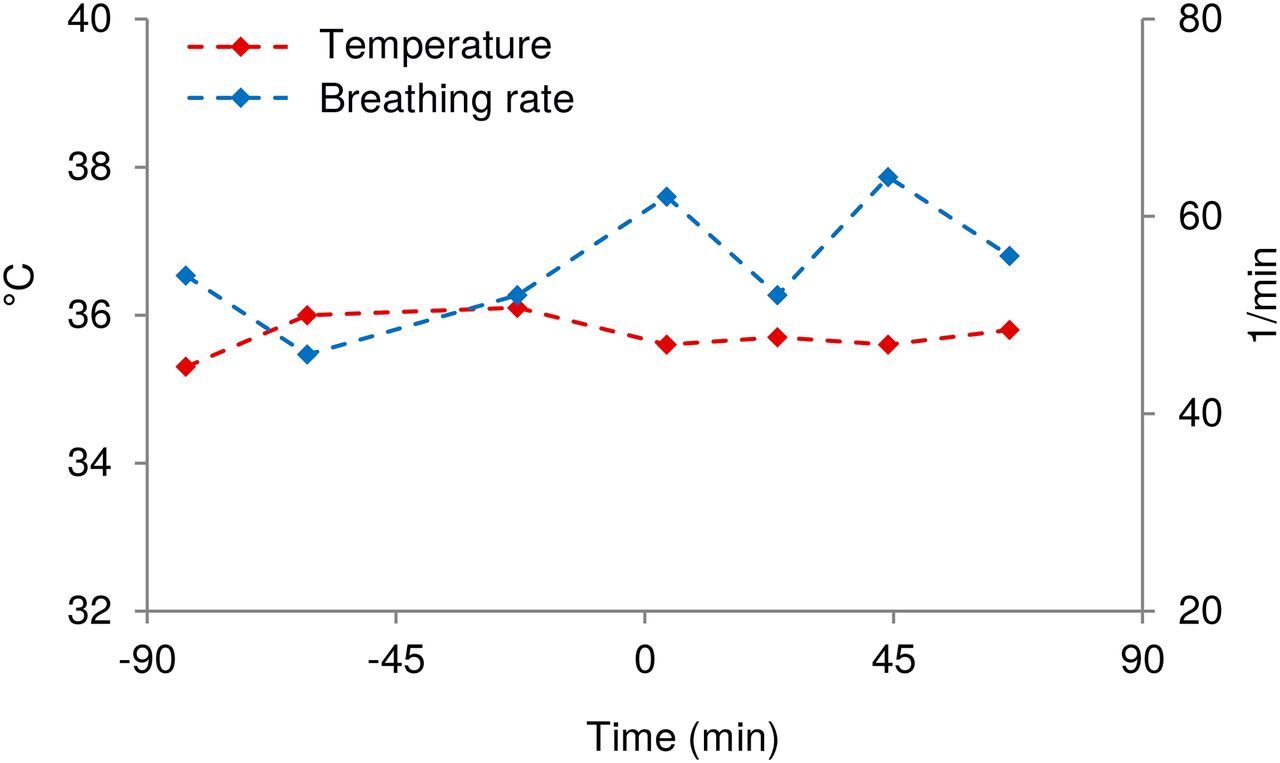
Temperature and breathing rate were stable throughout the experiment (Supplemental Table 2). An example is shown in Figure 3.

Physiologic parameters of one rat. Body temperature and breathing rate were monitored from moment of anaesthetizing animal until end of experiment. Tracer was injected at 0 min.
wb Time–Activity Curves
The MS, BS, and PET wb time–activity curves agreed well. However, the PET time–activity curve was always the lowest in amplitude during the first 30 s. After approximately 10 min, it rose above the BS and MS values, and this effect remained until the end of the measurement. Moreover, the BS time–activity curve tended to show slightly higher values than the MS time–activity curve in the second half of the experiment (Fig. 1).
On the basis of visual inspection, the fitting procedure for the MS and BS data performed well (Fig. 4).
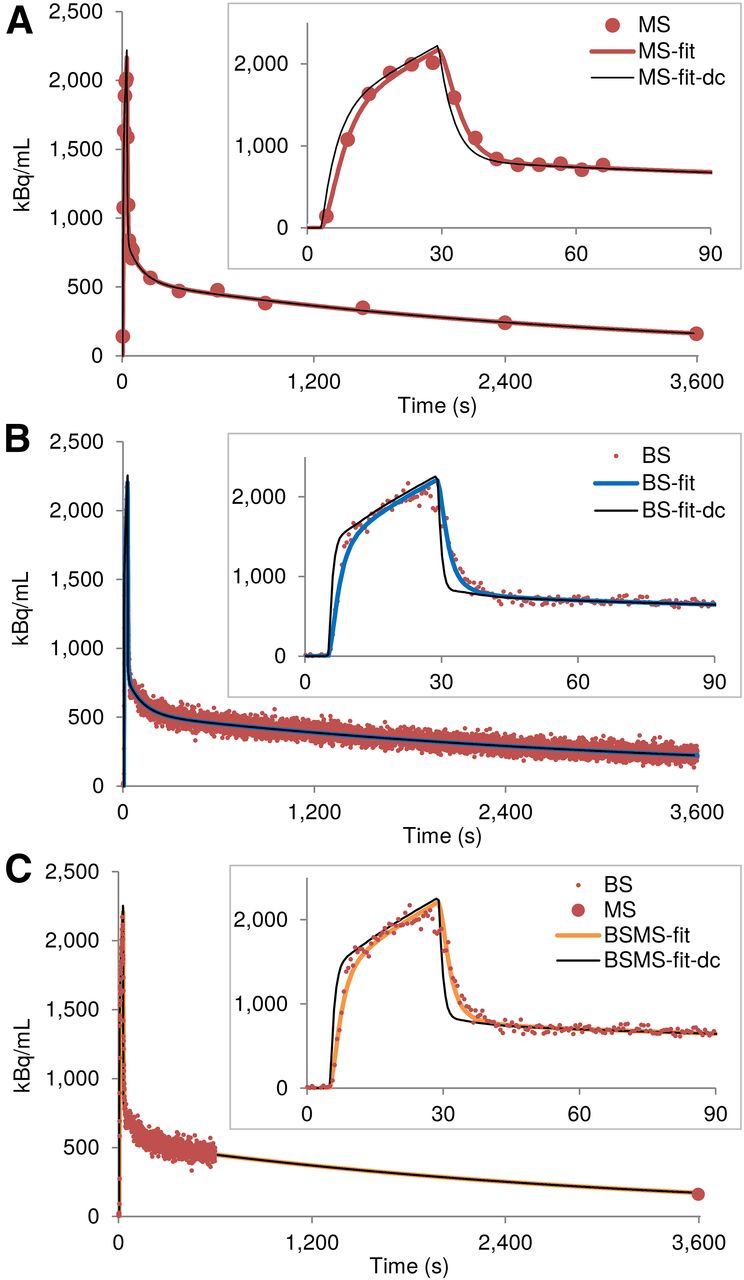
Fitting of wb time–activity curves and dispersion correction. (A) Example MS wb time–activity curve, MS-fit, and MS-fit-dc. (B) For same animal, BS wb time–activity curve, BS-fit, and BS-fit-dc. (C) BSMS-fit and BSMS-fit-dc.
Kinetic Modeling
The KPs estimated with the AIF obtained in 9 different ways are presented in Table 1, Supplemental Table 3, and Supplemental Figure 8. Using the original MS data as the AIF resulted in a K1 of 0.186 ± 0.036 mL/min/cm3, a k2 of 0.370 ± 0.085 1/min, and a k3 of 0.048 ± 0.009 1/min. Fitting the AIF had only a small effect on the KPs, changing K1 to 0.179 ± 0.039 mL/min/cm3, k2 to 0.358 ± 0.085 1/min, and k3 to 0.049 ± 0.009 1/min. When the dispersion correction was applied, these values dropped by 2.9%, 4.7%, and 2.1%, respectively.
KPs Estimated Using AIF Obtained with 9 Different Methods
Using p/wb to obtain the AIF from the fitted and dispersion-corrected MS data increased the mean K1 and k2 by approximately 2% compared with the reference values, whereas the mean k3 rose by 8.3%.
The mean K1 and k2 estimated with the AIF derived from the original BS data were comparable to the respective parameters obtained using the AIF from the original MS measures (0.189 ± 0.030 mL/min/cm3 and 0.350 ± 0.057 1/min, respectively). However, the mean k3 dropped by 14.6%.
The AIF fitting procedure had an even smaller effect on the BS data than on the MS data. The mean K1 did not change, and the mean k2 and k3 rose by 1.7% and 2.1%, respectively. Applying the dispersion correction reduced the mean K1, k2, and k3 by 3.4%, 5.9%, and 6.3%, respectively.
To correct for the discrepancy in k3 estimated with the BS-fit-dc-calc approach and the reference approach, the first 10 min of the BS recording were combined with one MS, which was then fitted and dispersion-corrected to derive the AIF. The KPs estimated with this approach deviated from the respective reference values by only 1.8%–6.3%.
Finally, the differences between the mean KPs estimated with the image-derived AIF and the reference KPs were 24.1% for K1, 16.7% for k2, and −47.9% for k3.
DISCUSSION
The present work demonstrated an implementation of the highly sensitive BS in a routine small-animal PET study. Specifically, we used the device to evaluate the impact of differently acquired AIFs on the estimated KPs. Additionally, the effects of fitting the AIF, applying the dispersion correction, and using a population-based p/wb activity ratio were evaluated.
The advantages of using the online BS shunt system with a high sampling rate in small-animal PET include accurately capturing the peak activity (20); avoiding blood loss, which is crucial not only in mouse studies but also even in rats (6), and avoiding removal of the PET tracer under investigation from the system while its level is being measured.
The BS used in this study provides additional benefits. The MR compatibility allows for simultaneous PET/MRI measurements, providing more detailed and complementary information about physiologic processes (2,12). Furthermore, the high sensitivity (23%) may allow reduction of the injected activity dose. Finally, using similar devices in preclinical and clinical experimental setups may facilitate translational research.
One limitation of using the BS recording is that the p/wb radioactivity distribution over time needs to be known. Obtaining this information requires MS but can be done in a separate group of animals. Then, calculating the p activity from the BS data assumes that the ratio is the same in both groups. In our study, use of the measured p values and the p values calculated from MS wb with the group mean coefficients in the same animals resulted in the following deviations from the reference KPs: 1.7% for K1, 2.0% for k2, and 8.3% for k3. These differences might be higher for a separate group of animals. Thus, if the population-based approach is used, it should be applied to all experimental groups.
Because the animals in our study were not kept fasting before the measurements, and a blood volume of 5% was assumed for kinetic modeling (whereas 6% may be more accurate (21)), the obtained KPs may not be comparable with some results available in the literature. However, the main interest of the present work was to investigate differences in KPs estimated using AIFs acquired in different ways.
The wb time–activity curves recorded by the BS were similar to those measured by MS, especially right after tracer administration. This similarity was reflected in the similar mean K1 and k2 in the MS- and BS-based estimates. The differences were in the 5% range, which still encompassed the approximately 2% deviation that resulted from applying p/wb. However, in the later stages of each measurement, wb activity was overestimated by the BS compared with MS, resulting in underestimation of k3.
The overestimation in the BS time–activity curve was most probably caused by adhesion of blood to the inside walls of the shunt. Although this effect was not strong in our 18F-FDG study and could be solved by combining the first 10 min of the BS data with only one MS, using a more lipophilic tracer might lead to larger deviations in the kinetic parameters which depend mostly on the late phase of the recording. In such cases, polytetrafluoroethylene tubing could be used (10).
Additionally, despite heparinizing the animal, blockage of the blood flow in the shunt may sporadically occur, as happened once in our study. In such a case, the shunt needs to be opened and flushed, and the affected data should be removed from the analysis. Because blockage of blood flow in the shunt is more probable in later phases of the experiment, use of only the first 10 min of the BS recording would be beneficial.
Although we did not apply sophisticated techniques for deriving the AIF from a PET image, a basic approach of this type was used for comparison. It resulted in high deviations of the KPs from the reference values, reaching almost 48% for k3. This is a known consequence of a gradual accumulation of 18F-FDG in the myocardium and the subsequent spillover effect in the left ventricle (22). Additionally, because of the partial-volume effect (3,23), the wb time–activity curve was underestimated during the first minute of the acquisition, leading to incorrect K1 and k2 values. Although methods have been developed to correct for both effects (22,24), and use of iterative reconstruction algorithms could improve the image quality, a direct measurement of the radioactivity level in the blood remains the most reliable method. Moreover, in some studies the animal’s heart may not be covered in the image, thus making derivation of the AIF impossible. Such would be the case in studies using a dedicated scanner for brain imaging (25). Therefore, an online radioactivity recording with a BS will remain an important tool in small-animal PET.
CONCLUSION
We have established an experimental protocol for PET with an online radioactivity recording using a BS in rats. The acquired time–activity curves closely resembled the time–activity curves obtained by the gold standard MS method. Accordingly, the KPs estimated with the BS-derived AIF agreed well with the reference values, although combining the first 10 min of the BS data with one MS provided the most accurate results.
Fitting the recorded AIF with the previously proposed method (18) allowed correction for dispersion by deconvolution with the IRF of the system. This fitting procedure had only a minor impact on the KPs. However, using the p/wb activity ratio to obtain p values from the wb recording may affect the KPs.
The exceptionally high sensitivity of the device (23%) will be crucial for reducing radioactivity doses in PET experiments and for performing studies using short-lived isotopes.
DISCLOSURE
This research received funding from the European Union Seventh Framework Program (FP7/2007-2013) under grant agreement 602646 and from the German Research Foundation (PI 771/3-1). No other potential conflict of interest relevant to this article was reported.
Acknowledgments
We acknowledge Dr. Johannes Breuer, Dr. Geoffrey Warnock, Sandro Aidone, Prof. Adriaan Lammertsma, Dr. Masqsood Yaqub, and the Radiochemistry Group of the Werner Siemens Imaging Center.
Footnotes
Published online Feb. 23, 2018.
- © 2018 by the Society of Nuclear Medicine and Molecular Imaging.
REFERENCES
- Received for publication October 24, 2017.
- Accepted for publication January 25, 2018.


Jump to section
Related Articles
Cited By...
- No citing articles found.