


Abstract
Reference databases of pediatric brain metabolism are uncommon, because local brain metabolism evolves significantly with age throughout childhood, limiting their clinical applicability. The aim of this study was to develop mathematic models of regional relative brain metabolism using pediatric 18F-FDG PET with CT data of normal pediatric brains, accounting for sex and age. Methods: PET/CT brain acquisitions were obtained from 88 neurologically normal subjects, aged 6 mo to 18 y. Subjects were assigned to either a development group (n = 59) or a validation group (n = 29). For each subject, commercially available software was used to quantify the relative metabolism of 47 separate brain regions using whole-brain–normalized (WBN) and pons-normalized (PN) activity. The effects of age on regional relative brain metabolism were modeled using multiple linear and nonlinear mathematic equations, and the significance of sex was assessed using the Student t test. Optimal models were selected using the Akaike information criterion. Mean predicted values and 95% prediction intervals were derived for all regions. Model predictions were compared with the validation dataset, and mean predicted error was calculated for all regions using both WBN and PN models. Results: As a function of age, optimal models of regional relative brain metabolism were linear for 9 regions, quadratic for 13, cubic for 6, logarithmic for 12, power law for 7, and modified power law for 2 using WBN data and were linear for 9, quadratic for 25, cubic for 2, logarithmic for 6, and power law for 4 using PN data. Sex differences were found to be statistically significant only in the posterior cingulate cortex for the WBN data. Comparing our models with the validation group resulted in 94.3% of regions falling within the 95% prediction interval for WBN and 94.1% for PN. For all brain regions in the validation group, the error in prediction was 3% ± 0.96% using WBN data and 4.72% ± 1.25% when compared with the PN data (P < 0.0001). Conclusion: Pediatric brain metabolism is a complex function of age and sex. We have developed mathematic models of brain activity that allow for accurate prediction of regional pediatric brain metabolism.
It is well known that normal pediatric brain development is characterized by significant age- and sex-related variations in local metabolism (1–10) that can render the visual interpretation of clinical brain 18F-FDG PET studies in children challenging, with normal variations in local metabolism potentially confounding pathologic changes.
It is common practice in the interpretation of adult brain PET studies to compare results with reference databases, a technique that has been shown to increase diagnostic accuracy for both focal lesions and neurodegenerative conditions (11–14). This technique has met with moderate success in the case of pediatric studies, for which the availability of reference pediatric databases is limited. This limitation is largely due to two factors. The first is that, because of ethical concerns, dedicated brain PET studies are rarely performed on healthy pediatric patients, severely limiting the ability to develop reference databases. The second is that local brain metabolism evolves drastically throughout childhood, so that no single reference database would be applicable throughout the pediatric age range. This issue can be mitigated by dividing the pediatric age range into several narrow age intervals (e.g., 0–1 y, 2–3 y, and 4–5 y), each with a separate, age-appropriate reference database; however, in light of the first restriction, and the need to have statistically significant numbers in each reference database, such an approach would likely be prohibitive.
In contrast to the use of reference databases, an alternate approach is possible. To date, a few studies have developed age- and sex-dependent mathematic models of local brain metabolism (4,6,9,10). Some of these models have used dedicated brain studies (3,4,7) or the brain component of whole-body PET studies on patients without central nervous system disease (studies that do not show central nervous system involvement or neurologic symptoms) (6,9), whereas others have used dedicated brain PET studies of patients with epilepsy (1,10). Using the results of brain 18F-FDG PET in neurologically intact patients of varying age and sex, mathematic models can be developed that predict normal local brain metabolism. Compared with databases, models have the advantage of being able to interpolate results for parameters (i.e., a particular age or sex) that may not be well represented in a limited database. In other words, these models may have the potential to capture variations in metabolism due to age and sex, without the need to scan large numbers of neurologically normal pediatric patients to establish age- and sex-specific databases.
In this paper, we describe the application of commercially available software to develop mathematic models of regional relative brain metabolism using both whole-brain–normalized (WBN) and pons-normalized (PN) data. The accuracy of the models was assessed by comparing model predictions with a validation group of neurologically normal pediatric subjects.
MATERIALS AND METHODS
This retrospective study was approved by our institutional review board, and the requirement to obtain informed consent was waived.
Population
Seven hundred twenty pediatric patients referred to our institution between April 2008 and June 2017 for dedicated 18F-FDG brain PET/CT were identified through our radiologic information system. To minimize the potentially confounding effects of concomitant central nervous system disease, patient charts were reviewed to exclude patients with primary or secondary brain neoplasms, epilepsy, collagen vascular disease, neuropsychiatric symptoms such as depression and psychosis, developmental disabilities such as trisomy 21, and previous brain surgery as well as patients undergoing chemotherapy or taking medications known to interfere with brain metabolism. Most of the identified patients were excluded. The reasons were epilepsy in about 350 patients, brain tumors in about 80, collagen vascular disease in about 50, encephalitis in about 40, psychiatric disorders in about 10, thrombotic disease in about 30, and central nervous system symptoms of uncertain etiology or use of medication in the rest.
After these patients had been excluded, 88 remained: 43 boys and 45 girls, ranging from 6 mo to 18 y old. These were assigned to either a development group (n = 59) or a validation group (n = 29). We tested for significant differences between the 2 groups using the Pearson χ2 test (for sex) and the Student 2-sample t test (for age).
Imaging
Before the acquisitions, all patients fasted for a minimum of 4 h. Dextrose-containing intravenous solutions were stopped 2 h before administration of 18F-FDG. Blood glucose levels were checked before injection to ensure a level no higher than 8 mmol/L.
A 3.5–5 MBq/kg injection of 18F-FDG (minimum, 37 MBq) was given, and studies were acquired 45 min afterward for the brain and 90 min afterward for the whole body or head and neck. PET/CT was performed using a Philips Gemini 16 time-of-flight PET/CT scanner. The acquisition duration was 10 min/field of view for the dedicated brain studies, 3 min/field of view for the head-and-neck studies, and 2.5 min/field of view for the whole-body studies. The CT parameters for attenuation correction were 120 kVp, a pitch of 0.813, a rotation time of 0.5 s, a slice thickness of 5 mm, and collimation of 16 × 1.5 mm. The CT tube current was adjusted according to body weight (<45 kg, 22 mA; 46–67 kg, 33 mA; 68–90 kg, 44 mA; >91 kg, 66 mA). For patients undergoing dedicated brain studies, a current of 45 mA was used. PET images were acquired in 3-dimensional mode and were reconstructed using a row-action maximum-likelihood algorithm (3 iterations, 33 subsets).
No patients received sedation. Patients undergoing dedicated brain studies were instructed to rest while minimizing auditory and visual stimulation. Other patients were isolated in a dedicated room during the uptake period in the presence of their family and a television.
Prospective identification of head-and-neck or whole-body scans permitting extraction of brain data in patients without central nervous system disease began in October 2015.
Data Analysis
Brain PET images were analyzed using NeuroQ (Syntermed), a commercially available software package that performs automated quantitative analysis of activity in standardized volumes of interest in the brain. After upper and lower limits were defined for the brain, scalp activity was removed using the threshold set by the program, corresponding to 20% of the image counts. Slices in 3 planes (axial, coronal, and sagittal) were realigned using rigid registration. Ten iterations were used to produce elastic transformation of the patient brain data to the reference brain template. Regional relative brain metabolism was automatically quantified in 47 standardized cortical and subcortical volumes of interest, including 22 paired regions as shown in Figure 1. Both WBN and PN data were examined. Data loss prevented analysis of one patient with PN.

Overview of brain segmentation in 47 regions (22 paired) using NeuroQ. 1 = superior frontal (GFs); 2 = medial frontal (GFd); 3 = mid frontal (GFm); 4 = inferior frontal (GFi); 5 = sensorimotor (SM); 6 = superior parietal (sPL); 7 = inferior parietal (iPL); 8 = parietotemporal (PTC); 9 = Broca; 10 = superior lateral temporal (sLT); 11 = inferior lateral anterior temporal (iLAT); 12 = anterior medial temporal (MAT); 13 = inferior lateral posterior temporal (iLPT); 14 = posterior medial temporal (MPT); 15 = anterior cingulate (GCa); 16 = posterior cingulate (PCC); 17 = primary visual cortex (PVC); 18 = associative visual cortex (AVC); 19 = caudate nucleus (CN); 20 = lentiform nucleus (LN); 21 = thalamus (Th); 22 =midbrain (MB); 23 = pons (P); 24 = vermis (V); 25 = cerebellum (Cbm). (Image Courtesy of Dr. Daniel H. Silverman.)
For each of these regions, the significance of sex was examined using a 2-sample unpaired t test in GraphPad software (https://www.graphpad.com/quickcalcs/ttest1.cfm).
Multiple linear and nonlinear mathematic models were then developed for each region to determine the variation in regional relative brain metabolism with age using CurveExpertProfessional, version 2.6 (Hyams Development). The models considered were linear, quadratic, cubic, logarithmic, power law (y = axb), modified power law (y = abx), and exponential. The optimal model for each brain region was determined by use of the Akaike information criterion. For each of the 47 brain regions, the optimal model was then analyzed in SPSS24 (IBM Corp.) to obtain the mean predicted value and the 95% prediction interval as a function of age, using both the WBN and the PN data. A Microsoft Excel program was developed allowing direct transfer of NeuroQ data, sex and age, and the comparison of the mathematic model predictions to the validation group. The percentages of regions within and beyond the 95% prediction interval were calculated. The error in prediction for each region and patient was calculated as the absolute value of [(predicted value − validation data)/predicted value × 100] using the appropriate WBN and PN validation data, averaged over all validation patients for each region and defined as the regional error. The mean error in prediction was calculated as the mean of all regional errors.
Univariate comparisons between the WBN and PN validation data for the number of regions within, below, or above the 95% prediction interval and the mean errors in prediction were performed using a 2-sample paired t test.
RESULTS
Demographics
The development group included 30 boys (mean age ± SD, 9.15 ± 5.6 y) and 29 girls (9.83 ± 4.8 y), and the validation group included 13 boys (8.77 ± 5.4 y) and 16 girls (11 ± 5.4 y). There was no significant difference in age between male and female subjects in the development group (P = 0.62) or the validation group (P = 0.28), and there was no significant difference in age (P = 0.67) or sex (P = 0.59) between the development and validation groups.
In 13 patients, the brain PET slices were obtained from a dedicated brain study; in 43, from a head-and-neck acquisition; and in 32, from a whole-body acquisition. Dedicated head-and-neck acquisitions were performed more often in older patients, whereas whole-body acquisitions were more common in younger patients.
In 13 patients, the PET study was performed to evaluate neoplasms; in 34, to evaluate lymphadenopathy (including lymphoma); in 20, to evaluate fever and infection; and in the remainder, to evaluate miscellaneous indications (Supplemental Tables 1 and 2; supplemental materials are available at http://jnm.snmjournals.org).
Effect of Sex
For the WBN data, the effect of sex on local brain metabolism was not statistically significant (P = 0.13–0.95) in any region assessed, with the exception of the posterior cingulate gyri (P = 0.028 and 0.032 for the right and left, respectively). For the PN data, the effect of sex was not significant in any region (P = 0.16–0.49).
Evolution of Local Brain Metabolism with Age
In terms of age, the optimal model for the WBN data was linear in 9 regions, quadratic in 13, cubic in 6, logarithmic in 12, power law in 7, and modified power law in 2 (Table 1; Supplemental Table 3). For the PN model, the optimal dependence on age was linear in 9 regions, quadratic in 25, cubic in 2, logarithmic in 6, and power law in 4 (Table 1; Supplemental Table 4). The same model applied for the right and left sides in 14 of 22 paired regions for the WBN models and 17 for the PN models. No region demonstrated constant activity with age.
Optimal Models for All Regions Considered in Our Analysis for Both WBN and PN Data
In the frontal lobes, 4 regions were best fitted with a quadratic model using WBN, and all were best fitted with a quadratic model using PN, with a maximal ratio to whole brain or pons activity noted at around 10–12 y of age. Selected regions are demonstrated in Figure 2. In the nonquadratic models, activity increased with age with the exception of the sensorimotor cortex, which demonstrated decreasing values in the WBN model.
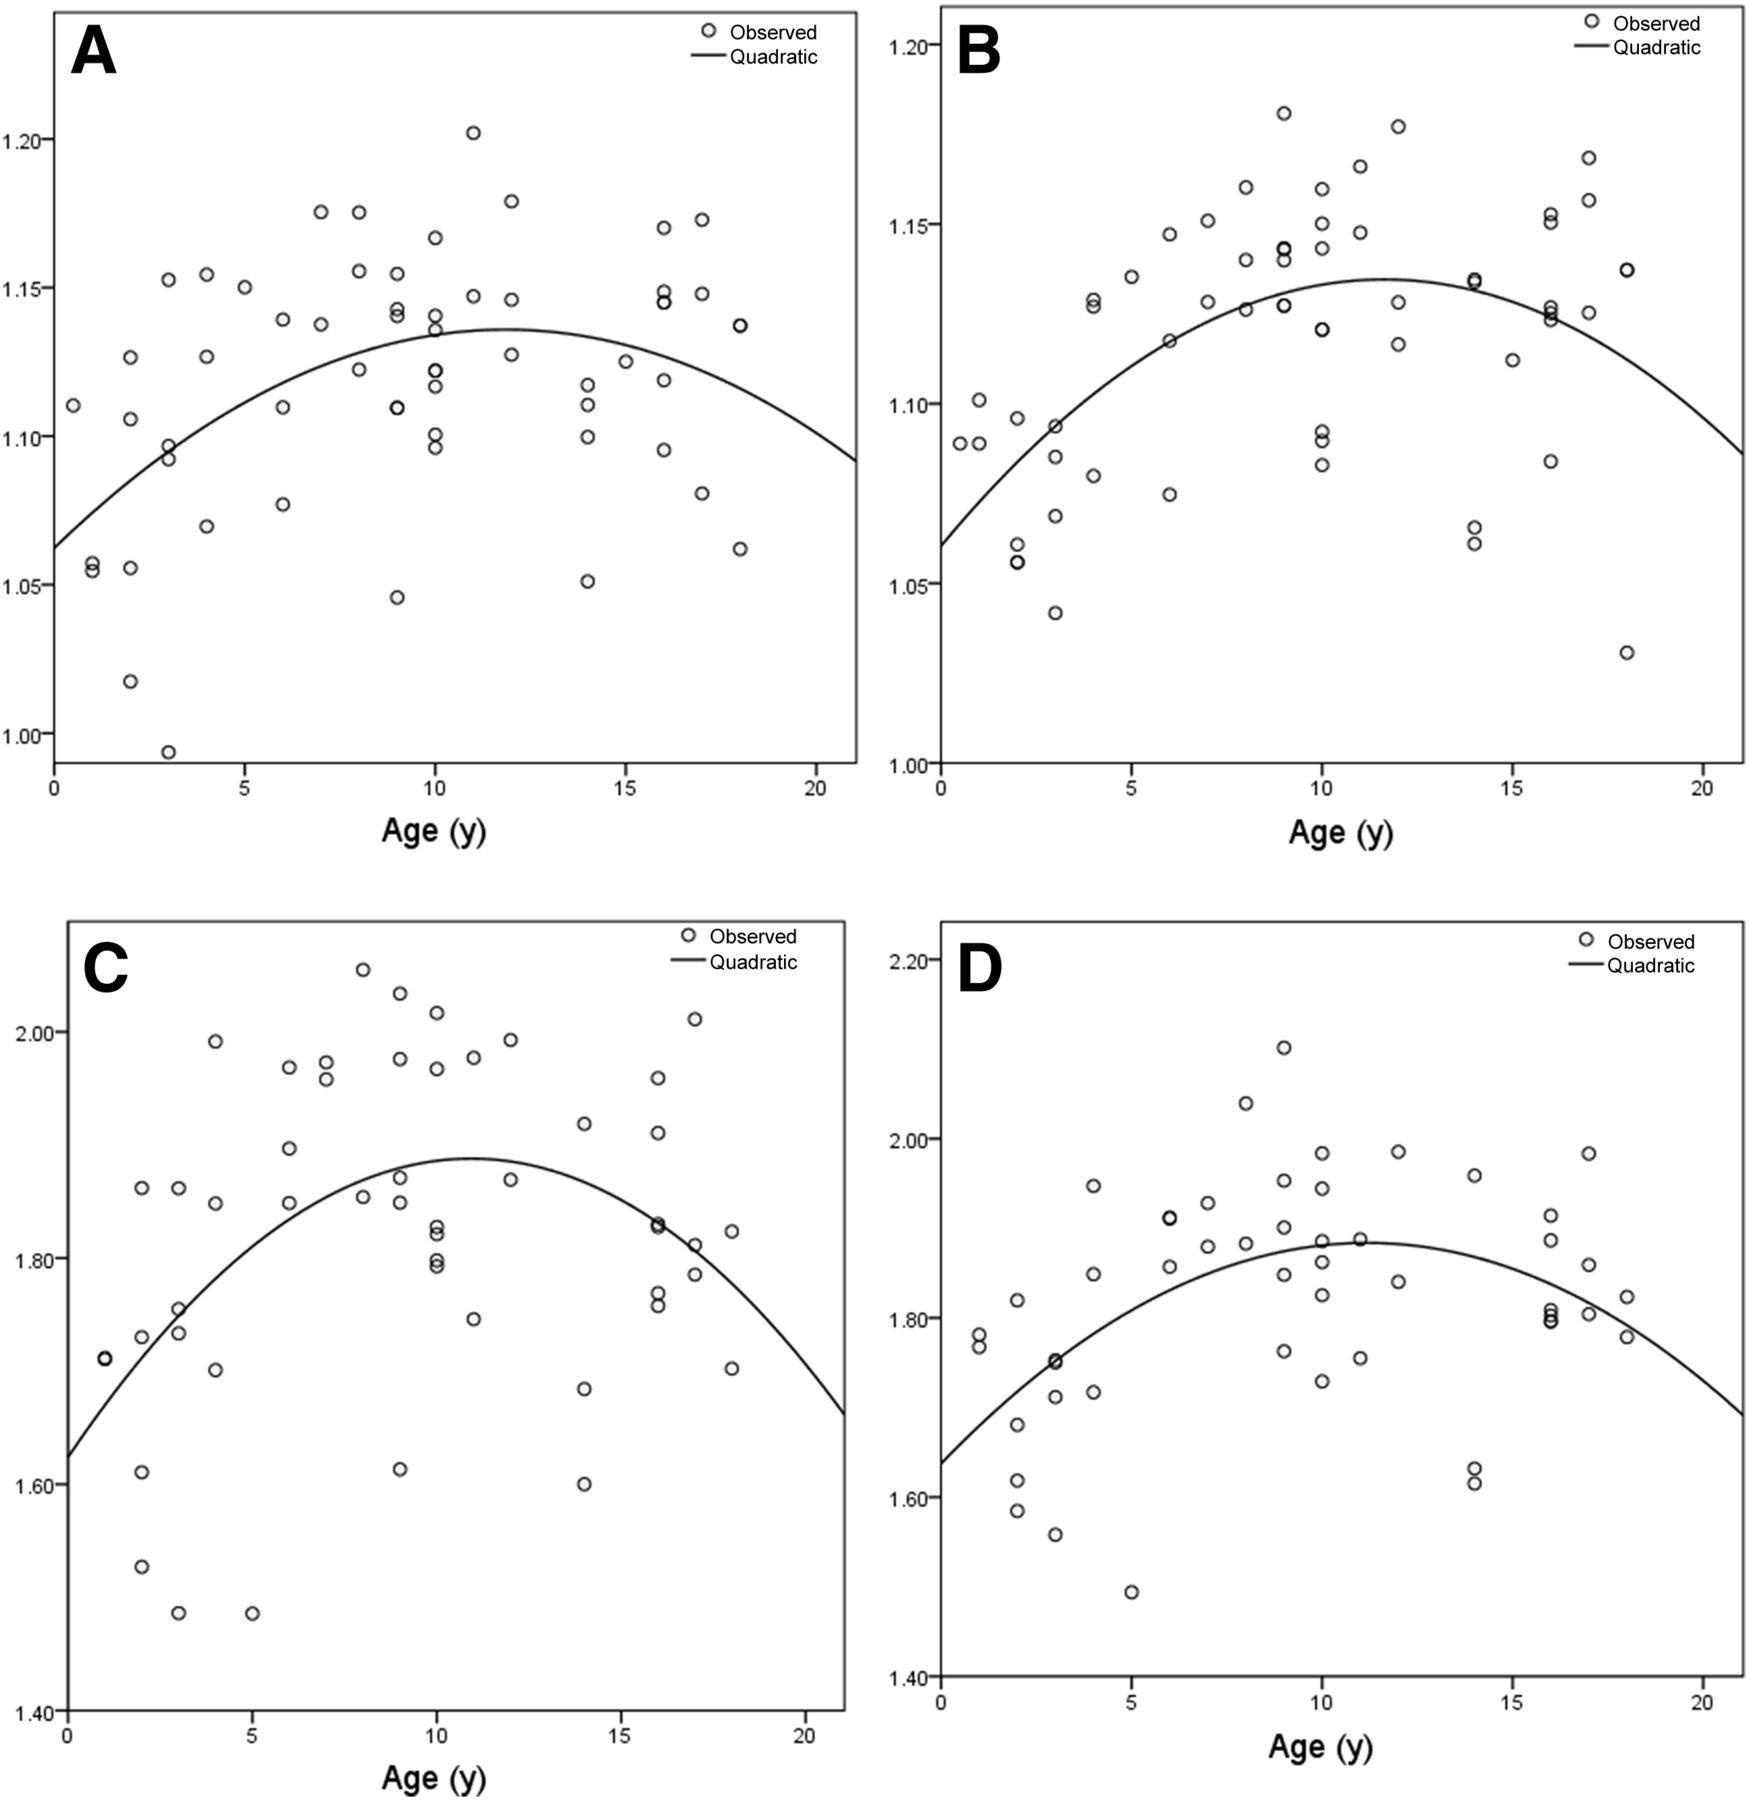
Optimal quadratic models of regional relative brain metabolism for middle frontal gyri: WBN data for right (A) and left (B) sides, and PN data for right (C) and left (D) sides.
In the parietal lobes, for the PN data 6 of the 8 models were quadratic, with these regions peaking around 10 y of age. For the WBN data, only 3 regions followed a quadratic model, with a maximum reached at 9 y of age. For the remaining regions, the ratio of activity decreased linearly as a function of age in 3 regions for WBN and in 2 for PN. Selected regions are shown in Figure 3.
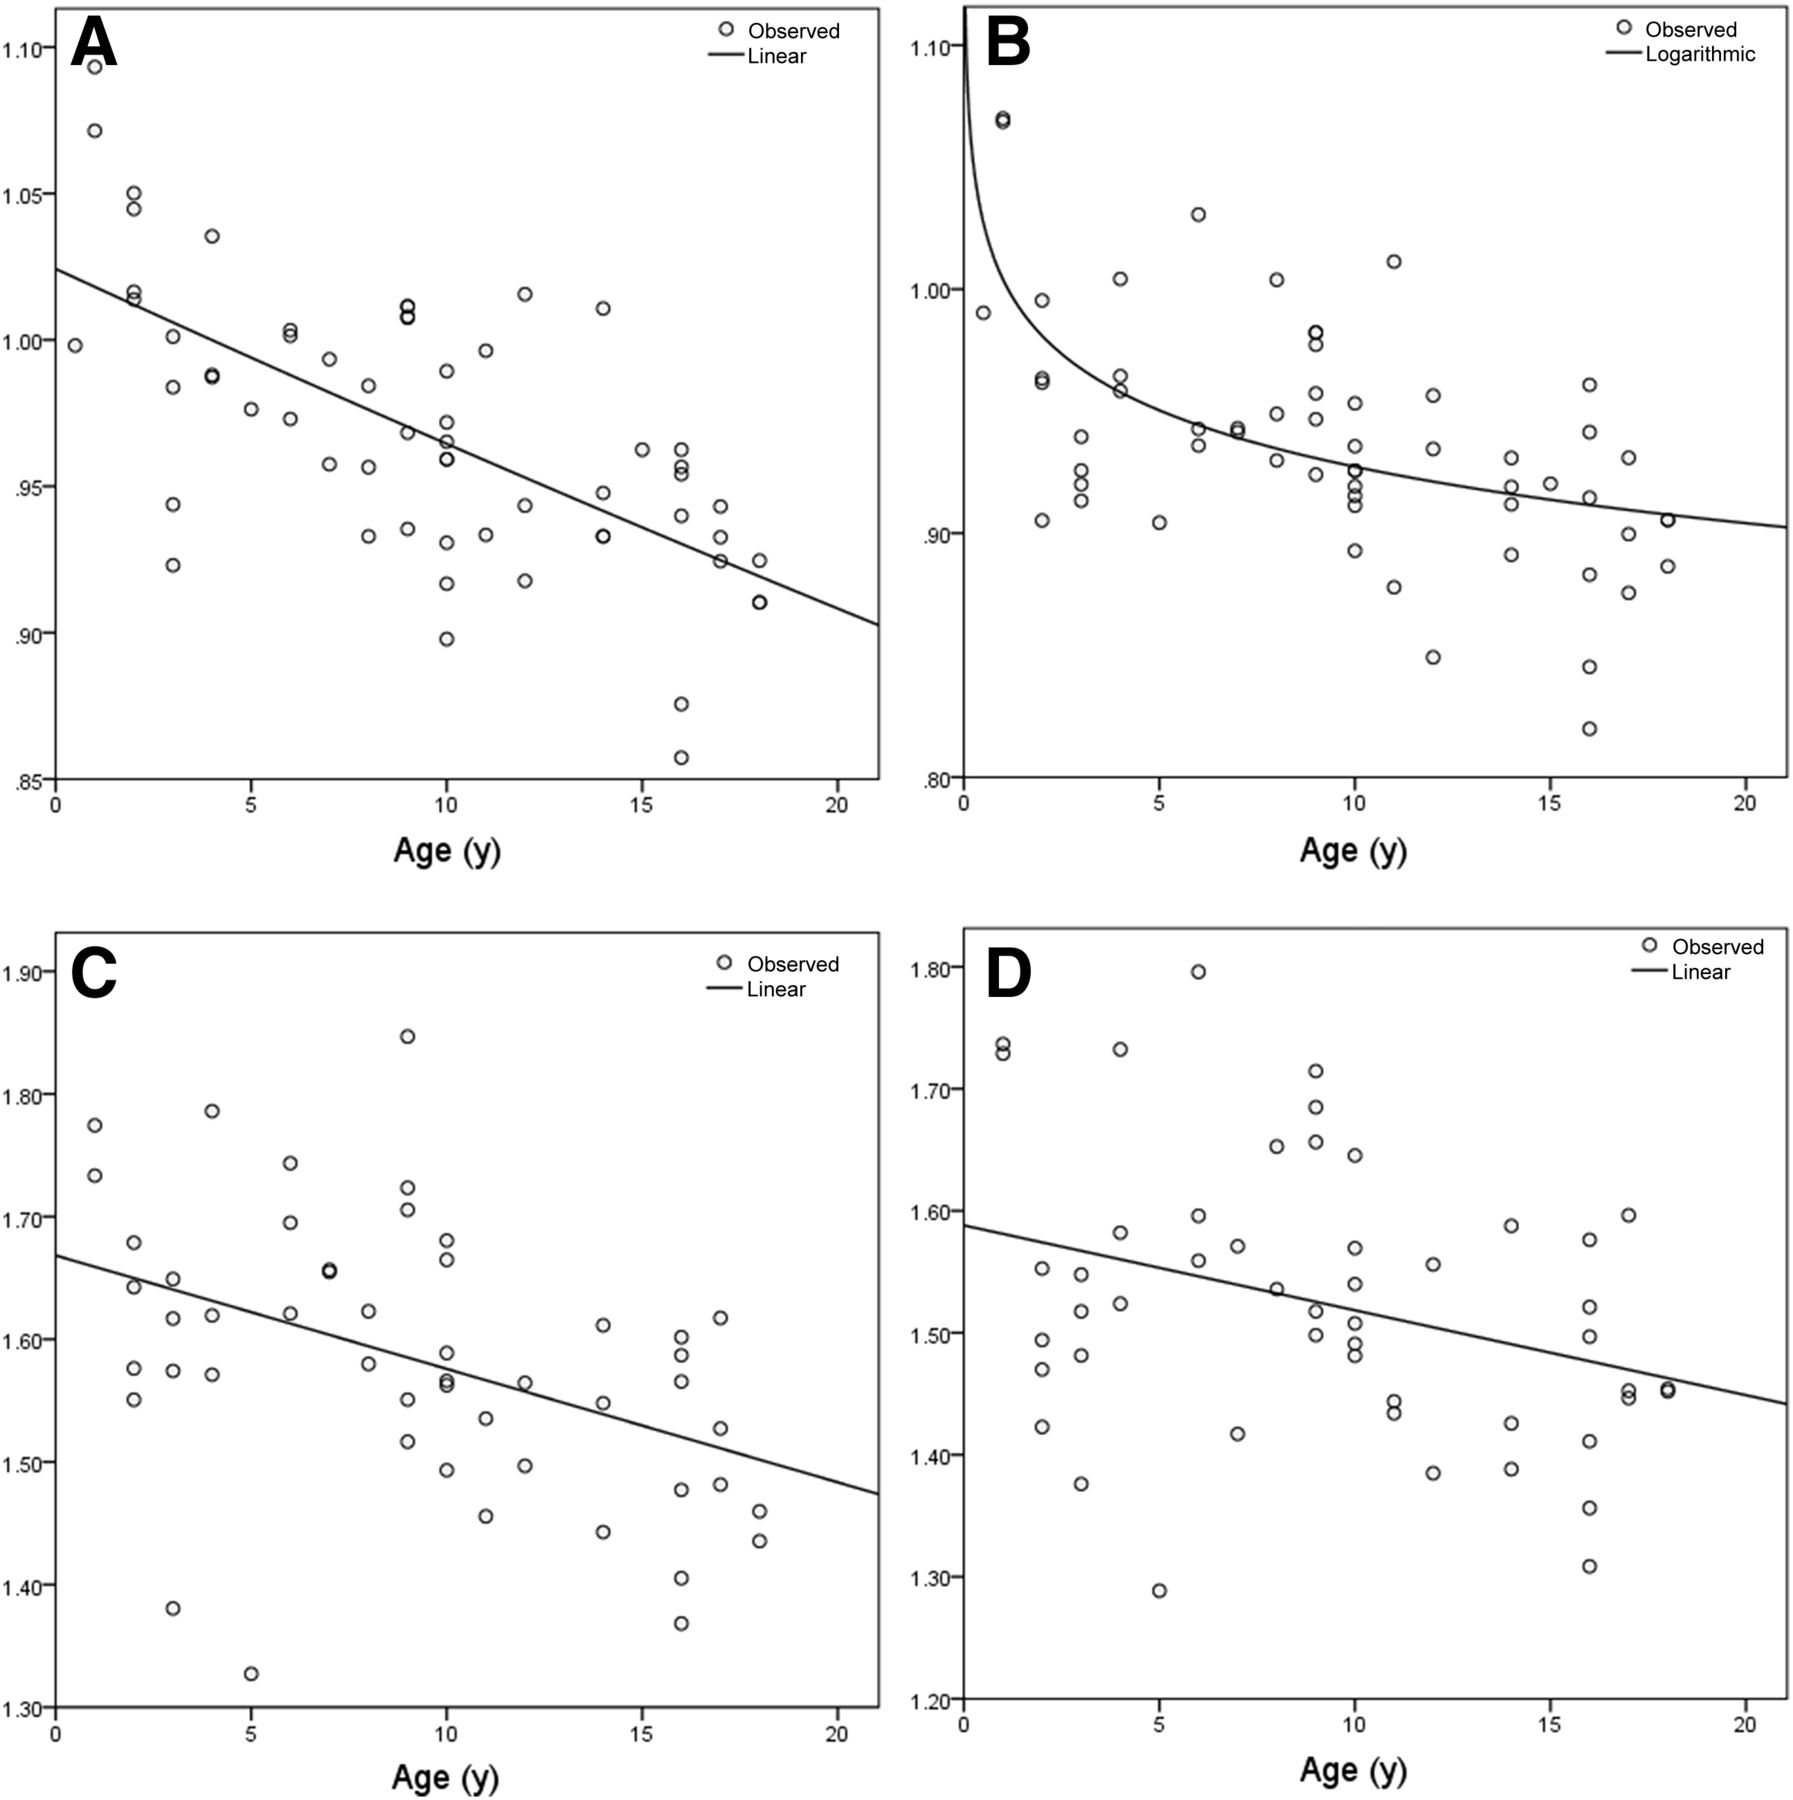
Optimal models of regional relative brain metabolism for superior parietal gyri: WBN linear model for right side (A) and WBN logarithmic model for left side (B); PN linear model for right side (C) and PN linear model for left side (D).
In the temporal lobes, functional dependence on age varied significantly among the 10 regions considered. In the medial temporal regions, activity decreased with age, with 4 regions being fitted with a quadratic model and a minimum being reached between the ages of 10 and 14 y. In most of the models for the lateral temporal regions, increasing activity was found but was generally modest. In the 3 regions fitted with a quadratic model, the maximum was reached around the age of 10 y.
Results in the occipital lobe showed activity that decreased with age for both the WBN and the PN data; however, the decrease was more marked for WBN than for PN. In the 4 nonlinear models fitted in the occipital lobe, the sharpest decrease occurred between 0 and 2 y of age.
The cerebellar hemispheres showed a continuous increase with age. Using WBN, the optimal model was a power law for the left cerebellum and linear for the right. Using PN, the model was a power law for both cerebellar hemispheres, and the parameters were similar. The midbrain was represented by a quadratic model using WBN, with a minimum reached at 10 y of age, and by a positive logarithmic equation using PN.
Activity in the basal ganglia and thalamus showed the most variation in models and in trends. The lentiform nuclei were represented by a power law model using WBN, with activity decreasing slowly with age, but by a quadratic model using PN, with a maximum reached around age 10 y and similar parameters. The left caudate nucleus was modeled with a logarithmic equation using WBN and PN data, with activity slightly increasing with age. However, for the right caudate nucleus, the model was a modified power law using WBN and quadratic using PN, with a slight decrease in activity with age. Thalamic activity was represented by the cubic model for both WBN and PN. The variation in thalamic activity with age is shown in Figure 4.

Optimal cubic models of regional relative brain metabolism for thalamus: WBN data for right (A) and left (B) sides, and PN data for right (C) and left (D) sides.
Comparison to the Validation Group
When comparing the model predictions with our validation group, we found that the activity in 1,286 (94.3%) of the 1,363 regions in our validation group fell within the 95% prediction interval, with 50 regions below and 26 above the predicted range using WBN data. For the PN validation data, the activity in 1,210 of the 1,288 regions (94%) fell within the 95% prediction interval, with 59 regions below and 19 above the predicted interval. In the 4 patients aged 2 y or less, there were 26 regions outside the 95% prediction interval for the WBN data and 48 for the PN data. There was no significant difference between the WBN model and the PN model in the number of regions below (P = 0.8) or above (P = 0.47) the 95% predicted interval or in the total (P = 0.97).
When comparing the models with our validation group data, we found that regional error varied from 1.79% to 5.48% for WBN, as shown in Figure 5A, and from 2.35% to 8.06% for PN, as shown in Figure 5B. For all brain regions in the validation group, the mean percentage error in prediction was 3% ± 0.96% for WBN and 4.72% ± 1.25% for PN (P < 0.0001).
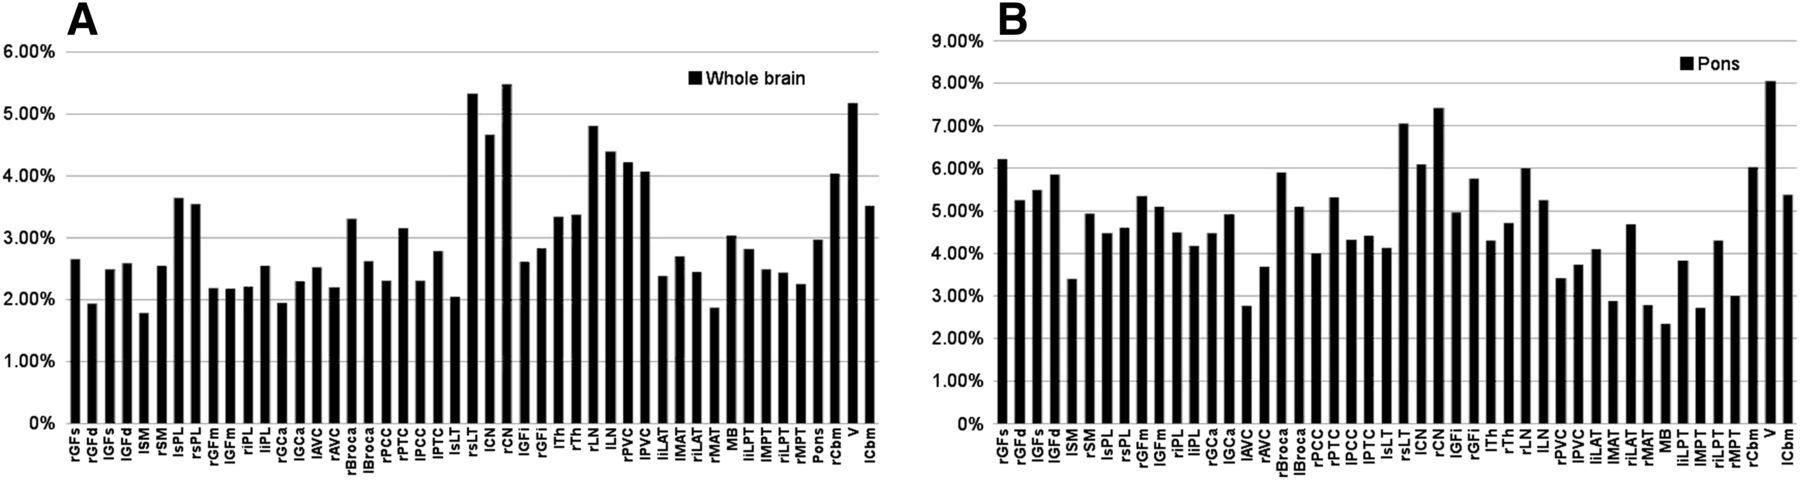
Absolute error in regional relative brain metabolism predicted by our models compared with validation group for WBN data (A) and PN data (B). Key to region abbreviations is in legend of Figure 1; “r” and “l” before abbreviation indicate right and left, respectively.
DISCUSSION
Our results demonstrate that it is feasible to accurately model the evolution of normal pediatric regional relative brain metabolism as a function of age and sex. Our models showed excellent agreement with our validation data. We have shown that, when normalized either to whole-brain activity or to a specific region (i.e., pons), regional relative brain metabolism in all cortical and subcortical regions evolves with age. Furthermore, we have shown that sex differences, although present, have a very limited effect on the evolution of regional relative brain metabolism. Qualitatively, our results were comparable to those seen in other studies, showing a posterior-to-anterior shift in regional relative brain metabolism with age, with the degree of activity in the frontal lobes being relatively attenuated during the initial years of life, gradually increasing, and peaking in late prepubescence (4,9,10).
A few studies have examined the evolution of regional relative brain metabolism in childhood. Most of those using dedicated brain PET were performed on patients with epilepsy or suspected neurologic anomalies (1,5,10,15). Others restricted their attention to patients over a limited age range (2,7). Only a few studies, including the current one, examined relatively large numbers of neurologically normal patients (3,6,9). Nonetheless, all these studies are broadly concordant (8,16) and demonstrate a stereotypical pattern of evolution of brain metabolism. Brain metabolism in the neonate is concentrated mainly in the regions responsible for basic functions—primary motor and sensory areas, basal ganglia, brain stem, and vermis (1,2). Maturation of regions related to spatial orientation, language, and attention follows. Prefrontal cortices are among the last regions to mature, including those responsible for attention, coordination, executive function, and emotional control. In late adolescence, “synaptic pruning” occurs (8,16). This may explain the quadratic fitting of many of our regions, with peak age around 10–12 y, similar to other studies (1,5,9,10).
For some brain regions, the functional form of the models differed between the left and right hemispheres, likely because of small differences in the goodness of fit of the models rather than a significant difference in the evolution of the metabolism in contralateral regions. For example, in some regions there were minimal differences between the linear, power law, modified power law, and logarithmic models (Supplemental Tables 3 and 4).
The use of regional relative brain metabolism obviates arterial blood sampling but introduces an ambiguity related to the choice of normalization. Various authors have attempted different approaches—with normalization to the cerebellum (9), both maximum cerebral cortical uptake and basal ganglia (3), or the average count per voxel (6)—and it is not clear which approach is most appropriate. Among the reference structures available with NeuroQ, we chose to normalize to whole-brain activity, as other authors have done, as well as to the pons. The latter was chosen on the basis of its being a midline structure, hence avoiding any potential issues of laterality based on handedness or diaschisis. When comparing the validation data to the mathematic models, we found that the number of regions falling outside the 95% prediction interval was similar between the WBN and PN models. The error in prediction was significantly lower when models were derived using WBN. However, comparisons to PN data may be useful in patients with diffusely decreased cortical activity, such as in patients who are sedated or have anatomic defects. Although the resultant quantitative models differed, the evolution of metabolism in many brain regions was qualitatively similar for both the WBN and PN data. As such, further study will be required to determine the optimal approach to normalization of brain metabolic activity.
This study was subject to several limitations. Fitting pediatric brains to a standardized adult template may have introduced systematic errors due to misregistration and elastic transformation of the small children’s brains. For WBN about 33% of the regions outside the 95% prediction interval, and for PN about 60%, were found in patients 2 y or younger. In particular, it is known that the goodness of fit of the spatial normalization of a pediatric brain to an adult template is age-dependent and is particularly relevant in very young patients, especially those under 6 y old (17–19). This fit could have been improved through the use of a custom normalization template (20). However, the current version of our software prevented us from doing so or from directly creating our own reference database. In addition, certain clinical information, such as handedness, could have been considered and included in the models.
Another significant limitation of our study is the small number of dedicated brain studies, as well as the use of patients with systemic disease as surrogates for “healthy” patients. None of the children underwent a formal neuropsychological evaluation, but their medical records were reviewed carefully to identify any anomaly that might affect brain metabolism. Both of these limitations stem from restrictions on scanning healthy pediatric subjects. The larger voxel size (4 mm3) of whole-body and head-and-neck acquisitions, when compared with the smaller voxel size (2 mm3) of dedicated brain studies, may also be a limitation (21). Nonetheless, it is unclear to what extent our results would have been modified if most of our patients had received dedicated brain acquisitions.
There are numerous contexts in which these models can be clinically relevant. In particular, these models provide an age and sex reference standard that can then be used to aid in the interpretation of individual pediatric 18F-FDG PET brain studies for patients with central nervous system disease. For example, these models can be directly applicable to the interpretation of epilepsy studies (12,22), neurooncology cases, or patients with infectious or inflammatory brain diseases such as encephalitis, for either diagnosis or follow-up (23,24,25). Our method offers an alternative to the more time-consuming and technically challenging use of statistical parametric mapping (4,5,7,22,23). However, further work is required to better determine the optimal use of these models.
CONCLUSION
To our knowledge, this was the first study to use a large number of neurologically intact patients to develop and validate models of regional relative brain metabolism in children, and these models were accurate over the entire pediatric age range (0–18 y). Furthermore, we have examined the effect of using both WBN and PN data and found that WBN data led to more accurate models. In addition, we considered broader classes of mathematic models than those presented in similar studies.
DISCLOSURE
This project was supported by the 2016 10th Faculty Competition of the Radiology, Radio-Oncology, and Nuclear Medicine Department, Faculty of Medicine, University of Montreal, Montreal, Quebec, Canada. No other potential conflict of interest relevant to this article was reported.
Acknowledgments
We thank Dr. Daniel H. Silverman (NeuroQ) and Daniel G. Hyams (CurveExpert).
Footnotes
Published online Dec. 28, 2017.
- © 2018 by the Society of Nuclear Medicine and Molecular Imaging.
REFERENCES
- Received for publication September 6, 2017.
- Accepted for publication November 30, 2017.


Jump to section
Related Articles
Cited By...
- No citing articles found.