


Abstract
The objective of this study was to investigate whether quantitative imaging features derived from combined 18F-fluciclovine PET/multiparametric MRI show potential for detection and characterization of primary prostate cancer. Methods: Twenty-eight patients diagnosed with high-risk prostate cancer underwent simultaneous 18F-fluciclovine PET/MRI before radical prostatectomy. Volumes of interest (VOIs) for prostate tumors, benign prostatic hyperplasia (BPH) nodules, prostatitis, and healthy tissue were delineated on T2-weighted images, using histology as a reference. Tumor VOIs were marked as high-grade (≥Gleason grade group 3) or not. MRI and PET features were extracted on the voxel and VOI levels. Partial least-squared discriminant analysis (PLS-DA) with double leave-one-patient-out cross-validation was performed to distinguish tumors from benign tissue (BPH, prostatitis, or healthy tissue) and high-grade tumors from other tissue (low-grade tumors or benign tissue). The performance levels of PET, MRI, and combined PET/MRI features were compared using the area under the receiver-operating-characteristic curve (AUC). Results: Voxel and VOI features were extracted from 40 tumor VOIs (26 high-grade), 36 BPH VOIs, 6 prostatitis VOIs, and 37 healthy-tissue VOIs. PET/MRI performed better than MRI and PET alone for distinguishing tumors from benign tissue (AUCs of 87%, 81%, and 83%, respectively, at the voxel level and 96%, 93%, and 93%, respectively, at the VOI level) and high-grade tumors from other tissue (AUCs of 85%, 79%, and 81%, respectively, at the voxel level and 93%, 93%, and 91%, respectively, at the VOI level). T2-weighted MRI, diffusion-weighted MRI, and PET features were the most important for classification. Conclusion: Combined 18F-fluciclovine PET/multiparametric MRI shows potential for improving detection and characterization of high-risk prostate cancer, in comparison to MRI and PET alone.
Prostate cancer is the most frequently detected type of cancer in men and constitutes a major health-care problem in developed countries (1). Medical imaging plays an increasingly important role in the management of prostate cancer and is used for diagnosing and stratifying indolent and clinically significant disease (2), guiding prostate biopsies (3), and targeting localized therapy (4). In Norway, multiparametric MRI—that is, the combination of MR images with distinct contrasts—is currently the first diagnostic tool for patients in whom prostate cancer is suspected on the basis of digital rectal examination or prostate-specific antigen blood testing (5). However, multiparametric MRI leaves ample room for improvement; despite the Prostate Imaging–Reporting and Data System guidelines (6), there is a highly variable accuracy for detection of clinically significant disease (7), whereas grading of tumor aggressiveness suffers from overlapping values between Gleason scores (8).
PET imaging with the radiotracer anti-1-amino-3-18F-fluorocyclobutane-1-carboxylic acid (18F-fluciclovine, a synthetic amino acid analog, also known as 18F-FACBC) has recently been approved by the Food and Drug Administration and European Medicines Agency for detection of recurrent prostate cancer in patients with biochemical relapse after initial treatment with curative intent (9–11). For primary prostate cancer, the metabolic information derived from 18F-fluciclovine PET images might be useful for detection and characterization of localized tumors (12–14) and might be complementary to multiparametric MRI (12).
In comparison to sequential multiparametric MRI and PET/CT examinations, simultaneous PET/MRI has the advantages of shorter (cumulative) scan times, simpler patient logistics, reduced radiation exposure from omitting the CT, and an intrinsic alignment of the PET and MR images. We have previously presented an optimized imaging protocol for simultaneous 18F-fluciclovine PET/MRI that maximizes the diagnostic information obtained from the PET images (14). The objective of the current study was to investigate whether simultaneous 18F-fluciclovine PET/multiparametric MRI has the potential to improve detection and characterization of primary prostate cancer. For this purpose, we built and evaluated statistical models to assess which combination of MRI- and PET-derived imaging features best discriminates between histologically verified malignant and benign tissue. We also show here that these models can be used to create cancer probability maps, which can be regarded a visual summary of the combined PET and MRI information to support image interpretation in future clinical practice.
MATERIALS AND METHODS
Patients
Patients classified as at high risk according to modified D’Amico criteria (prostate-specific antigen level > 20 ng/mL or clinical stage ≥ cT3a or Gleason score ≥ 8) and scheduled for robot-assisted radical prostatectomy with extended pelvic lymph node dissection were recruited for a prospective study investigating the merit of combined 18F-fluciclovine PET/MRI for locoregional staging of primary prostate cancer (ClinicalTrials.gov identifier NCT02076503). The study was approved by our institution (St. Olavs Hospital, Trondheim University Hospital) and by the Regional Committee for Medical and Health Research Ethics, Central Norway. All patients gave written informed consent before enrollment. In this work, we performed a retrospective analysis of these prospectively collected data, focusing on the detection and characterization of prostate tumors.
Imaging
Patients underwent a PET/MRI examination on a 3-T Biograph mMR scanner (Siemens Medical Systems) before surgery, as previously described (14). In this work, we used T2-weighted (T2W), diffusion-weighted (DW), and dynamic contrast-enhanced (DCE) MR images, which together constitute the clinical multiparametric MRI examination for T staging, as well as the simultaneously acquired 18F-fluciclovine PET images. All images were postprocessed to obtain parametric maps from which quantitative imaging features were obtained. For this purpose, the T2W images were intensity-normalized (nT2W) to the levator ani muscle. The DW images were corrected for geometric distortion (15), after which apparent-diffusion-coefficient (ADC) maps were calculated using a monoexponential decay model (including b = 50, 400, and 800 s/mm2). DW images at b = 800 s/mm2 (b800) were also used for further analysis. Maps of the volume transfer constant (Ktrans), the fractional volume of the extravascular extracellular space (ve), and the fractional plasma volume (vp) were calculated from motion-corrected DCE images using the extended Tofts model with a population-based arterial input function (16,17). PET data from 5 to 10, 18 to 23, and 33 to 38 min after injection were reconstructed to SUV maps (SUV5–10, SUV18–23, and SUV33–38, respectively) using a manufacturer-provided algorithm (Siemens HDPET, 3 iterations, 21 subsets, and a gaussian filter of 4 mm in full width at half maximum). These time windows were previously shown to have potential for prostate cancer diagnosis (14). All images were coregistered and resampled to T2W image space using a multiresolution rigid registration scheme based on mutual information in Elastix (18).
Volumes of Interest (VOIs) and Feature Extraction
Histopathology-matched VOIs formed the basis for imaging-feature extraction. In short, a pathologist specialized in uropathology delineated cancer foci, benign prostatic hyperplasia (BPH) nodules, and regions of prostatitis on hematoxylin- and eosin-stained whole-mount histology slides of the excised prostate gland (14). Cancer grade was described according to the Gleason scoring system (19). The histology slides were then spatially matched to the T2W images on the basis of anatomic landmarks and served as a reference for the delineation of 3-dimensional VOIs of tumor, BPH, prostatitis, and healthy tissue. These VOIs were outlined in both the peripheral zone and the central gland (transition and central zone), if possible, and placed as far as possible from the lesions to minimize partial-volume effects. Tumor VOIs were assigned to be high-grade (≥Gleason score 4 + 3; that is, ≥Gleason grade group 3) or low-grade (20). Furthermore, the volume (mL) was recorded for each VOI and an ordinal confidence score (1 being not confident; 2, reasonably confident; and 3, confident) was assigned, which expressed how well the delineated VOI resembled histology. VOIs smaller than 0.5 mL or a confidence score lower than 2 were excluded from further analysis.
From each of the remaining VOIs, imaging features were extracted on the voxel and VOI levels. The voxel-level features were collected in a 9 × Nvoxels matrix, where each of the Nvoxels rows contained the image intensities of the 9 parametric maps (nT2W, b800, ADC, Ktrans, ve, vp, SUV5–10, SUV18–23, and SUV33–38) for a single voxel, with Nvoxels the total number of voxels in the VOIs. The VOI-level features were collected in a 99 × NVOIs matrix, where each of the NVOIs rows contained 11 first-order statistical features (mean, SD, minimum, 10% percentile, 25% percentile, median, 75% percentile, 90% percentile, maximum, skewness, and kurtosis) of the 9 parametric maps (9 × 11 = 99), with NVOIs the total number of VOIs. The imaging features were then used as input to the classification algorithm described in the next section.
Classification
Partial least-squares discriminant analysis (PLS-DA) is a classification method that calculates latent variables (LVs) to maximize the covariance between the input variables (in this case, the imaging features) and the response variable (the class) (21). In this way, large datasets with multiple variables can be visualized and interpreted using only a few dimensions (LVs). The method is well suited for dealing with highly colinear variables and provides valuable insight into the constructed models via score plots, which show each sample’s position in the new coordinate system defined by the LVs, and loading plots, which show the importance of the original variables for defining this coordinate system.
We performed PLS-DA on both the voxel and the VOI levels to evaluate the performance of a given set of imaging features for discriminating between tumor and benign tissue (i.e., BPH + prostatitis + healthy tissue). Since Gleason grade group 3–5 tumors are associated with a significantly poorer prognosis than Gleason grade group 1–2 tumors (20), we also investigated the potential discrimination between high-grade tumor and other tissue (i.e., low-grade tumor + BPH + prostatitis + healthy tissue). All imaging features were scaled to have zero mean and unit SD. To avoid overoptimistic results, model overfitting was counteracted by nesting the PLS-DA algorithm in a wrapper for double leave-one-patient-out cross-validation. In the inner cross-validation loop of this wrapper, the number of LVs resulting in the model with the lowest average classification error in the training set (N − 1 patients) was selected, with N the total number of patients. Additionally, the scores for variable importance in the projection (VIP) (22) were recorded as measures of relative feature importance. The trained model was then applied in the outer cross-validation loop of the wrapper to predict the class probabilities of the voxels or VOIs in the test set (1 patient), thus achieving independent classification accuracies for data that were not used to build the PLS-DA model. This whole procedure was repeated N times, giving predicted class probabilities for every voxel or VOI in the dataset, which were finally compared with the true class.
Three sets of imaging features were initially evaluated and compared: MRI (nT2W + b800 + ADC + Ktrans + ve + vp), PET (SUV5–10 + SUV18–23 + SUV33–38), and PET/MRI (nT2W + b800 + ADC + Ktrans + ve + vp + SUV5–10 + SUV18–23 + SUV33–38). On the basis of the VIP score analysis, a PET/T2W + DW MRI feature set (nT2 + b800 + ADC + SUV5–10 + SUV18–23 + SUV33–38) was also evaluated and compared with the complete PET/MRI feature set. The double cross-validated performance levels of MRI, PET, PET/MRI, and PET/T2W + DW MRI were assessed using receiver-operating-characteristic curve analysis. The area under the curve (AUC) was used as the figure of merit, and the optimal sensitivity and specificity were determined as the point on the curve closest to (1,1). Finally, scores and loading plots were constructed of the PET/MRI and PET/T2W + DW MRI models for interpretation of the results. For this purpose, the models were rebuilt using the data from all patients, that is, without cross-validation.
Statistical Analysis
Descriptive statistics are presented as mean and SD or as median and range. Statistical differences in feature intensity between classes were calculated using linear mixed-effects models, with the patient number as a random effect on the intercept. The resulting P values were corrected for multiple testing by Benjamini–Hochberg correction. Permutation testing, that is, random shuffling of the class labels (n = 1,000), was performed to examine whether the achieved PLS-DA predictions were significantly different from chance. Statistical differences in AUC between feature sets were evaluated using the method of DeLong et al. for comparing correlated AUCs (23). P values of less than 0.05 were considered statistically significant for all tests. Unless indicated otherwise, MATLAB 9.0 (The MathWorks Inc.) was used for image processing and univariate statistics. MATLAB PLS_toolbox, version 8.2.1 (Eigenvector Research, Inc.), was used for PLS-DA classification.
RESULTS
Patients and Imaging
Twenty-eight patients (median age, 66 y; range, 55–72 y) were included in the study. The median prostate-specific antigen level was 14.6 ng/mL (range, 3.7–56.9 ng/mL), the median biopsy Gleason score was 8 (range, 7–9), and the clinical stage ranged from cT2b to cT3b. The median time between the PET/MRI examination and surgery was 8 d (range, 5–32 d), and the median administered activity was 327 MBq (range, 283–384 MBq).
The number of VOIs delineated on the T2W images was 217. Of these, 98 were excluded because of size or confidence criteria, leaving 119 VOIs for analysis (Table 1). The total number of voxels in these VOIs was 512,717.
VOI Characteristics
Feature Extraction
An example of the 9 parametric maps calculated from the combined PET/MRI examination is shown in Figure 1. In total, 9 × 512,717 voxel-level features and 99 × 119 VOI-level features were extracted from the 119 VOIs. An overview of the mean feature intensities at the VOI level for each class is provided in Table 2. ADC, SUV18–23, and SUV33–38 were the only features that consistently showed significant differences between malignant and benign tissue, indicating that these could be important for PLS-DA classification.
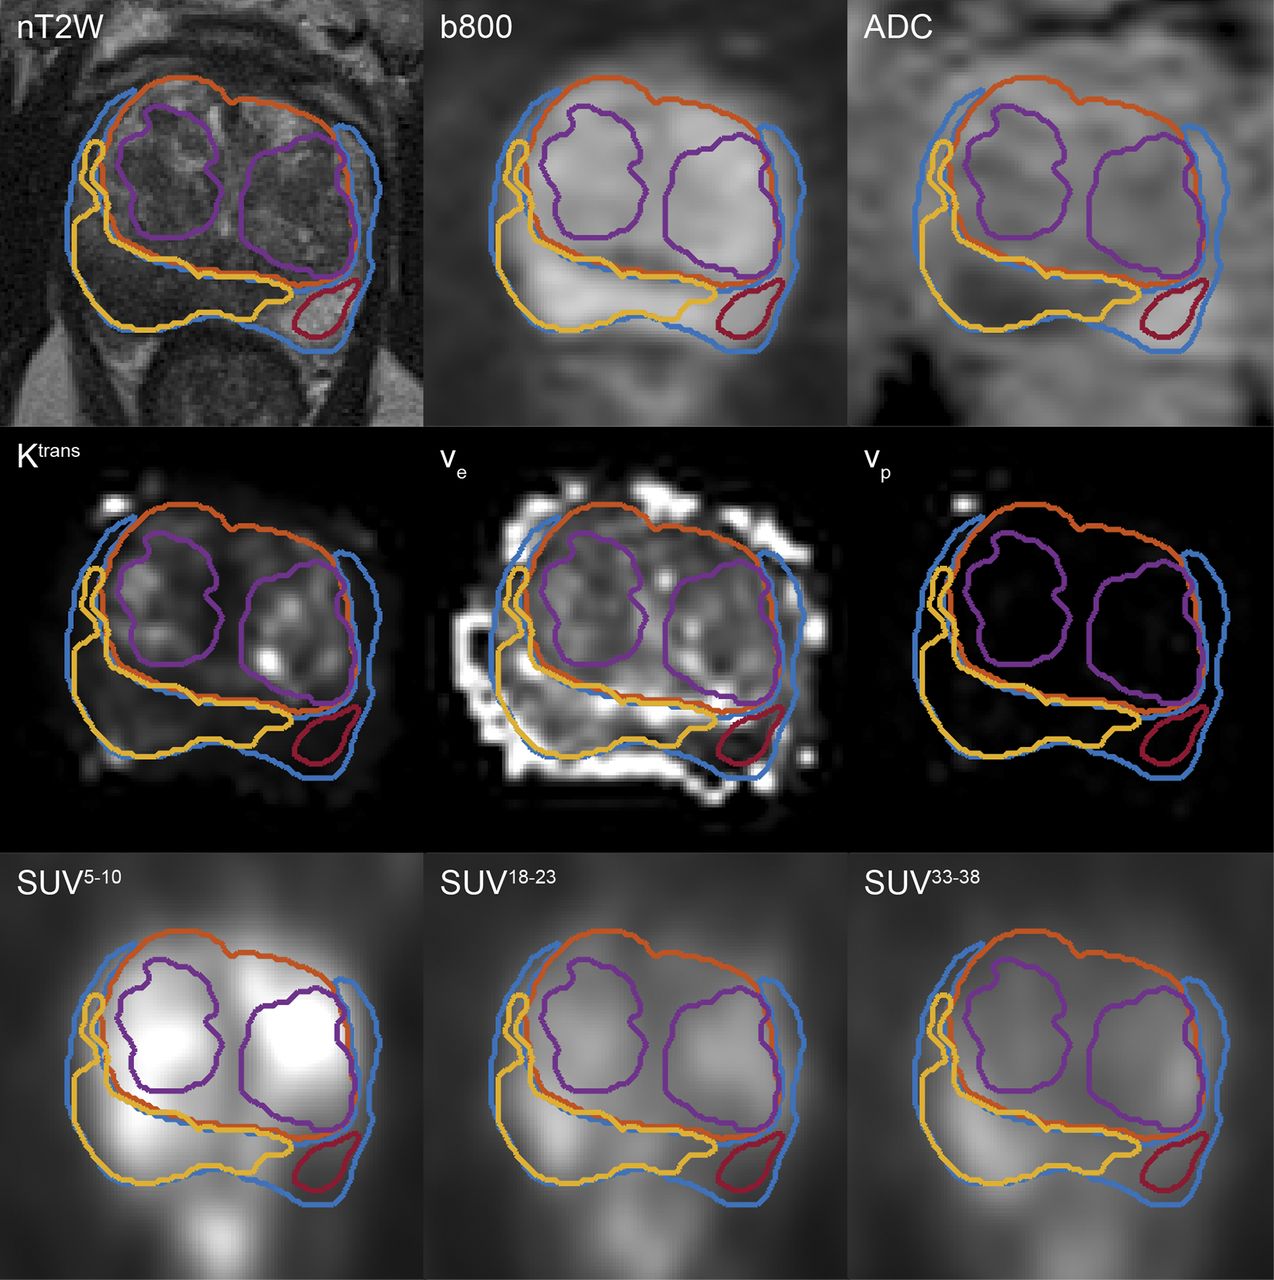
Collage of central slices through 9 parametric maps of 64-y-old patient. Yellow outline indicates contour of tumor VOI; purple, 2 benign prostatic hyperplasia nodules; red, healthy tissue VOI; orange, contour of central gland; and blue, contour of peripheral zone.
Feature Intensities
Classification
The classification performance levels of the different imaging-feature sets are presented in Table 3. All PLS-DA models performed significantly better than chance as assessed by permutation testing (P < 0.001). At the voxel level, the imaging features from combined PET/MRI performed significantly better (i.e., higher AUCs) than those from MRI and PET alone, both for discriminating tumor from benign tissue (P < 0.001 and P < 0.001, respectively) and for discriminating high-grade tumor from all other voxels (P < 0.001 and P < 0.001, respectively). At the VOI level, the highest AUCs were also observed for combined PET/MRI, but these were not always significantly different from those for MRI and PET alone (tumor vs. benign tissue: P = 0.140 and P = 0.049, respectively; high-grade tumor vs. all other tissue: P = 0.831 and P = 0.252, respectively).
Performance Measures of MRI, PET, and PET/MRI Feature Sets for Discriminating Between Tumor and Benign Tissue and Between High-Grade Tumor and Other Tissue
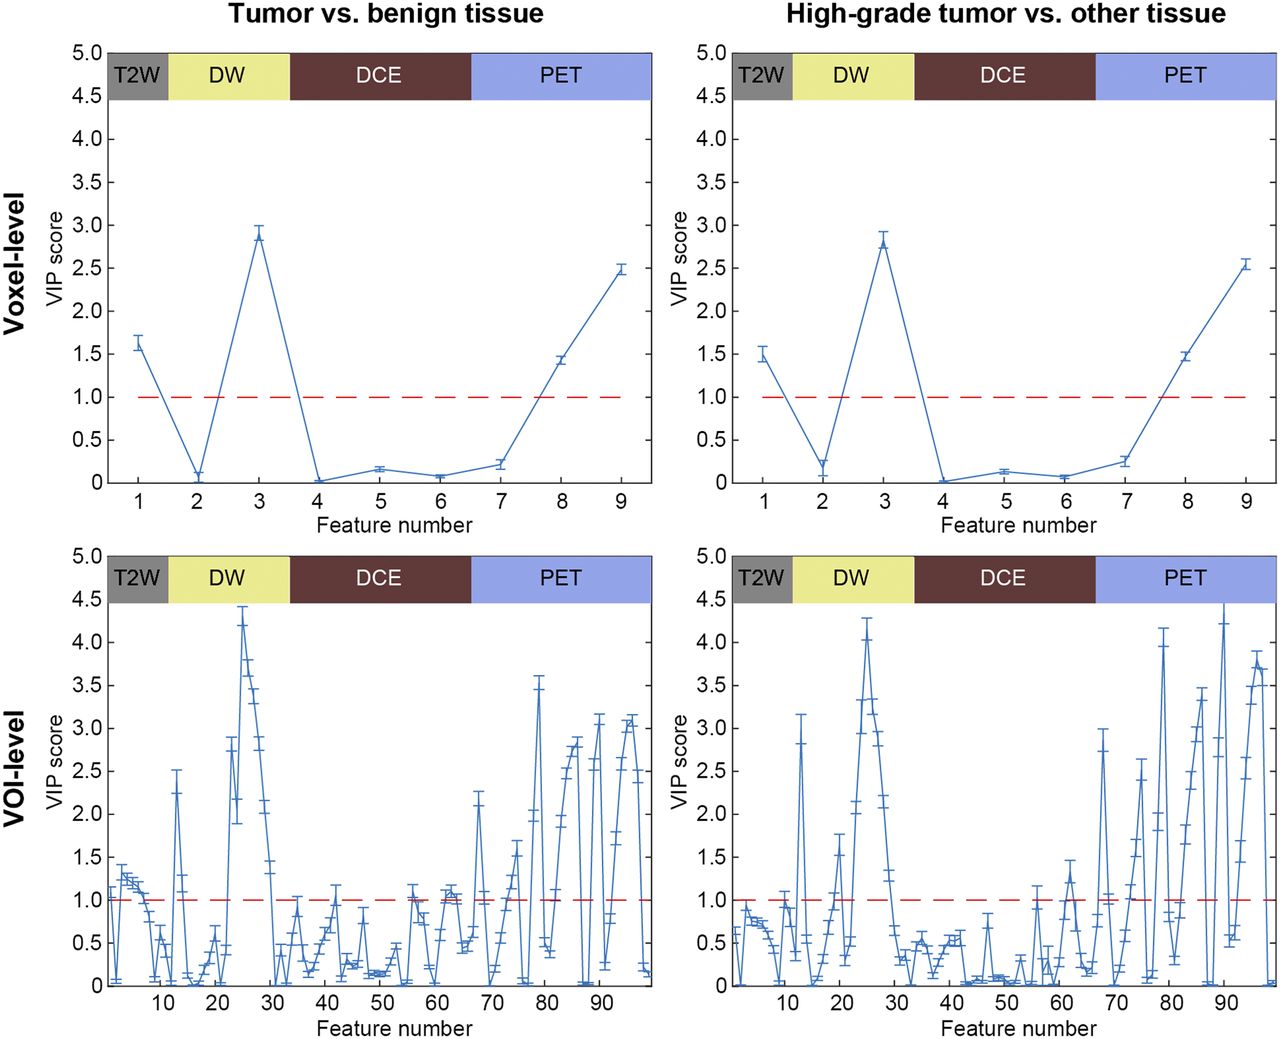
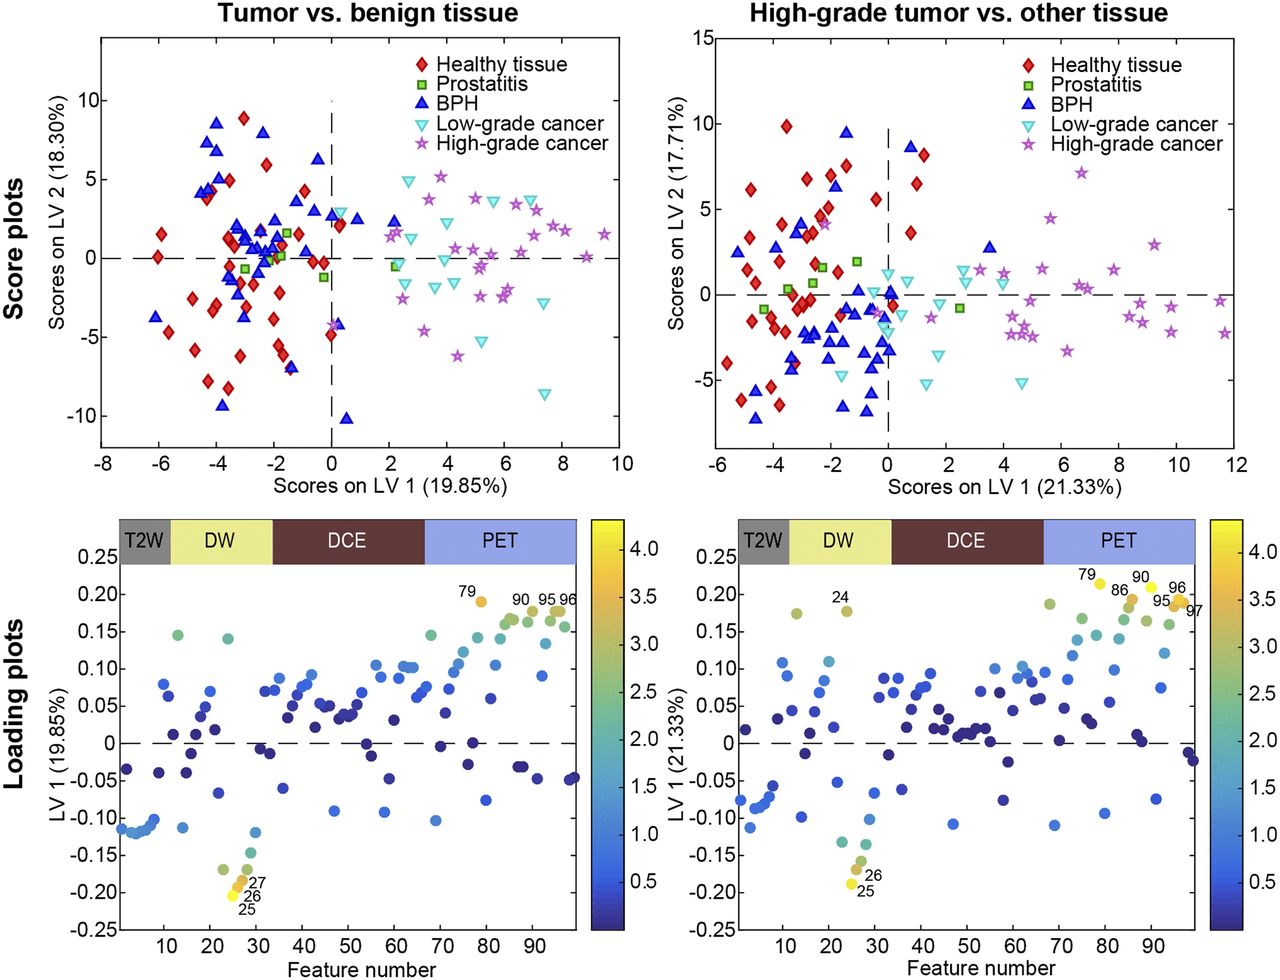
The VIP scores shown in Figure 2 indicate that features from T2W MRI, DW MRI, and PET were consistently more important for classification than those from DCE MRI. This information encouraged us to build and evaluate an additional model based on the combination of these 3 modalities. As shown in Table 4 and Figure 3, the PET/T2W + DW MRI features indeed performed similarly to the PET/MRI features for all classification tasks. These results suggest that, for the quantitative analysis performed in this study, DCE MRI does not add much value to PET, T2W MRI, or DW MRI. This finding is further illustrated by the score plots and loading plots of the orthogonalized PLS-DA models built on the PET/MRI features from all 28 patients, as shown in Figure 4 (VOI level only). Tumors/high-grade tumors were most importantly associated with lower ADCs and higher late-window SUVs than benign/other tissue. The score plots and loading plots for the PET/T2W + DW MRI model, which are provided as Supplemental Figure 1, show similar patterns (supplemental materials are available at http://jnm.snmjournals.org).

Overview of VIP scores for all classification tasks, showing which variables are important for discriminating between groups. Features from DCE MRI were consistently least important for classification. nT2W, b800, ADC, Ktrans, ve, vp, SUV5–10, SUV18–23, and SUV33–38 are voxel-level features 1–9. Mean, SD, minimum, 10% percentile, 25% percentile, median, 75% percentile, 90% percentile, maximum, skewness, and kurtosis are VOI-level features 1–11 for nT2W, 12–22 for b800, 23–33 for ADC, 34–44 for Ktrans, 45–55 for ve, 56–66 for vp, 67–77 for SUV5–10, 78–88 for SUV18–23, and 89–99 for SUV33–38.
Performance Measures of PET/T2W + DWI MRI Feature Set for Discriminating Between Tumor and Benign Tissue and Between High-Grade Tumor and All Other Tissue

Overview of receiver-operating-characteristic curves for all classification tasks. PET/MRI performed consistently better than MRI and PET, whereas PET/T2W + DW MRI and PET/MRI performed similarly to each other.

Overview of score plots and loading plots of PET/MRI models for VOI-level classification tasks. Score plots show excellent discrimination between tumor and benign tissue and between high-grade tumor and other tissue on first latent variable (LV1). Loading plots are colored by their VIP score, showing that low ADCs (labels 25, 26, and 27), high SUVs (labels 86, 95, 96, and 97), and high SDs (labels 24, 79, and 90) were the most important features characterizing malignant classes. Mean, SD, minimum, 10% percentile, 25% percentile, median, 75% percentile, 90% percentile, maximum, skewness, and kurtosis are features 1–11 for nT2W, 12–22 for b800, 23–33 for ADC, 34–44 for Ktrans, 45–55 for ve, 56–66 for vp, 67–77 for SUV5–10, 78–88 for SUV18–23, and 89–99 for SUV33–38.
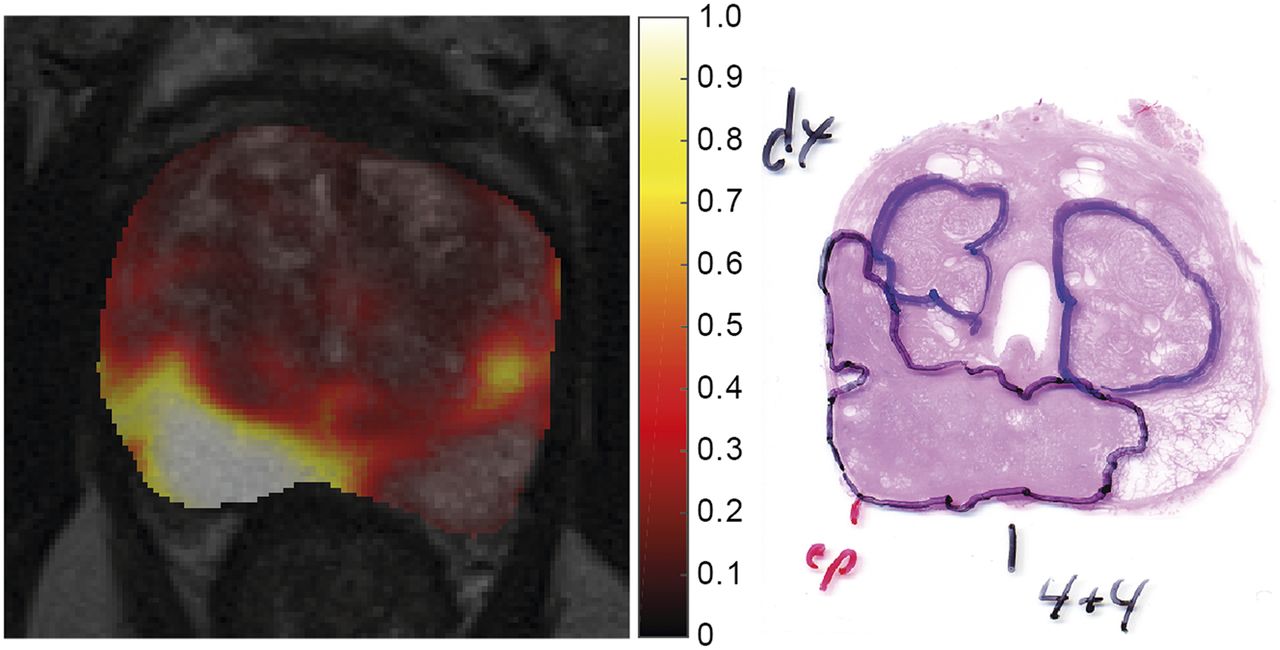
An example of how the results of this study can be translated to clinical practice is provided in Figure 5, which shows the voxelwise cancer probability map that corresponds to the parameter maps in Figure 1. This cancer probability map was obtained by applying the cross-validated PET/T2W + DW MRI model, which was trained on the other 27 patients, to the prostate voxels of the shown patient, followed by backprojection into image space. The highest cancer probabilities were found to accurately coincide with the location of a peripheral-zone tumor as verified by whole-mount histology. These tumor probability maps could be automatically calculated and presented alongside the traditional images as a supporting tool to pinpoint regions with a high likelihood of cancer when a physician is interpreting the PET/MR images.

(Left) Central slice through tumor probability map of 64-y-old patient, fused with T2W image for anatomic reference. (Right) Region with highest tumor probability values corresponds to peripheral-zone tumor with Gleason score of 4 + 4, as verified by histopathology.
DISCUSSION
We have previously shown that 18F-fluciclovine PET images alone may be useful for the assessment of localized prostate cancer (14). The objective of the current study was to investigate the potential of combined 18F-fluciclovine PET/multiparametric MRI for improving the detection and characterization of primary prostate cancer, in comparison to MRI and PET alone. We built and cross-validated PLS-DA models that allowed us to evaluate the performance of combined PET/MRI-derived imaging features for discriminating between histologically verified malignant and benign tissue. We found that imaging features from PET/MRI better discriminated between tumor and benign tissue, and between high-grade tumor and other tissue (including low-grade tumor), than did features from MRI or PET alone. Features from T2W MRI, DW MRI, and PET were more important for classification than those from DCE MRI, indicating that the latter may be omitted for this purpose. We also showed that the PLS-DA model can be used to generate images of the cancer probability distribution, which could be interpreted by the physician alongside the traditional MRI and PET images in future clinical practice.
The results of this double cross-validated study confirm the results of our previously published analysis on the same patient cohort (14), which also showed that malignant prostate tissue is associated with high SUVs on late-window 18F-fluciclovine PET images. As expected (6), we observed significantly lower ADC and nT2W values in malignant tissue than in benign tissue, both of which were important for classification. In contrast, the quantitative DCE MRI parameters played a limited role in the classification tasks. This observation is in line with work from De Visschere et al. (24) and the most recent Prostate Imaging–Reporting and Data System guidelines (6), in which DCE MRI is recommended only as an adjuvant tool to DW MRI for potential upgrading of score 3 peripheral-zone lesions.
The observed absolute differences in SUV between tumors and benign lesions were relatively small (e.g., 2.5 vs. 2.0 for BPH, P < 0.05), indicating that PET images alone may not be sufficient for evaluation of primary prostate cancer in clinical practice. Nevertheless, the discriminative power of PET was strong enough to improve MRI-based classification by approximately 5% when combined. The benefit of such a multivariate approach to cancer probability mapping could be higher in patient cohorts for which MRI alone has a less impressive performance. This effect was more apparent at the voxel level than at the VOI level, as may be caused by the difference in statistical power. In a study combining sequential multiparametric MRI and 18F-fluciclovine PET/CT, Turkbey et al. found comparable results: the combination of PET and MRI features showed a higher positive predictive value for distinguishing tumor-containing from non–tumor-containing prostate sectors than PET or MRI alone (12). Similarly, Eiber et al. found that the combination of 68Ga-PSMA PET and multiparametric MRI was more accurate for localization of primary prostate cancer than MRI alone (25). They reported a high tumor–to–benign-tissue SUV ratio of 4.48, which could be a potential benefit of 68Ga-PSMA in comparison to 18F-fluciclovine.
This study had some limitations. The patient cohort was relatively small, but homogeneous, as it consisted of high-risk prostate cancer patients only. We avoided model overfitting using a double cross-validation scheme, but our results cannot be extended to low- and intermediate-risk patients without proper validation. Furthermore, we realize that the results of this quantitative analysis, in which we retrospectively identified the VOIs on the T2W MR images while using histology as a reference, may not be directly translatable to radiologic reading as performed in clinical practice. Another implication of the retrospective approach was the possible introduction of a positive bias toward T2W MRI, because the VOIs were delineated on these images. Nevertheless, 18F-fluciclovine PET was still shown to add value to multiparametric MRI. Validation of the clinical diagnostic value of combined 18F-fluciclovine PET/MRI in a broader patient population will be part of future prospective studies.
Including 18F-fluciclovine PET with multiparametric MRI for diagnosis of primary prostate cancer is clinically feasible on an integrated PET/MRI system and does not increase the total scan time of the examination (14). However, the additional costs associated with 18F-fluciclovine PET may hinder its use for routine diagnostic imaging in the overall prostate cancer population. Nevertheless, the high diagnostic potential of combined 18F-fluciclovine PET/MRI could be fully exploited in selected cases, such as for diagnosis in patients at high risk for lymph node metastases and for planning of targeted prostate biopsies in patients highly suspected of having prostate cancer but with previous negative biopsies.
CONCLUSION
The combination of imaging features from T2W MRI, DW MRI, and 18F-fluciclovine PET shows excellent discriminative performance between malignant and benign tissue and may improve the detection and characterization of high-risk prostate cancer in selected cases.
DISCLOSURE
This study was funded by the Norwegian Cancer Society (grant 100792). No other potential conflict of interest relevant to this article was reported.
Footnotes
Published online Oct. 6, 2017.
- © 2018 by the Society of Nuclear Medicine and Molecular Imaging.
REFERENCES
- Received for publication July 3, 2017.
- Accepted for publication September 18, 2017.


