


Abstract
In patients with brain metastasis, PET using labeled amino acids has gained clinical importance, mainly regarding the differentiation of viable tumor tissue from treatment-related effects. However, there is still limited knowledge concerning the uptake characteristics in patients with newly diagnosed and untreated brain metastases. Hence, we evaluated the uptake characteristics in these patients using dynamic O-(2-18F-fluoroethyl)-l-tyrosine (18F-FET) PET. Methods: Patients with newly diagnosed brain metastases without prior local therapy and 18F-FET PET scanning were retrospectively identified in 2 centers. Static and dynamic PET parameters (maximal/mean tumor-to-brain-ratio [TBRmax/TBRmean], biologic tumor volume [BTV], and time–activity curves with minimal time to peak [TTPmin]) were evaluated and correlated with MRI parameters (maximal lesion diameter, volume of contrast enhancement) and originating primary tumor. Results: Forty-five brain metastases in 30 patients were included. Forty of 45 metastases (89%) had a TBRmax ≥ 1.6 and were classified as 18F-FET–positive (median TBRmax, 2.53 [range, 1.64–9.47]; TBRmean, 1.86 [range, 1.63–5.48]; and BTV, 3.59 mL [range, 0.04–23.98 mL], respectively). In 39 of 45 brain metastases eligible for dynamic analysis, a wide range of TTPmin was observed (median, 22.5 min; range, 4.5–47.5 min). All 18F-FET–negative metastases had a diameter of ≤ 1.0 cm, whereas metastases with a > 1.0 cm diameter all showed pathologic 18F-FET uptake, which did not correlate with lesion size. The highest variability of uptake intensity was observed within the group of melanoma metastases. Conclusion: Untreated metastases predominantly show increased 18F-FET uptake, and only a third of metastases < 1.0 cm were 18F-FET–negative, most likely because of scanner resolution and partial-volume effects. In metastases > 1.0 cm, 18F-FET uptake intensity was highly variable and independent of tumor size (even intraindividually). 18F-FET PET might provide additional information beyond the tumor extent by reflecting molecular features of a metastasis and might be a useful tool for future clinical applications, for example, response assessment.
Brain metastases are secondary intracerebral neoplasms and occur in up to 17% of all cancer patients. Because of the improved treatment options for extracranial primary tumors with consecutive prolonged survival, the incidence of brain metastases is expected to increase. The most common originating primary tumors are lung cancer, breast cancer, and malignant melanoma (in sum up to 80% of all metastases) (1).
Systemic treatment usually consists of chemotherapy, immunotherapies, and targeted therapy, which, however, are mostly unable to cross the blood–brain barrier (BBB) (2,3). In brain metastases, treatment options such as whole resection, whole-brain radiation therapy, external fractionated radiotherapy, radiosurgery, and brachytherapy (4,5) are frequently used; additionally, recent experimental developments are heading toward new immunotherapies being able to cross the BBB (6).
Currently, contrast-enhanced standard MRI represents the diagnostic gold standard in the clinical management of patients with brain metastases (7). However, the diagnostic performance of this technique is limited regarding the differentiation between primary and secondary intracerebral malignancies, tumor delineation, differentiation of recurrent brain metastasis from posttherapeutic effects, and providing prognostic information in newly diagnosed brain tumors (8,9). Thus, there is an increasing demand for additional imaging options.
Regarding the diagnostic evaluation of intracerebral neoplasms, molecular imaging using PET has gained great importance. Particularly, radiolabeled amino acids such as O-(2-18F-fluoroethyl)-l-tyrosine (18F-FET) were reported to be particularly useful in glioma patients, for example, for biopsy guidance, planning of surgery and radiotherapy (10–12), as well as in secondary neoplasms for the differentiation between treatment-related changes from viable tumoral tissue (13). Furthermore, patterns of time–activity-curves and minimal time-to-peak (TTPmin) values derived from dynamic 18F-FET PET provide more detailed information on glioma characteristics. For example, it has been demonstrated that dynamic 18F-FET PET parameters have a high prognostic value in newly diagnosed low- and high-grade glioma (14,15). In secondary cerebral neoplasms, a few PET studies on pretreated brain metastases are currently available and have assessed the value of amino acid PET for the differentiation of recurrent disease from radiation-induced changes after radiotherapy (13,16–19). A recent study compared the tumor volume of partly untreated brain metastases in 18F-FET PET and MRI, but there were criticisms regarding the methodology of that study (20,21). Up to now, no dynamic 18F-FET PET study has evaluated the uptake characteristics of brain metastases at initial diagnosis before local treatment. Thus, we analyzed characteristics of newly diagnosed and untreated brain metastases using static and dynamic 18F-FET PET with respect to the originating primary tumor.
MATERIALS AND METHODS
Patients
Patients with brain metastases and available 18F-FET PET examination between the years 2008 and 2015 at the University of Munich, Munich, Germany (LMU), and Research Center Juelich, Germany (FZJ), were retrospectively identified. All newly diagnosed metastases without prior local therapy (i.e., whole-brain radiation therapy, radiosurgery, external fractionated radiotherapy, brachytherapy, or resection) were included in the study. The study was approved by the ethical review board of the LMU. All patients gave written informed consent before each 18F-FET PET investigation as part of the clinical routine.
PET Acquisition and Data Evaluation
Dynamic 18F-FET PET scans were acquired with an ECAT Exact HR+ scanner (Siemens) at LMU and FZJ according to the standard protocols of both centers (22,23). Both static and dynamic 18F-FET PET were evaluated on a Hermes workstation (Hermes Medical Solutions) as described previously (22). For the assessment of the maximal tumor-to-background ratio (TBRmax), the maximal SUV of the tumor was divided by the mean background activity in the healthy contralateral hemisphere. Furthermore, the biologic tumor volume (BTV) was estimated by semiautomatic calculation of a volume of interest using a threshold of TBR ≥ 1.6, which has been proposed as an optimal threshold between tumor and surrounding healthy tissue (24). Accordingly, the mean tumor-to-background ratio (TBRmean) was evaluated as the mean uptake within the BTV; when no BTV could be delineated because of 18F-FET uptake below the threshold of 1.6, the TBRmean was determined within a volume of interest based on the corresponding contrast enhancement in the spatially coregistered MRI.
As also described previously (25), dynamic PET data were evaluated according to standardized clinical procedures using the software PET Display Dynamic implemented in the Hermes workstation: the early summation images (10–30 min after injection) were used to generate a 90% isocontour region of interest, which was applied to the dynamic PET images to extract the time–activity curves slice by slice. Within 40 min after injection, a time–activity curve grading of all time–activity curves of each metastasis was performed according to the following classifications: solely increasing time–activity curves, predominantly increasing time–activity curves, mixed time–activity curve patterns, predominantly decreasing time–activity curves, and solely decreasing time–activity curves. Time–activity curve grades 1–2 were then classified as increasing time–activity curves and grades 3–5 as decreasing time–activity curves. Additionally, the TTP was assessed in each slice within the tumor and the shortest TTP in at least 2 consecutive slices was defined as TTPmin, as previously published (15). At the FZJ, dynamic 18F-FET PET imaging was performed as described elsewhere (23).
MRI
Patients underwent routine MRI (1.5 T or 3 T) with a standard head coil before and after administration of a gadolinium-based contrast agent (T1- and T2-weighted). Axial T1-weighted images were obtained from the second cervical vertebral body to the vertex. The maximum diameter of the entire metastatic lesion including all contrast-enhancing areas (diameterce) was measured. Furthermore, to exclude cystic or necrotic tumor parts from the measurements, the volume of the contrast enhancement (VOLce) was evaluated by slice-by-slice volumetry by an experienced radiologist. In 2 patients with 2 metastases, the evaluation of diameterce and VOLce, however, was based on contrast-enhanced CT only. Because of the spatial resolution of the ECAT scanner, only metastases with a diameterce > 0.5 cm were included in the analysis.
Statistics
Statistical analysis was performed with SPSS Statistics (version 23; IBM). Descriptive statistics were used for patient characteristics and 18F-FET PET data including the TTPmin, TBRmax, TBRmean, BTV, diameterce, and VOLce. Normal distribution was assessed using the Shapiro–Wilk test. Spearman correlation was used to evaluate the correlations of TBRmax, TBRmean, BTV, diameterce, and VOLce. Distributions between particular groups were evaluated using a χ2 test. Continuous and not normally distributed parameters were compared using the Mann–Whitney-U test and Kruskal–Wallis test, respectively. Statistical significance was defined as 2-tailed P values below 0.05.
RESULTS
Patient Characteristics
Forty-five metastatic lesions in 30 patients (16 women; median age, 68.0 y; range, 17.0–86.0 y) were included in the study. Overall, 34 18F-FET PET scans were analyzed. Of those, 27 18F-FET PET scans were obtained between 2008 and 2015 at the Department of Nuclear Medicine, LMU, Munich, Germany, and 7 scans between 2008 and 2013 at the Institute of Neuroscience and Medicine, FZJ, Juelich, Germany. Fourteen of 30 patients had lung cancer (16 metastases), 4 patients breast cancer (5 metastases), and 10 patients malignant melanoma (22 metastases). Additionally, 1 patient had Ewing sarcoma and 1 a cancer of unknown primary (1 metastasis each) (Table 1). A histopathologic confirmation of the brain metastases was performed in 19 of 30 patients (63%) patients (12 patients at LMU and 7 patients at FZJ).
Overview of MRI and Static 18F-FET PET Parameters
Twenty-five patients with 34 brain metastases did not receive any chemotherapy that was able to cross the BBB before the 18F-FET PET scan. Concurrently or within 6 mo before 18F-FET PET imaging, 5 patients with 11 metastatic lesions received chemotherapy that was able to cross the BBB (all included metastatic lesions are provided in Supplemental Table 1 [supplemental materials are available at http://jnm.snmjournals.org]).
Overall Static and Dynamic 18F-FET PET and MRI Characteristics
All metastatic lesions showed contrast enhancement. Forty metastases (89%) were 18F-FET–positive and had a TBRmax ≥ 1.6 (median TBRmax, 2.53 and range, 1.64–9.47; median diameterce,, 2.1 cm and range, 0.6–6.0 cm; median VOLce,, 4.57 mL and range, 0.14–63.10 mL).
Five brain metastases (11%) had a TBRmax < 1.6 and were classified as 18F-FET–negative (median TBRmax, 1.34; range, 1.25–1.50). All of them had a diameterce of ≤ 1.0 cm (median, 0.8 cm and range, 0.7–1.0 cm; median VOLce, 0.18 mL and range, 0.05–0.93 mL). However, among all metastases with a diameterce of ≤ 1.0 cm (n = 14), 9 metastases (64%) were 18F-FET–positive (median TBRmax, 2.01; range, 1.78–7.35). Table 1 provides further specifications.
The analysis of the TBRmean in 18F-FET–positive metastases revealed a median value of 1.86 (range, 1.63–5.48). The median BTV in the overall group was 3.59 mL (range, 0.04–23.98 mL). Table 1 provides further specifications.
Thirty-nine metastases were eligible for the dynamic analysis. In the whole cohort, a wide range of TTPmin was observed (median, 22.5 min; range, 4.5–47.5 min; Fig. 1) as well as both increasing and decreasing time–activity curves. Time–activity curves were increasing in 12 metastases and decreasing in 27 metastases throughout all pathologic subgroups.

Distribution of TTPmin in metastases eligible for dynamic 18F-FET PET imaging. n.a. = not available; n.e. = not evaluable.
In the subgroup of patients with multiple metastatic lesions (8 patients with 24 metastases), 4 patients showed concordant time–activity curves in the intraindividual multiple metastases, whereas 4 patients showed discordant time–activity curves. Additionally, the intraindividual metastases showed an identical TTPmin in only 3 patients, whereas in 5 patients the TTPmin differed considerably.
Static and Dynamic 18F-FET PET and MRI Characteristics in Relation to Primary Tumor
Four of 5 18F-FET–negative metastases originated from malignant melanoma (median diameterce, 0.9 cm; range, 0.7–1.0 cm), no metastasis from lung cancer, and 1 metastasis from breast cancer (diameterce, 0.7 cm), respectively. However, there was no significantly different distribution of 18F-FET–negative metastases throughout the subgroups of originating entities (P = 0.186; Table 1 provides further specifications).
There was no significantly different median diameterce (P = 0.435), VOLce (P = 0.323), TBRmax (P = 0.572), TBRmean (P = 0.534), or BTV (P = 0.520) among the 3 major groups of 18F-FET–positive metastases.
Lung cancer metastases exhibited high 18F-FET uptake even in small lesions of ≤ 1.0 cm (median TBRmax, 2.61 and range, 1.64–5.10; diameterce, 2.1 cm and range, 0.8–6.0 cm), which did not show any correlation with MRI metrics (TBRmax and diameterce, R = 0.246, P = 0.358; TBRmax and VOLce, R = 0.126, P = 0.641; Fig. 2 provides an example).
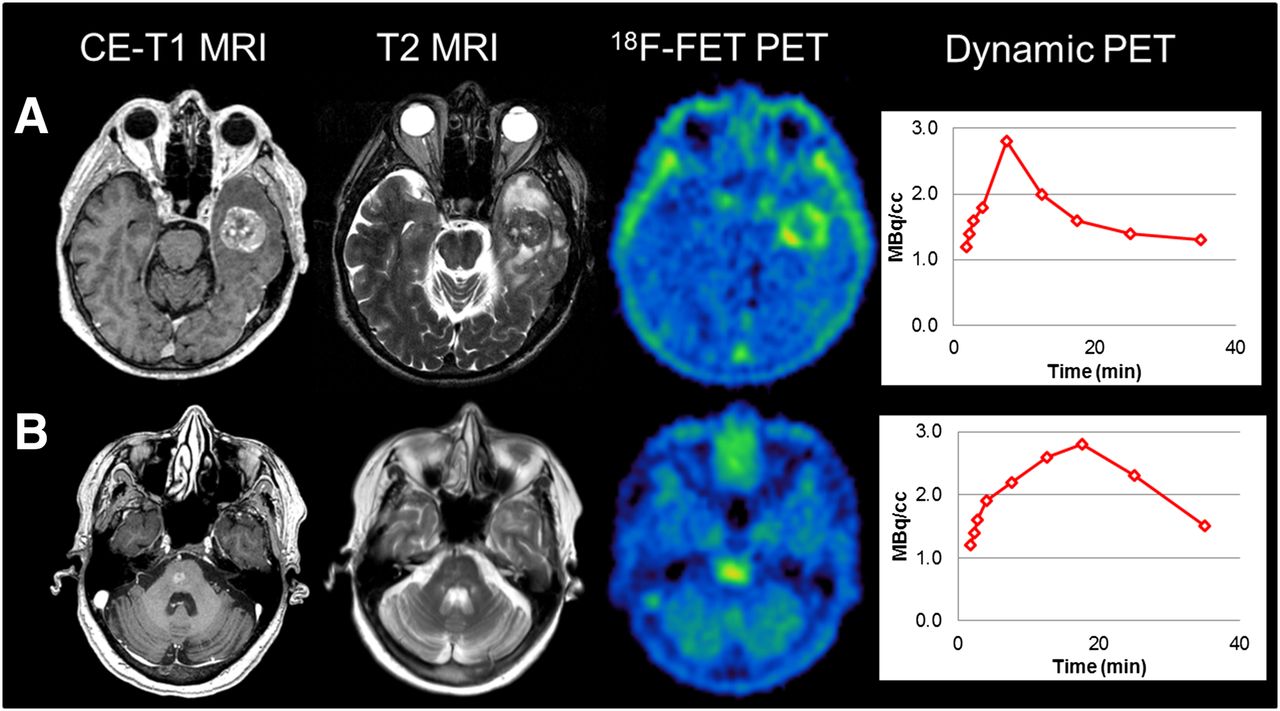
Two patients with metastatic lesions originating from lung cancer. (A) Diameterce: 3.6 cm, VOLce: 10.01 mL, TBRmax: 3.09, TBRmean: 2.07, BTV: 7.68 mL, and decreasing time–activity curve (TTPmin, 7.5 min). (B) Diameterce: 0.8 cm, VOLce: 0.22 mL, TBRmax: 2.46, TBRmean: 1.89, BTV: 2.11 mL, and decreasing time–activity curve (TTPmin, 17.5 min).
Malignant melanoma metastases had the highest variability of 18F-FET uptake, spanning a wide range of TBRmax values (1.25–9.47) with extraordinarily high individual uptake values (Fig. 3). Additionally, there was no significant correlation of TBRmax and VOLce (R = 0.189, P = 0.453) or TBRmax, and diameterce (R = 0.051, P = 0.842) could be observed. In the case of breast cancer metastases, no correlation analyses were performed because of the small number of data points (n = 5).

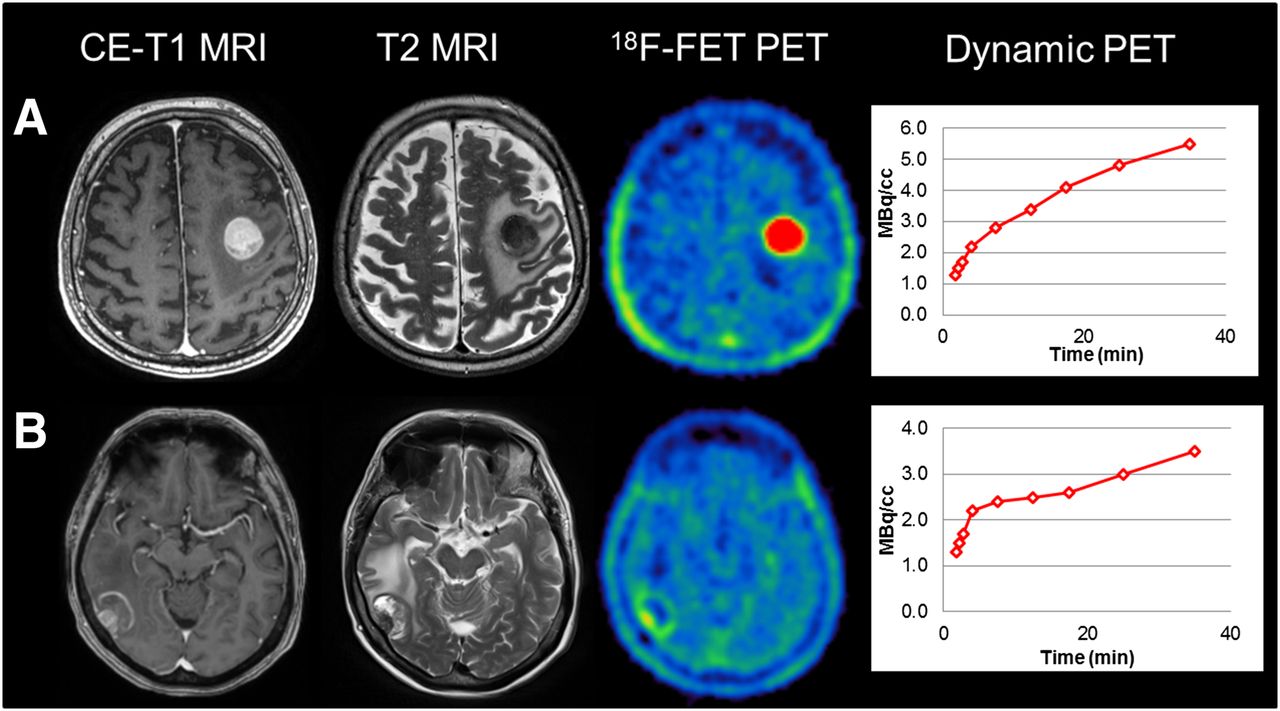
Two patients with metastatic lesions originating from malignant melanoma. (A) Diameterce: 2.8 cm, VOLce: 10.01 mL, TBRmax: 9.47, TBRmean: 3.71, BTV: 10.95 mL, and increasing time–activity curve (TTPmin, 35 min). (B) Diameterce of entire metastatic lesion: 2.9 cm, VOLce: 5.08, TBRmax: 2.28, TBRmean: 1.73, BTV: 3.27 mL, and increasing time–activity curve (TTPmin, 35 min).
In line with the correlations to TBRmax, the correlations of TBRmean with the MRI parameters revealed results similar to those displayed in Table 2.
Correlation of MRI Metrics and PET Parameters of 18F-FET–Positive Metastases
The MRI-derived volume VOLce showed a significant correlation with the PET-derived BTV (R = 0.630; P < 0.001) in the whole cohort as well as similar high correlations throughout the pathologic subgroups (Table 2).
For TTPmin in the dynamic evaluation, a wide range could be observed throughout the subgroups without particular tendency in the pathologic subgroups, but a high portion of cases with decreasing time–activity curves and early TTPmin throughout the whole cohort.
PET Findings in Relation to Chemotherapy Crossing BBB
In 8 18F-FET–positive metastases, a systemic chemotherapy able to cross the BBB was administered concurrently or within 6 mo before the 18F-FET PET scans (32 without chemotherapy). Regarding the 18F-FET PET–derived parameters TBRmax, TBRmean, and BTV as well as the VOLce and diameterce, a prior or concurrent chemotherapy did not have a significant impact on these parameters when compared with metastases without chemotherapy (Table 3). Furthermore, there was a heterogeneous distribution of time–activity curves and TTPmin throughout those 2 groups.
Influence of BBB-Crossing Chemotherapy on PET and MRI Parameters in 18F-FET–Positive Metastases
DISCUSSION
Although literature exists describing a high diagnostic accuracy of amino acid PET for the differentiation of viable tumor from treatment-related effects in pretreated brain metastases, there is only limited literature regarding the characteristics of newly diagnosed and untreated brain metastases using 18F-FET PET.
In the present study, most patients with newly diagnosed brain metastases without local pretreatment showed increased 18F-FET uptake. Although all metastases with a diameterce of ≤ 0.5 cm were excluded from our study, some cases revealed no 18F-FET uptake exceeding the background activity (11%). This might be explained best by the small tumor size, because all 18F-FET–negative metastases (in our series only breast cancer and melanoma metastases) had a diameter of ≤ 1.0 cm (range, 0.7–1.0 cm). Nonetheless, we observed notable, partly even very high, 18F-FET uptake in small lesions with a 0.6- to 1.0-cm diameterce as well. Our results therefore suggest that 18F-FET–negative findings may also occur in brain metastases (in our study in one third of metastases ≤ 1.0 cm) but might mostly be related to partial-volume effects and limited scanner resolution, leading to underestimation of 18F-FET uptake especially in tumors with low tracer uptake, rather than to a complete lack of 18F-FET uptake as observed in 30% of low-grade gliomas (14,26). This might especially be the case because a missing expression of the L-amino-acid transporter, responsible for 18F-FET uptake in brain metastases, was reported to be a rare condition itself (27). Therefore, pursuing the 18F-FET PET assessment of metastases with a diameterce of < 1.0 cm is of limited value, because a negative finding not necessarily excludes viable tumor.
In contrast to our study, Gempt et al. did not present any cases of 18F-FET–negative metastases—that is, all metastases were reported to provide a significant 18F-FET uptake (TBR > 1.6) (20). In the study by Gempt et al., however, the lesion size is not mentioned and it remains unclear whether very small lesions were included or the observed increased 18F-FET uptake in all metastases was caused by a selection bias—that is, well-delineated metastases with highly increased 18F-FET uptake eligible for neurosurgic resection might have been included in this retrospective study.
Although there was no tumor subtype in our study with a characteristic 18F-FET uptake that can be clearly distinguished from other subtypes, metastases originating from different primary tumors showed different uptake behavior. In our cohort, all metastases from lung cancer showed pathologic 18F-FET uptake, which was independent of the lesion size. Therefore, even small metastases with a ≤ 1.0-cm diameterce could easily be detected by increased 18F-FET uptake.
Interestingly, a high variability of uptake intensity could be observed within the group of metastatic lesions originating from malignant melanoma—that is, both smaller and larger metastases could show remarkably low as well as high TBRmax and TBRmean values. In patients with multiple metastases derived from malignant melanoma, this could even be observed intraindividually. This variable 18F-FET uptake might be attributed to different malignant melanoma metastasis subtypes, for example, amelanotic melanoma histology, which could not be assessed in all cases because of the missing histopathologic confirmation. Furthermore, general heterogeneity of brain metastases could be discussed as cause as well (28,29).
Regarding the dynamic 18F-FET PET evaluation, a broad distribution of time–activity curves and TTPmin throughout all metastatic subgroups could be observed, indicating that metastases of a particular primary tumor do not have specific characteristic patterns in dynamic 18F-FET PET, whereas, notably, a high portion of metastases throughout the entire cohort provided decreasing time–activity curves with early TTPmin. Whether dynamic PET parameters before further therapies do have a prognostic value at initial diagnosis, such as shown in primary gliomas (14,15), has to be evaluated in prospective settings. Additionally, all metastatic lesions showed time–activity curves characteristic for brain neoplasms, whereas no time–activity curve with a shape specific for vascular structures was seen. Although it is intriguing to speculate that the 18F-FET signal might be a result of higher blood volume in brain metastases due to, for example, neovascularization, the characteristic nonvascular time–activity curves renders a major impact of the blood volume on the tumoral 18F-FET uptake unlikely. Also a mere 18F-FET influx through the disrupted BBB can be excluded (30), because a BBB disruption is also seen in nontumorous lesions such as radionecrosis, but without pathologic 18F-FET uptake (16). Therefore, as in gliomas, tumoral 18F-FET uptake in metastases is also attributed to the L-amino-acid transporter (27).
A further interesting aspect is the comparison of 18F-FET parameters with the MRI metrics. Notably, in 18F-FET–positive metastases there was no correlation of the 18F-FET uptake intensity (TBRmax and TBRmean) with the maximal metastatic lesion diameterce as well as the VOLce. The volume of the contrast-enhancing tumor parts was included in our study, as the mere 1-dimensional metric information using the maximal diameter for brain metastases assessment is a controversial issue (7) because of the broad heterogeneity of morphologic appearance with regard to shape and structure of metastatic lesions. The proposed Revised Assessment in Neuro-Oncology criteria for brain metastases suggest a measurement of only solid tumor parts in 1 dimension, whereas cystic or necrotic metastases are defined as nonmeasurable lesions and therefore remain a particular challenge for morphologic imaging alone (7) and, consequently, for response assessment. Therefore, the volume of the contrast-enhancing tumor parts was suggested as a possibly more accurate assessment parameter for brain metastases (7,31). In our study, we could observe a significant correlation of VOLce and BTV throughout all groups under investigation (R = 0.630; P < 0.001) with a threshold of TBR ≥ 1.6, which was derived from glioma studies. Whether there is a specific threshold for the BTV estimation in secondary brain tumors needs to be evaluated in future combined PET and histopathology studies using stepwise biopsies. In contrast, there was no correlation of the 18F-FET uptake intensity with the VOLce; this suggests that the uptake intensity in 18F-FET PET represents an additional aspect beyond the tumoral extent of a metastatic lesion by possibly reflecting molecular features in terms of biologic tumor behavior, which cannot be assessed with mere morphologic imaging. Besides the well-known clinical value regarding the differentiation of viable tumor and treatment-related changes, these particular features might be of special interest for clinical applications in yet untreated metastatic lesions regarding prognostication as well as response assessment of brain metastases. These interesting aspects need to be addressed in future studies.
Additionally, some limitations of this study should be addressed. First, limitations arise from the retrospective study design. Second, although the same type of PET scanner was used in both participating sites, there are minor differences in the dynamic scanning protocol (e.g., different number of frames and frame durations). Nonetheless, both imaging protocols are in line with German and European Association of Nuclear Medicine guidelines for PET imaging of brain tumors (32,33). Third, histology of newly diagnosed brain metastases could not be obtained in all cases. It is desirable to validate 18F-FET PET by histopathology, but because of a poor clinical condition or patient refusal, in a considerable number of patients histopathology could not be obtained, which is an intrinsic limitation of retrospective studies. The accuracy of diagnosis can be assumed because the included patients were with known extracranial tumors with—most likely—consecutive cerebral metastases during the course of the disease. In the single case of cancer of unknown primary, histology could be obtained. Fourth, the number of examined patients is relatively low, particularly the number of breast cancer metastases. On the other hand, this is up to now the largest study of newly diagnosed brain metastases.
CONCLUSION
Newly diagnosed and locally untreated brain metastases predominantly showed increased 18F-FET uptake. Only a third of metastases ≤ 1.0 cm was 18F-FET–negative, most likely because of the scanner resolution and partial-volume effects. In metastases > 1.0 cm, 18F-FET uptake intensity showed a high variability independent of tumor size (even intraindividually), so that 18F-FET PET might provide additional information reflecting biologic tumor behavior and molecular features beyond the morphologic tumor extent. New clinical applications of 18F-FET PET as a complementary tool might arise for brain metastasis imaging.
DISCLOSURE
No potential conflict of interest relevant to this article was reported.
Acknowledgments
Parts of this study originate from the doctoral thesis of Lara-Caroline Kowalew.
Footnotes
Published online Oct. 6, 2016.
- © 2017 by the Society of Nuclear Medicine and Molecular Imaging.
REFERENCES
- Received for publication June 30, 2016.
- Accepted for publication September 12, 2016.


