


Article Figures & Data
Figures
- FIGURE 1.
Patient selection.
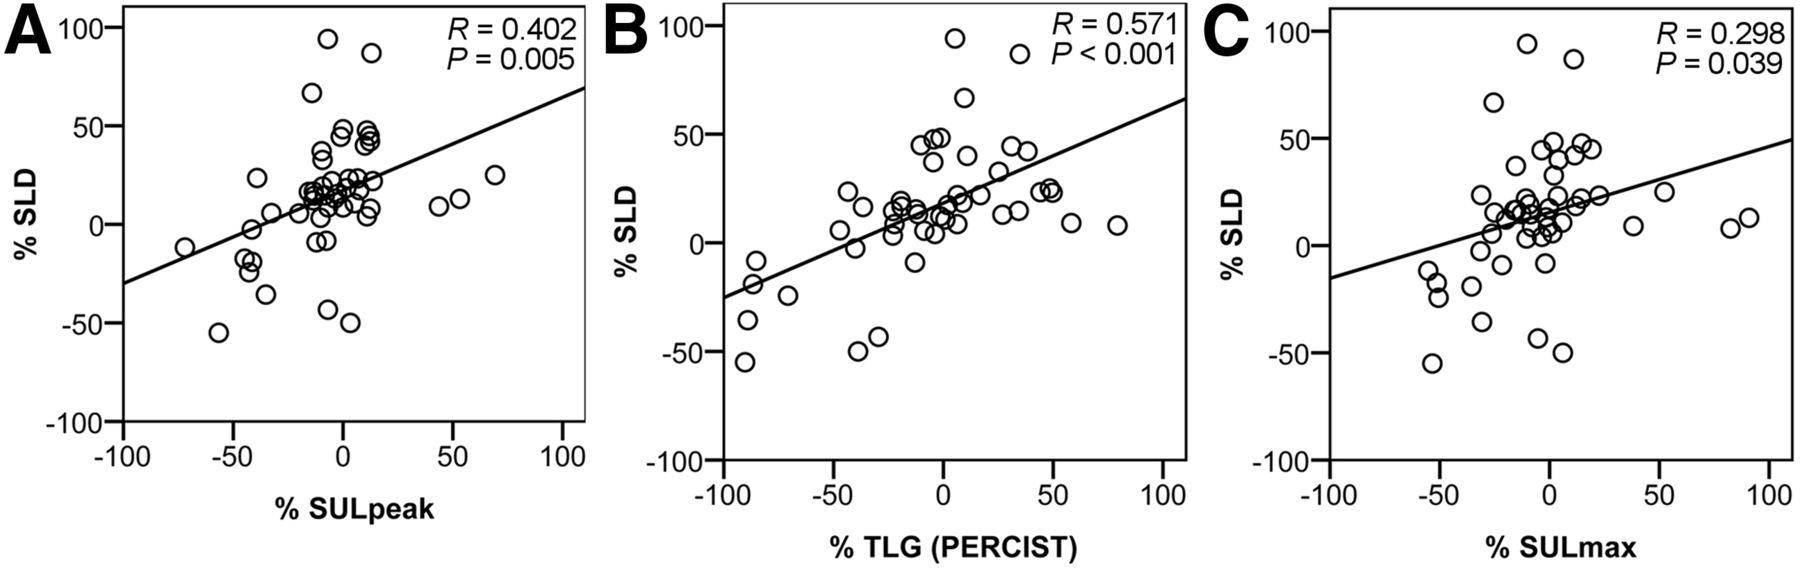
- FIGURE 2.
Correlation between SULpeak (A), TLG (PERCIST) (B), and SULmax (C) at 7–10 d and SLD measured on CT scans performed after 9–11 wk.
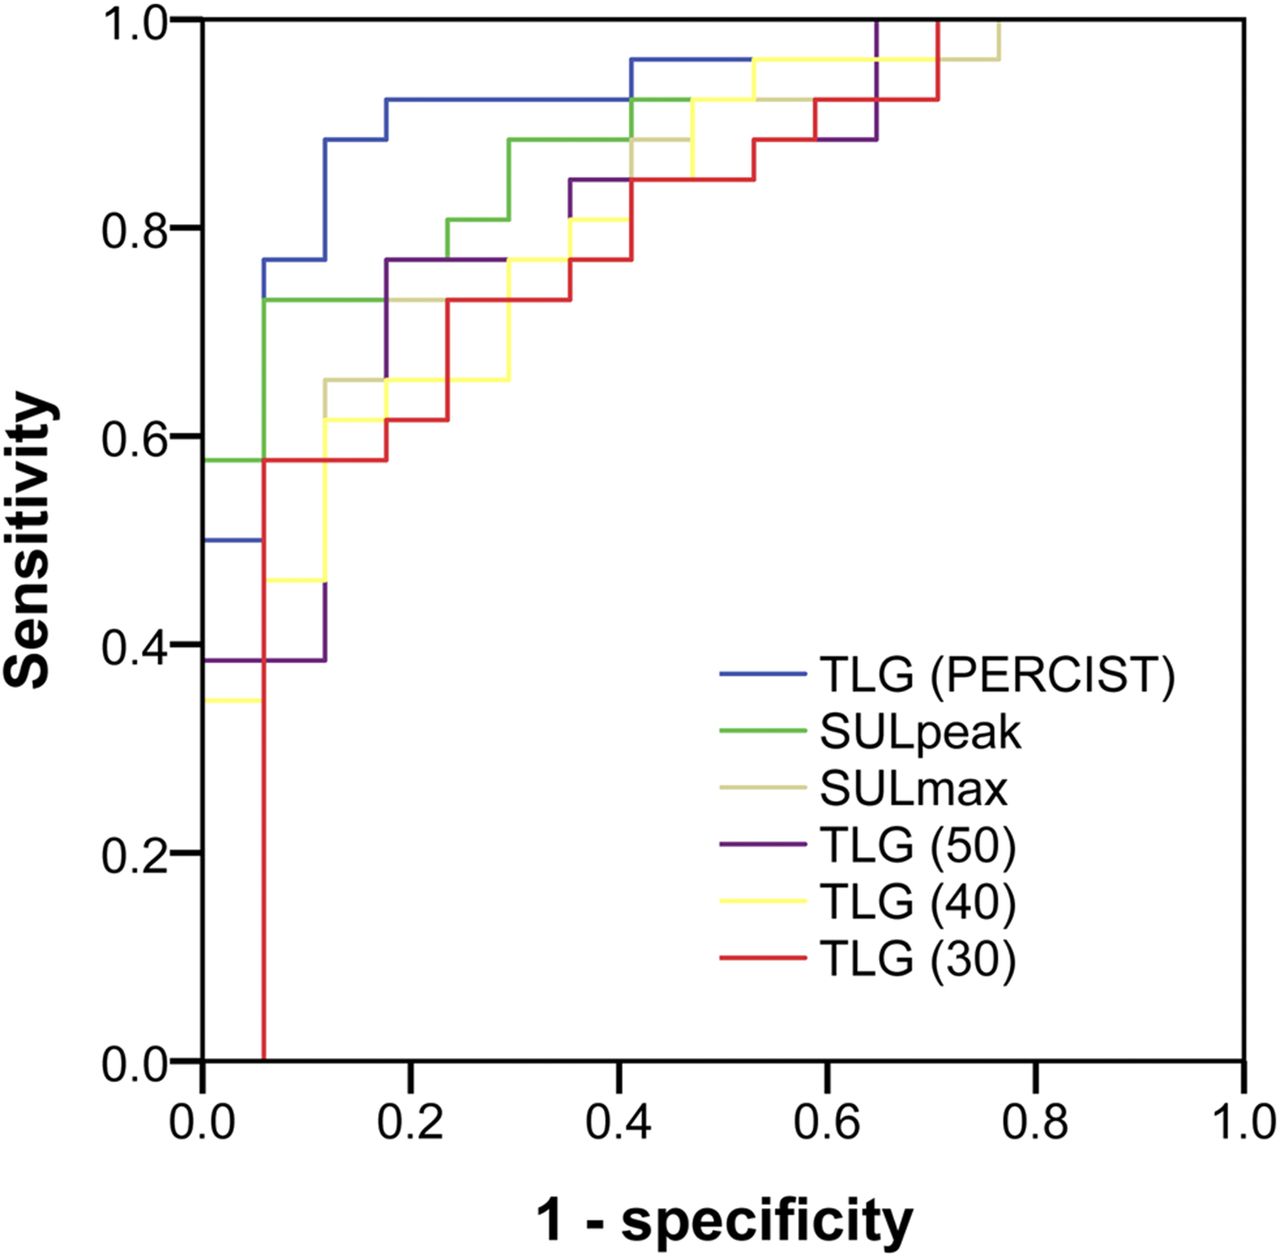
- FIGURE 3.
ROC curves for SULpeak, SULmax, and various TLG variations. Curves illustrate parameters’ ability to predict PD on later CT scan obtained after 9–11 wk of treatment. Curves represent data from 43 patients who were analyzable by all methods.
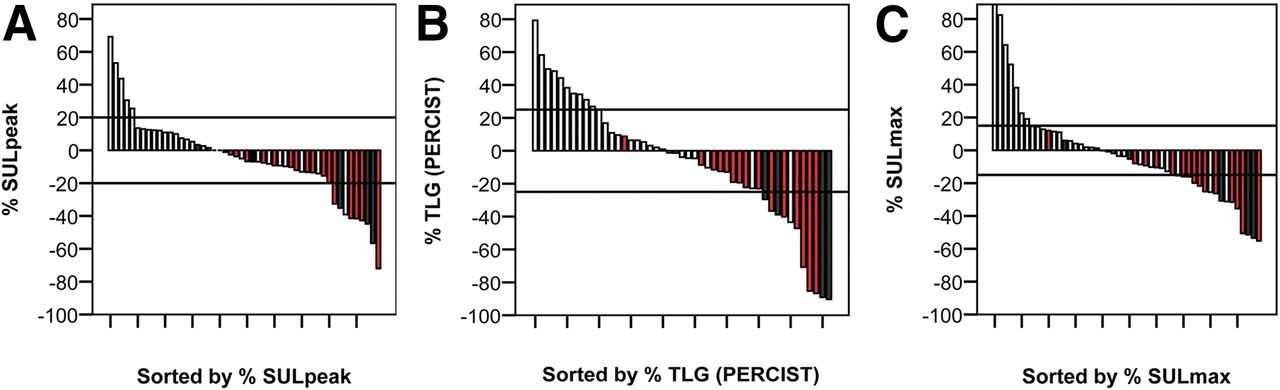
- FIGURE 4.
Waterfall plots for SULpeak (A), TLG (PERCIST) (B), and SULmax (C) showing distribution of CT categories (light gray = PD, red = SD, and black = PR). Horizontal reference lines represent optimal cutoff for PMR and PMD. For SULmax, the horizontal reference lines represent 15% change suggested by European Organisation for Research and Treatment of Cancer criteria for early evaluation.


Tables
Imaging method Median baseline >4 wk (n) >2 wk (n) Median follow-up Early CT (n) CT 15 (range, 4–56) 5 (10%) 26 (52%) 77 (range, 20–85) 14 (28%) 18F-FDG PET/CT 1 (range, 0–21) 8 (range, 2–23) >4 and >2 wk = no. of patients with interval between baseline CT and first day of treatment above 4 (and 2) wk; early CT = no. of patients with a follow-up CT earlier than 9 wk.
Parameter Baseline Follow-up Numeric difference PERCIST 1.0 Adherence to PERCIST 1.0 Injected activity (MBq) Mean ± SD 340 ± 90 335 ± 87 18 ± 14 Baseline ± 20% 100% (50/50) Range 197–609 199–618 0–54 Glucose level (mmol/L) Mean ± SD 6.3 ± 0.9 6.4 ± 0.9 0.4 ± 0.5 <11 mM 100% (50/50) Range 4.6–8.8 4.7–9.0 0.0–1.6 Uptake time (min) Mean ± SD 58.7 ± 4.0 59.3 ± 4.9 5.1 ± 4.19 60 ± 10 min 98% (98/100*) Range 51–69 48–72 0–15 Baseline ± 15 min 100% (50/50) ↵* Uptake time at both baseline and follow-up. Two patients with 48- and 72-min uptake time at follow-up were included because difference between scans in both cases was within ±15 min.
95% CI Sensitivity and specificity equally important Specificity as high as possible Method AUC Lower Upper Sensitivity Specificity Cutoff Sensitivity Specificity Cutoff TLG (PERCIST) 0.923 0.842 1.000 0.89 0.88 −6.6% 0.50 1.00 9.2% SULpeak 0.887 0.791 0.983 0.77 0.82 −6.9% 0.58 1.00 2.1% SULmax 0.835 0.715 0.954 0.73 0.82 −4.5% 0.35 1.00 13.2% TLG 50 0.824 0.698 0.949 0.77 0.82 3.0% 0.39 1.00 30.0% TLG 40 0.821 0.696 0.946 0.77 0.71 −1.4% 0.35 1.00 24.6% TLG 30 0.790 0.645 0.934 0.73 0.76 0.0% 0.58 0.94 11.9% 95% CI = 95% confidence interval; cutoff = corresponding optimal cutoff value for percentage change.
AUCs optimized by identifying point on curve closest to upper left corner (considering sensitivity and specificity equally important [middle columns]) and considering specificity of major importance, thereby avoiding any false progressions [right columns]).
TLG (PERCIST [25%]) SULpeak (20%) Visual CT PMR SMD PMD Total PMR SMD PMD Total PMR SMD PMD Total PR 4 0 0 4 3 2 0 5 4 1 0 5 SD 6 10 0 16 5 12 0 17 5 11 1 17 PD 1 15 11 27 1 19 8 28 1 17 10 28 Total 1 25 11 47 9 33 8 50 10 29 11 50 SD = stable disease.
Method κ (95% CI) Visual 0.47 (0.24–0.70)* SULpeak 30% 0.39 (0.19–0.59) SULpeak 25% 0.41 (0.20–0.62) SULpeak 20% 0.41 (0.20–0.62) SULpeak 20% 0.42 (0.22–0.61)* TLG (PERCIST) 45%/75% 0.25 (NC) TLG (PERCIST) 50% 0.29 (0.20–0.39) TLG (PERCIST) 40% 0.32 (0.16–0.47) TLG (PERCIST) 30% 0.45 (0.24–0.67) TLG (PERCIST) 25% 0.53 (0.31–0.75)* TLG (PERCIST) 20% 0.49 (0.29–0.69) TLG 50, 45%/75% 0.23 (NC) TLG 50, 50% 0.27 (0.17–0.36) TLG 50, 40% 0.25 (0.16–0.33) TLG 50, 30% 0.35 (0.16–0.53) TLG 50, 25% 0.33 (0.12–0.53) TLG 50, 20% 0.38 (0.16–0.61)* TLG 40, 45%/75% 0.27 (NC) TLG 40, 50% 0.34 (0.16–0.52) TLG 40, 40% 0.33 (0.16–0.50) TLG 40, 30% 0.42 (0.18–0.66) TLG 40, 25% 0.44 (0.20–0.69)* TLG 40, 20% 0.43 (0.20–0.66) TLG 30, 45%/75% 0.24 (NC) TLG 30, 50% 0.33 (0.12–0.54) TLG 30, 40% 0.38 (0.14–0.62) TLG 30, 30% 0.32 (0.12–0.53) TLG 30, 25% 0.38 (0.15–0.61) TLG 30, 20% 0.41 (0.18–0.64)* ↵* Highlight of cutoff resulting in highest κ values for each method.
95% CI = 95% confidence interval; NC = not calculable by method used, described by Fleiss et al. (21).
Quadratic weighted κ-values (95% CIs) for all methods analyzed including various cutoffs for response and progression.
Supplemental Data
Files in this Data Supplement:


