
Main menu

  • Home
  • Content
    • Current
    • Ahead of print
    • Past Issues
    • JNM Supplement
    • SNMMI Annual Meeting Abstracts
    • Continuing Education
    • JNM Podcasts
  • Subscriptions
    • Subscribers
    • Institutional and Non-member
    • Rates
    • Journal Claims
    • Corporate & Special Sales
  • Authors
    • Submit to JNM
    • Information for Authors
    • Assignment of Copyright
    • AQARA requirements
  • Info
    • Reviewers
    • Permissions
    • Advertisers
  • About
    • About Us
    • Editorial Board
    • Contact Information
  • More
    • Alerts
    • Feedback
    • Help
    • SNMMI Journals
  • SNMMI
    • JNM
    • JNMT
    • SNMMI Journals
    • SNMMI

User menu

  • Subscribe
  • My alerts
  • Log in
  • My Cart

Search

  • Advanced search
Journal of Nuclear Medicine
  • SNMMI
    • JNM
    • JNMT
    • SNMMI Journals
    • SNMMI
  • Subscribe
  • My alerts
  • Log in
  • My Cart
Journal of Nuclear Medicine

Advanced Search

  • Home
  • Content
    • Current
    • Ahead of print
    • Past Issues
    • JNM Supplement
    • SNMMI Annual Meeting Abstracts
    • Continuing Education
    • JNM Podcasts
  • Subscriptions
    • Subscribers
    • Institutional and Non-member
    • Rates
    • Journal Claims
    • Corporate & Special Sales
  • Authors
    • Submit to JNM
    • Information for Authors
    • Assignment of Copyright
    • AQARA requirements
  • Info
    • Reviewers
    • Permissions
    • Advertisers
  • About
    • About Us
    • Editorial Board
    • Contact Information
  • More
    • Alerts
    • Feedback
    • Help
    • SNMMI Journals
  • View or Listen to JNM Podcast
  • Visit JNM on Facebook
  • Join JNM on LinkedIn
  • Follow JNM on Twitter
  • Subscribe to our RSS feeds
Research ArticleClinical Investigations

A Microdosimetric Analysis of Absorbed Dose to Tumor as a Function of Number of Microspheres per Unit Volume in 90Y Radioembolization

Alexander S. Pasciak, Austin C. Bourgeois and Yong C. Bradley
Journal of Nuclear Medicine July 2016, 57 (7) 1020-1026; DOI: https://doi.org/10.2967/jnumed.115.163444
Alexander S. Pasciak
1Department of Radiology, University of Tennessee Graduate School of Medicine, Knoxville, Tennessee
2School of Medicine, Johns Hopkins Hospital, Baltimore, Maryland; and
  • Find this author on Google Scholar
  • Find this author on PubMed
  • Search for this author on this site
Austin C. Bourgeois
1Department of Radiology, University of Tennessee Graduate School of Medicine, Knoxville, Tennessee
3Department of Radiology, Medical University of South Carolina, Charleston, South Carolina
  • Find this author on Google Scholar
  • Find this author on PubMed
  • Search for this author on this site
Yong C. Bradley
1Department of Radiology, University of Tennessee Graduate School of Medicine, Knoxville, Tennessee
  • Find this author on Google Scholar
  • Find this author on PubMed
  • Search for this author on this site
  • Article
  • Figures & Data
  • Info & Metrics
  • PDF
Loading

Article Figures & Data

Figures

  • Tables
  • FIGURE 1.
    • Download figure
    • Open in new tab
    • Download powerpoint
    FIGURE 1.

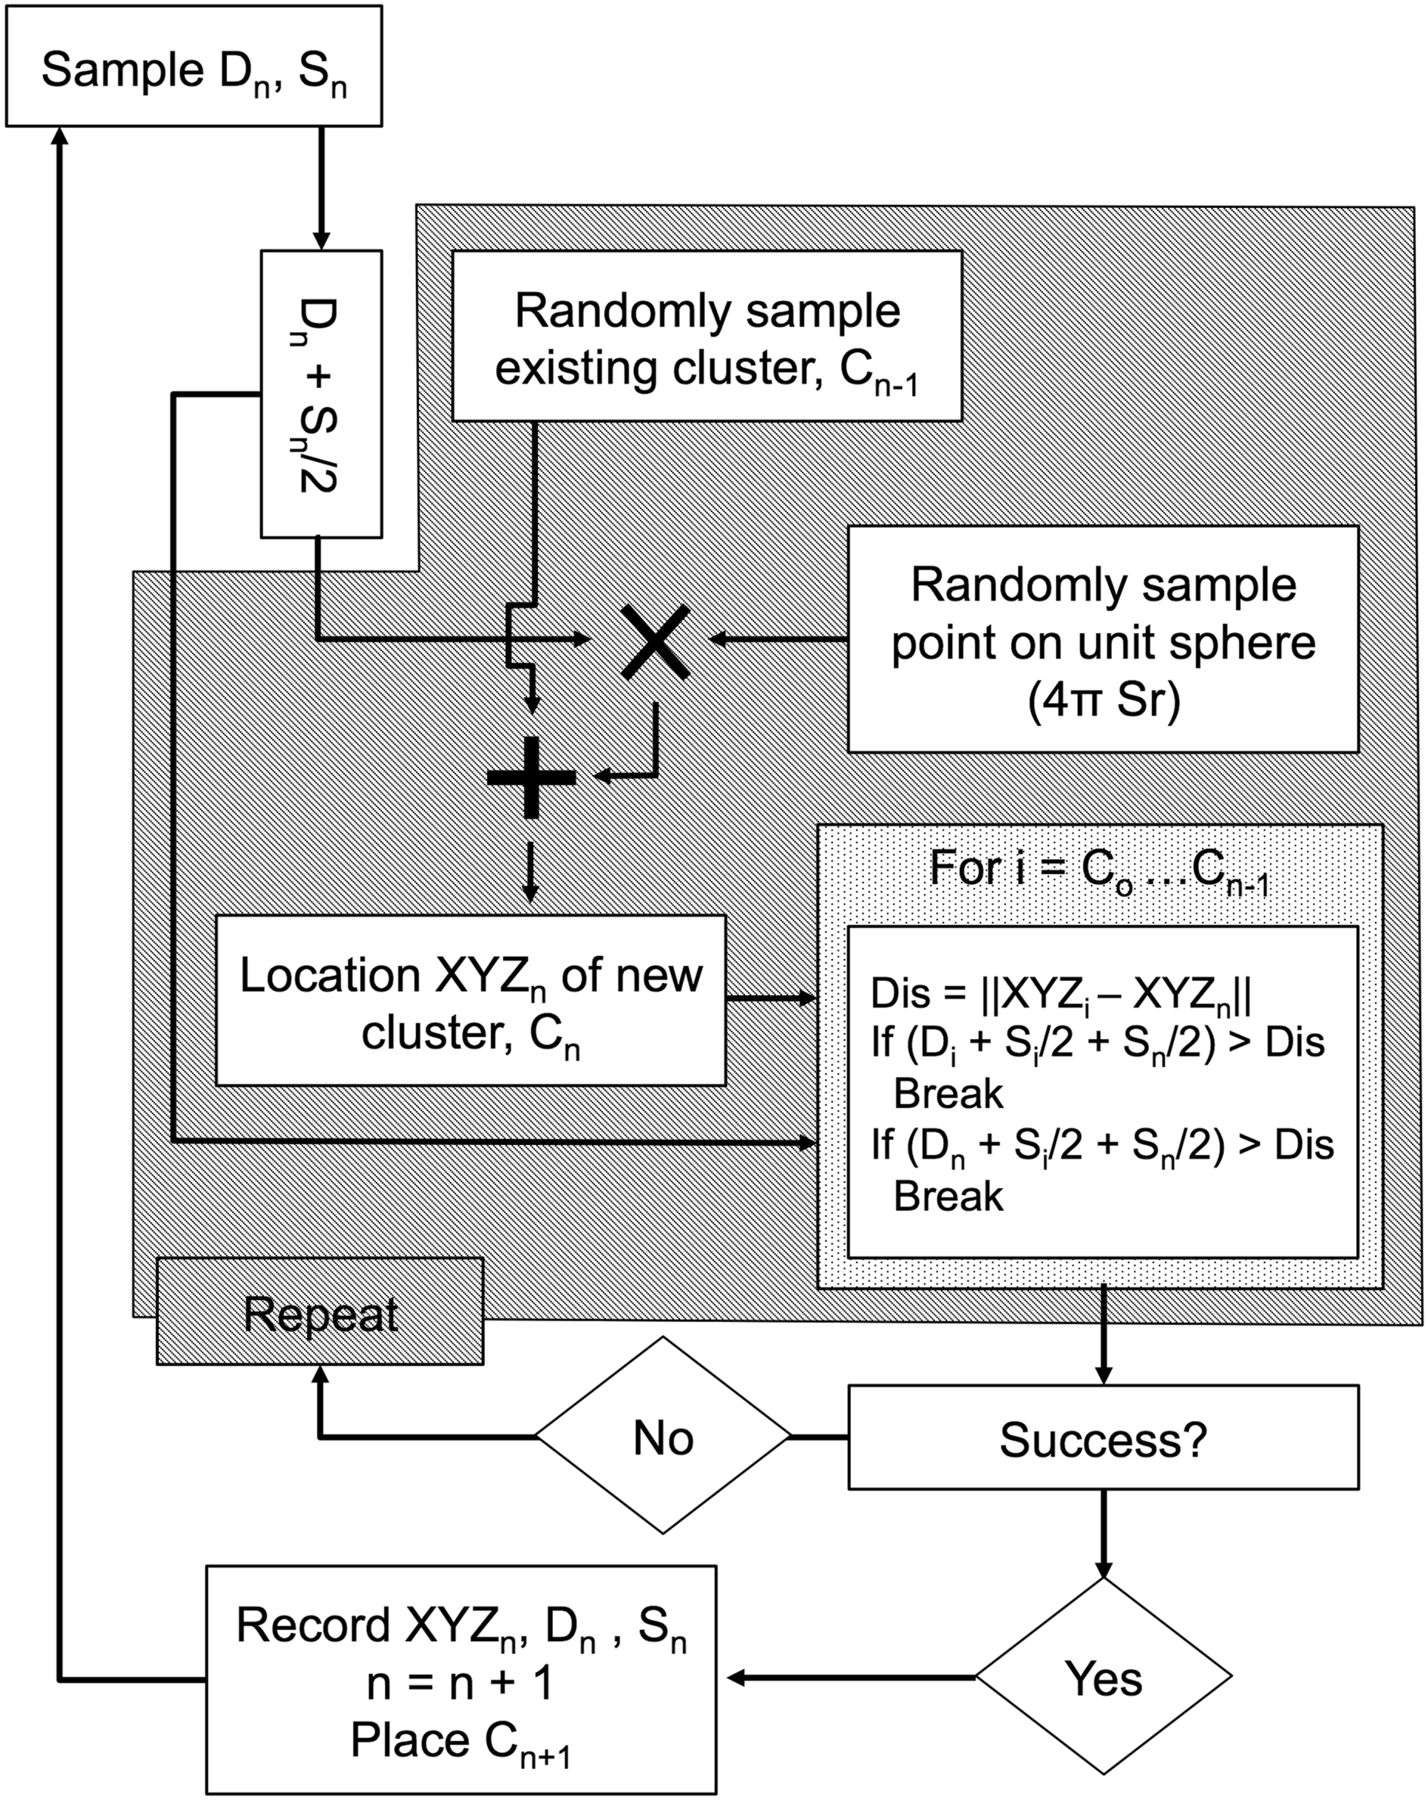
    Simplified flowchart describing algorithm used to identify microsphere cluster locations and size. C = microsphere cluster; D = sampled distance between microsphere clusters; S = cluster size; ||x|| = vector norm operator; XYZ = vector describing spatial coordinates of cluster center.
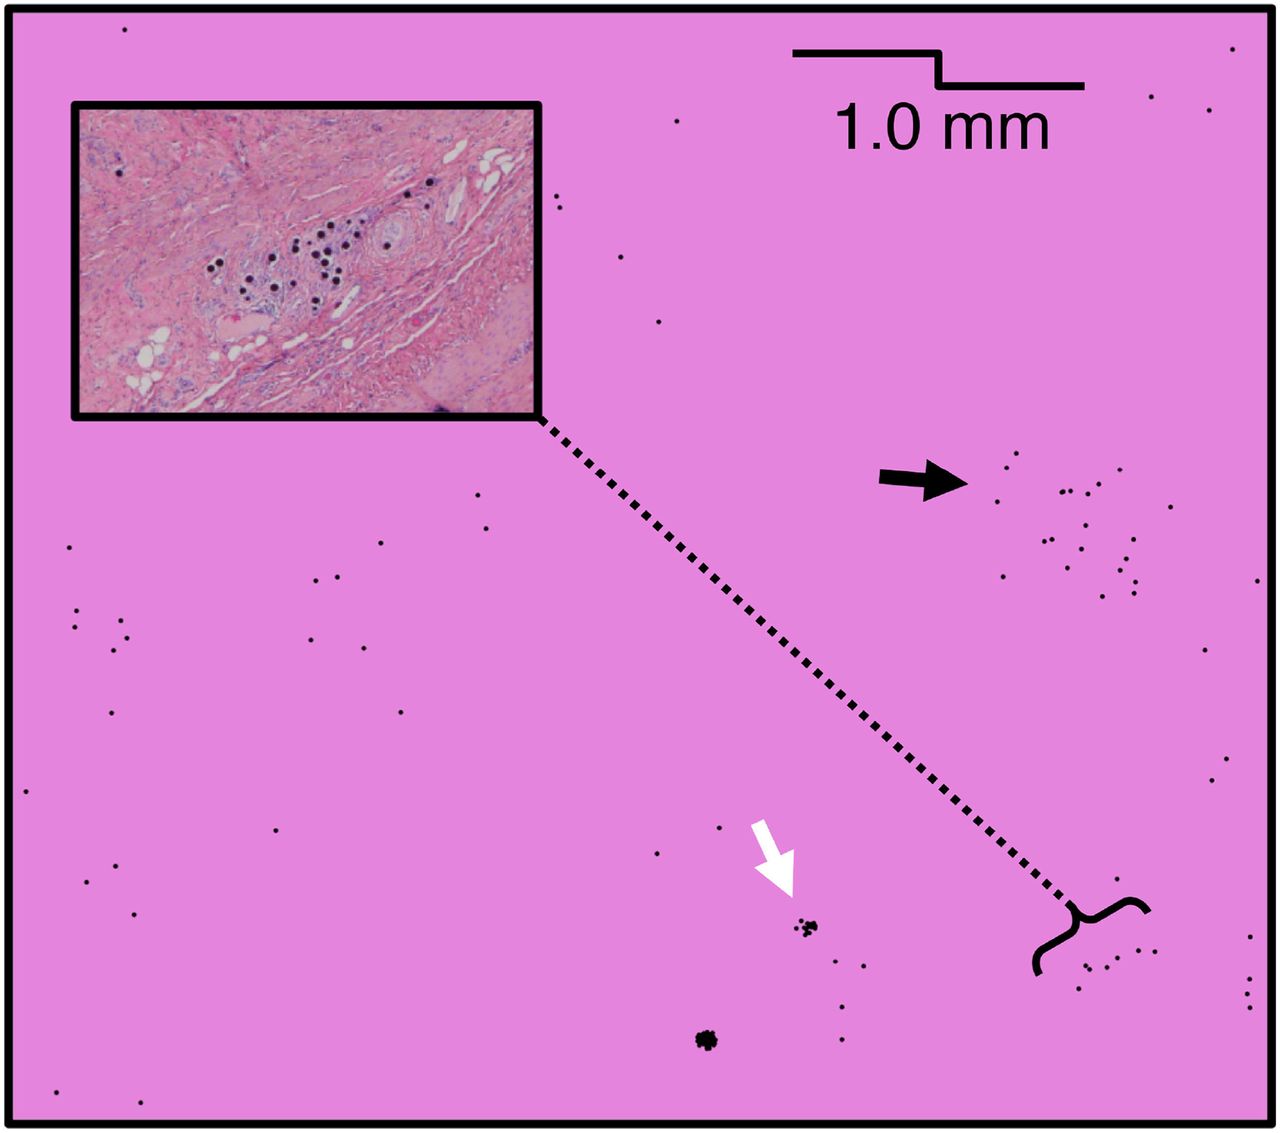
  • FIGURE 2.
    • Download figure
    • Open in new tab
    • Download powerpoint
    FIGURE 2.

    Microscopic deposition of spheres at number density of 50,000 spheres/mL. Small clusters (white arrow) and large clusters (black arrow) are apparent. Monte Carlo process allows for realistic microscopic distribution consistent with experimental findings, including oblique clusters. For comparison, expanded section shows microscopic view of oblique cluster of resin microspheres surrounding arteriole in animal tissue.
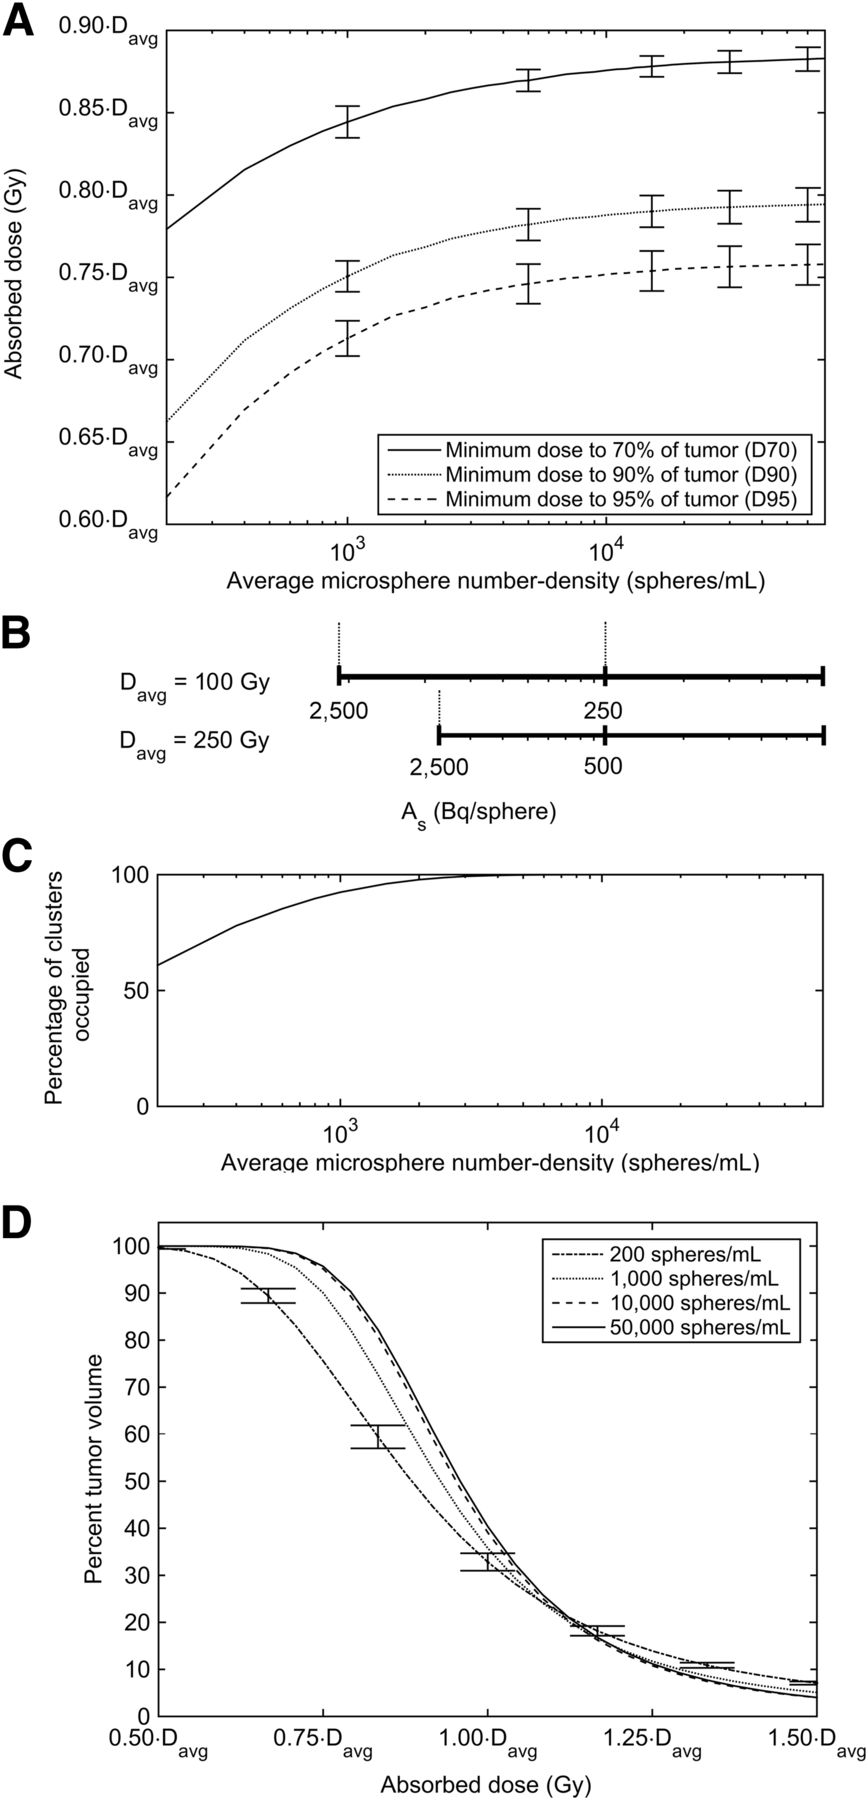
  • FIGURE 3.
    • Download figure
    • Open in new tab
    • Download powerpoint
    FIGURE 3.

    Results of simulations using uniform approach in which Davg is average absorbed dose to tissue volume. (A) D70, D90, and D95 as function of average microsphere-number density. Error bars show SD from 20 independent simulations. (B) Specific-microsphere-activity (As) horizontal axis labels for A with average absorbed doses of 100 and 250 Gy, as computed using Equation 2. (C) Fraction of microscopic clusters populated by at least 1 microsphere as function of average microsphere-number density (D) Dose–volume histograms for microsphere-number densities of 200, 1,000, 10,000, and 50,000 spheres/mL. For clarity, error bars are shown on 200 spheres/mL curve only.

  • FIGURE 4.
    • Download figure
    • Open in new tab
    • Download powerpoint
    FIGURE 4.

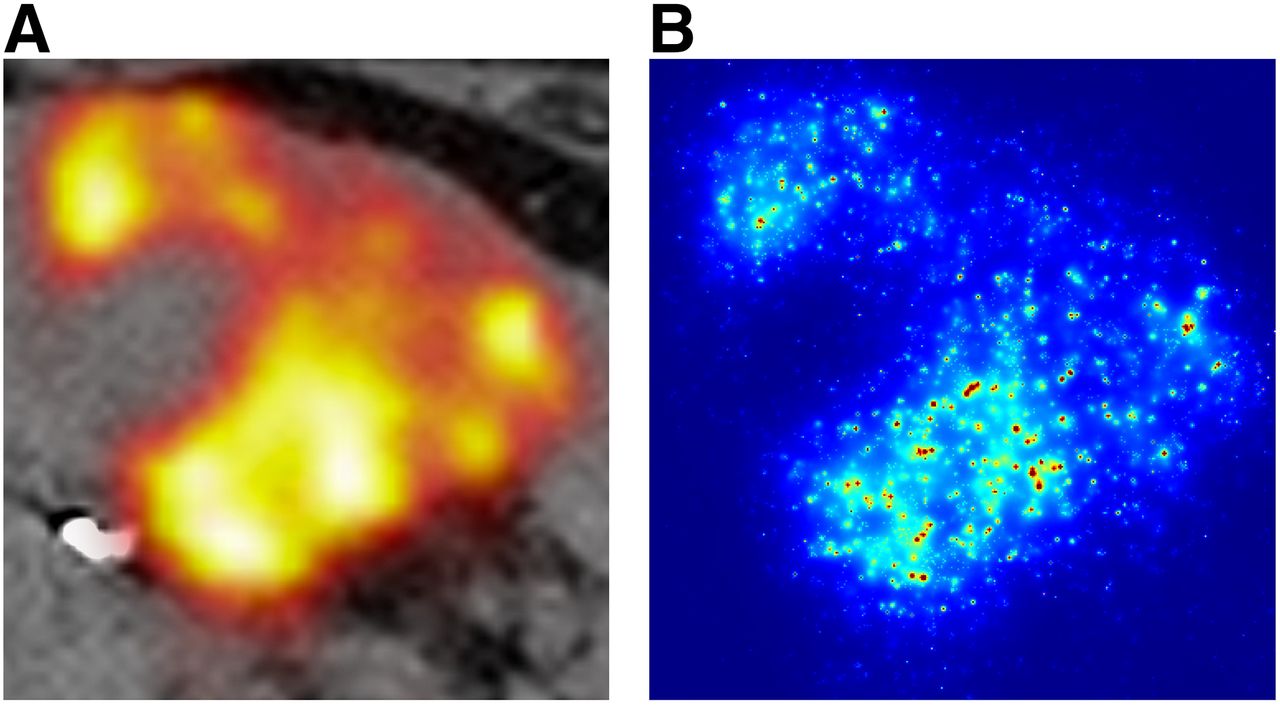
    (A) 90Y PET/CT of left-lobe tumor reveals peripheral deposition of microspheres. (B) Corresponding microdosimetric absorbed-dose heat map of 100-μm slice after population of tumor volume with average number density of 10,000 spheres/mL.

  • FIGURE 5.
    • Download figure
    • Open in new tab
    • Download powerpoint
    FIGURE 5.

    D70 as function of microsphere-number density for all tumors in Table 2, where Davg is average absorbed dose to tumor volume. Error bars have been omitted for clarity. Shaded area represents number densities that result in statistically significant differences with D70 at 50,000 spheres/mL. Average absorbed dose, microsphere-number density, and specific activity per sphere are related in Equation 2.

  • FIGURE 6.
    • Download figure
    • Open in new tab
    • Download powerpoint
    FIGURE 6.

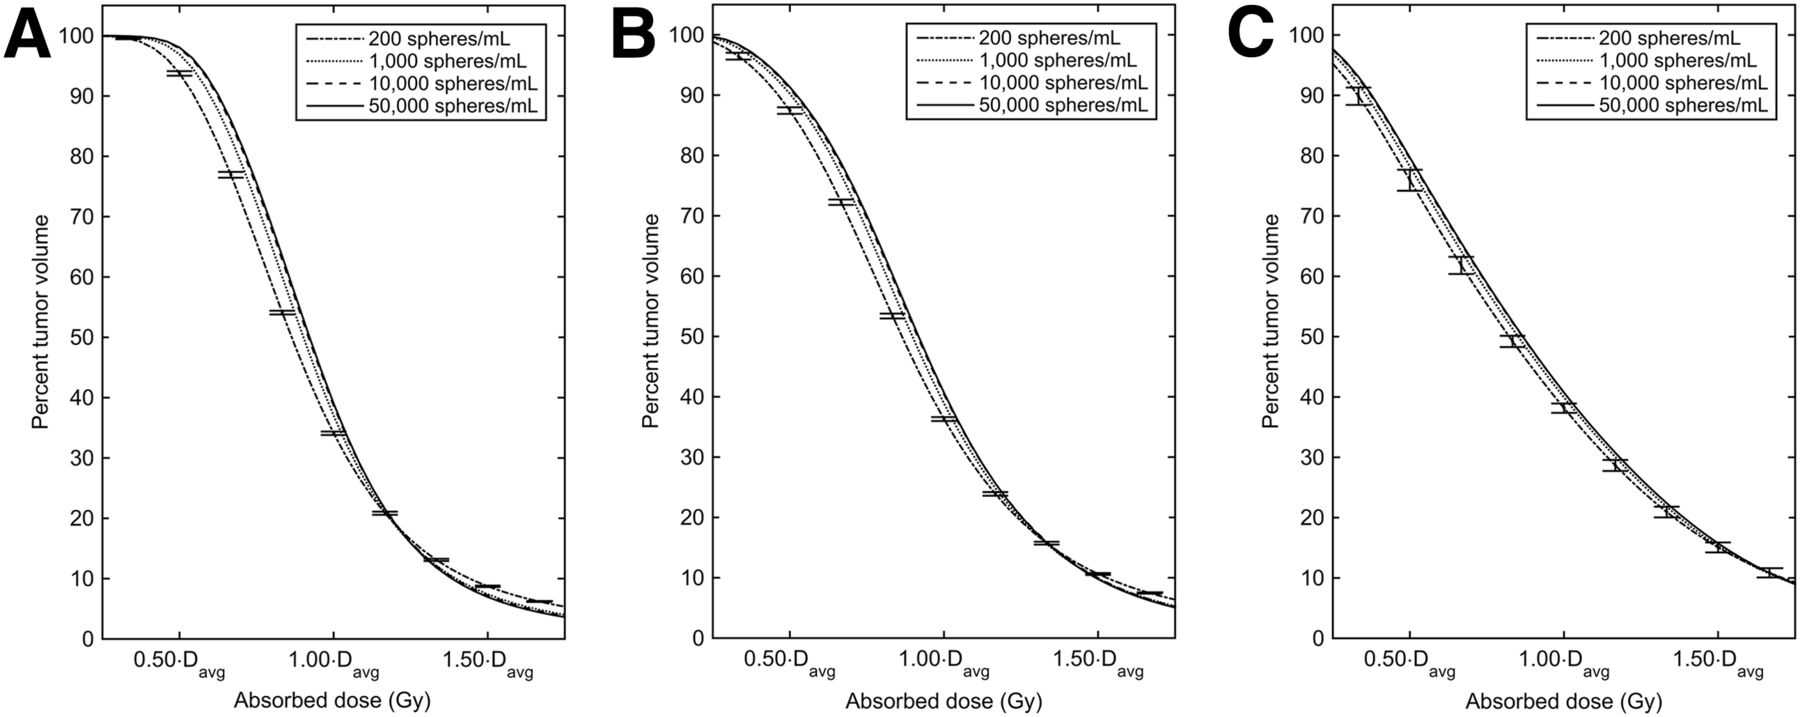
    Dose–volume histograms for patient-based approach with microsphere-number densities of 200, 1,000, 10,000, and 50,000 spheres/mL: tumor 2 (A), tumor 9 (B), and tumor 13 (C). Absorbed dose is reported as fraction of average absorbed dose. Davg = average absorbed dose to tumor volume.

  • FIGURE 7.
    • Download figure
    • Open in new tab
    • Download powerpoint
    FIGURE 7.

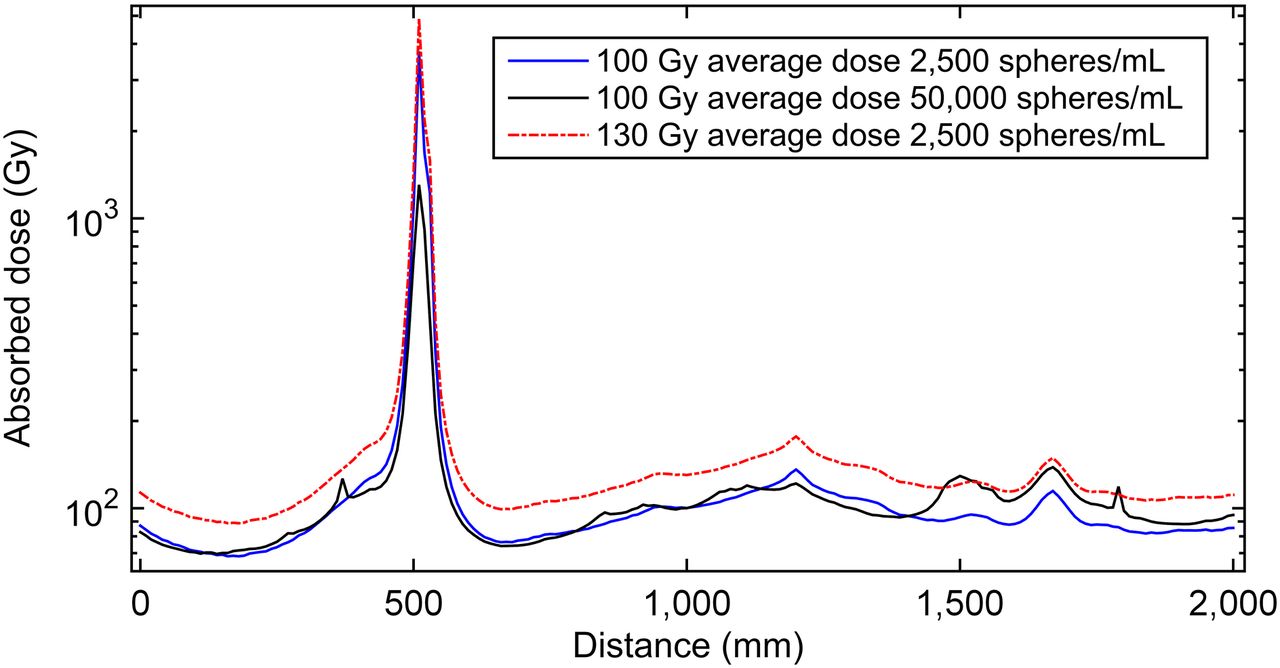
    Line profile showing absorbed dose across section of tumor with uniform macroscopic deposition. Data for 100-Gy average dose are presented at microsphere-number densities of 50,000 and 2,500 spheres/mL. Characteristic higher peaks and lower troughs at lower microsphere-number densities are apparent. Data are also presented at 2,500 spheres/mL at 130-Gy average absorbed-dose endpoint, consistent with lower limit of recommended treatment activity for radioembolization using glass microspheres. This increase in average tumor-absorbed dose easily overcomes differences due to microsphere-number density.

Tables

  • Figures
    • View popup
    TABLE 1

    Overview of Resin and Glass 90Y Radioembolization Products

    CharacteristicSIR-SpheresTheraSphere
    CompositionResin with 90Y bound to surfaceGlass permanently impregnated with 90Y
    Size32.5 ± 5 μm20–30 μm
    Number of spheres per vial40–80 million1.2–8 million
    Specific activity at calibration50 Bq/sphere2500 Bq/sphere
    Time after infusion when 90% of absorbed dose is delivered∼9 d∼9 d
    Shelf life from time of calibration24 h12 d
    Specific activity at treatment50–38.6* Bq/sphere2,500–111* Bq/sphere
    Range of microsphere-number density per gray of average tumor-absorbed dose†413–535 mL-Gy−18.2–186 mL-Gy−1
    Range of microsphere-number density at…
     100-Gy average tumor-absorbed dose41,300–53,500 mL−1820–18,600 mL−1
     250-Gy average tumor-absorbed dose103,250–133,750 mL−12,050–46,500 mL−1
    • ↵* Based on decay at expiration/shelf-life of product.

    • ↵† Based on clinical specific activity range.

    • Adapted from Salem and Thurston (4).

    • View popup
    TABLE 2

    Summary of 90Y PET/CT Patient Data Used

    PatientTumorTypeSize (cm)
    11Hepatocellular carcinoma7 × 9.2 × 11
    22Adenocarcinoma1.9 × 2.5 × 4.2
    33Adenocarcinoma3.8 × 3.4 × 3.4
    44Hepatocellular carcinoma4.4 × 4.6 × 3.1
    55Cholangiocarcinoma3.1 × 2.3 × 2.8
    56Cholangiocarcinoma4.7 × 5.8 × 6.1
    57Cholangiocarcinoma3.0 × 3.1 × 2.3
    68Breast cancer2.7 × 2.3 × 2.3
    79Hepatocellular carcinoma15 × 9.4 × 10.4
    810Hepatocellular carcinoma9.3 × 7.1 × 6.8
    911Hepatocellular carcinoma2.1 × 2.5 × 3.1
    912Hepatocellular carcinoma2.8 × 2.9 × 2.1
    913Hepatocellular carcinoma3.1 × 3.2 × 3.5
    914Hepatocellular carcinoma2.8 × 3.1 × 2.9
    1015Hepatocellular carcinoma8.7 × 8.9 × 12.3
    1116Neuroendocrine1.1 × 1.3 × 2.6
    1117Neuroendocrine2.6 × 2.0 × 1.2
    1218Hepatocellular carcinoma4.9 × 6.6 × 9.1
    1319Hepatocellular carcinoma6.2 × 4.5 × 5.1
    • All tumors were treated with resin microspheres, and none of the tumors reached stasis.

PreviousNext
Back to top

In this issue

Journal of Nuclear Medicine: 57 (7)
Journal of Nuclear Medicine
Vol. 57, Issue 7
July 1, 2016
  • Table of Contents
  • Table of Contents (PDF)
  • About the Cover
  • Index by author
Print
Download PDF
Article Alerts
Sign In to Email Alerts with your Email Address
Email Article

Thank you for your interest in spreading the word on Journal of Nuclear Medicine.

NOTE: We only request your email address so that the person you are recommending the page to knows that you wanted them to see it, and that it is not junk mail. We do not capture any email address.

Enter multiple addresses on separate lines or separate them with commas.
A Microdosimetric Analysis of Absorbed Dose to Tumor as a Function of Number of Microspheres per Unit Volume in 90Y Radioembolization
(Your Name) has sent you a message from Journal of Nuclear Medicine
(Your Name) thought you would like to see the Journal of Nuclear Medicine web site.
Citation Tools
A Microdosimetric Analysis of Absorbed Dose to Tumor as a Function of Number of Microspheres per Unit Volume in 90Y Radioembolization
Alexander S. Pasciak, Austin C. Bourgeois, Yong C. Bradley
Journal of Nuclear Medicine Jul 2016, 57 (7) 1020-1026; DOI: 10.2967/jnumed.115.163444

Citation Manager Formats

  • BibTeX
  • Bookends
  • EasyBib
  • EndNote (tagged)
  • EndNote 8 (xml)
  • Medlars
  • Mendeley
  • Papers
  • RefWorks Tagged
  • Ref Manager
  • RIS
  • Zotero
Share
A Microdosimetric Analysis of Absorbed Dose to Tumor as a Function of Number of Microspheres per Unit Volume in 90Y Radioembolization
Alexander S. Pasciak, Austin C. Bourgeois, Yong C. Bradley
Journal of Nuclear Medicine Jul 2016, 57 (7) 1020-1026; DOI: 10.2967/jnumed.115.163444
Twitter logo Facebook logo LinkedIn logo Mendeley logo
  • Tweet Widget
  • Facebook Like
  • Google Plus One
Bookmark this article

Jump to section

  • Article
    • Abstract
    • MATERIALS AND METHODS
    • RESULTS
    • DISCUSSION
    • CONCLUSION
    • DISCLOSURE
    • Footnotes
    • REFERENCES
  • Figures & Data
  • Info & Metrics
  • PDF

Related Articles

  • This Month in JNM
  • PubMed
  • Google Scholar

Cited By...

  • No citing articles found.
  • Google Scholar

More in this TOC Section

  • Feasibility of Ultra-Low-Activity 18F-FDG PET/CT Imaging Using a Long–Axial-Field-of-View PET/CT System
  • Cardiac Presynaptic Sympathetic Nervous Function Evaluated by Cardiac PET in Patients with Chronotropic Incompetence Without Heart Failure
  • Validation and Evaluation of a Vendor-Provided Head Motion Correction Algorithm on the uMI Panorama PET/CT System
Show more Clinical Investigations

Similar Articles

Keywords

  • yttrium-90
  • 90Y
  • radioembolization
  • interventional oncology
SNMMI

© 2025 SNMMI

Powered by HighWire