


Abstract
68Ga-aquibeprin and 68Ga-avebetrin are tracers for selective in vivo mapping of integrins α5β1 and αvβ3, respectively, by PET. Because both tracers exhibit high affinity to their respective targets, the aim of this study was to investigate the influence of the specific activity of preparations of both tracers on in vivo imaging results. Methods: Fully automated 68Ga labeling of 0.3 nmol of aquibeprin or avebetrin was done using buffered eluate fractions (600–800 MBq, pH 2) of an SnO2-based generator, affording the radiopharmaceuticals with specific activities greater than 1,000 MBq/nmol. Lower values ranging from 150 to 0.4 MBq/nmol were adjusted by addition of inactive compound (∼0.15–50 nmol) to the injected activity (∼20 MBq for PET, 5–7 MBq for biodistribution). For in vivo experiments, 6- to 12-wk-old female severe combined immunodeficiency mice bearing M21 xenografts (human melanoma, expressing both integrins α5β1 and αvβ3) were used. The expression density of integrin β3 was determined by immunohistochemistry on paraffin slices. Results: For mass doses (specific activities) of less than 20 pmol (>1,000 MBq/nmol) and 1 nmol (20 MBq/nmol) per mouse, respectively, uptake of 68Ga-aquibeprin and 68Ga-avebetrin in M21 tumors dropped from 5.3 and 3.5 to 3.0 and 2.4 percentage injected dose per gram (%ID/g), respectively. When less than 20 pmol was applied, high uptake of 68Ga-aquibeprin in the eyes (4.5 %ID/g) or 68Ga-avebetrin in adrenals (25.9 %ID/g), respectively, were found, which was reduced by 90% and 65% (0.44 and 6.2 %ID/g, respectively), for doses of 1 nmol. The highest tumor-to-tissue ratios were observed both in ex vivo biodistribution and PET for comparably large doses, for example, 6 nmol (0.65 mg/kg) 68Ga-aquibeprin per mouse (3.5 MBq/nmol). Conclusion: Presumably because of their high affinities, 68Ga-aquibeprin and 68Ga-avebetrin allow for selective addressing of target sites with different integrin expression levels by virtue of adjusting specific activity, which can be exploited for visualization of low-level target expression or optimization of tumor-to-background contrast.
The term specific activity (AS) can refer to a variety of parameters, although its only meaning, by International Union of Pure and Applied Chemistry definition, is “for a specified isotope, or mixture of isotopes, the activity of a material divided by the mass of the material” (1). In terms of radiolabeled compounds, AS usually describes the activity of the radiolabeled compound divided by the mass of the radioactive and nonradioactive, cold reference compound, for example, a small molecule, a peptide, or an antibody fragment (2). In radiopharmaceutical sciences, all molecular species with comparable biologic activity (e.g., affinity to a given receptor) are usually considered for the calculation of AS because the impact of AS on biodistribution is governed by target saturation. This includes the radioactive and nonradioactive compound as well as similar species, such as the precursor or other nonseparated species present in the preparation. Commonly used units are based on mass (e.g., MBq/μg) or molar amount (GBq/μmol, MBq/nmol), whereas mol-based units are to be preferred because they are more convenient for comparison of radiopharmaceuticals with different molecular weights regarding concentration-dependent effects, such as receptor saturation.
The impact of AS on biodistribution, molecular imaging, and peptide receptor radionuclide therapy has been discussed repeatedly but, compared with other topics, rather infrequently. It is well known that a reduction of the AS, for example, by deliberately increasing the concentration of all molecular species in the formulated solution that compete with the tracer for binding to the respective target (excess unlabeled), can significantly influence the specific binding and thus overall pharmacokinetics of a radiopharmaceutical (3–8). However, possible implications for clinical practice are not yet fully investigated and understood (9). Presumably, the classic idea of the radiotracer principle (10), in its original form demanding application of tracers in lowest possible concentrations, has led to the still fairly popular notion that radiopharmaceuticals are ideally applied with the highest possible AS (11). On the other hand, it has been emphasized repeatedly that not only the administered amount of activity but also, among various other parameters, a radiopharmaceutical’s mass dose is crucial for realization of truly personalized peptide receptor radionuclide therapy (12).
A strong influence of the amount of coinjected cold mass on tumor uptake has been demonstrated in several biodistribution studies on tumor-xenografted rodents (13–20). As a general rule, it was found that tumor uptake increases with a decreasing total injected dose. For a variety of radiolabeled peptides, a maximum is reached between 10 and 100 pmol per mouse (13–18). However, for low doses (e.g., <1 pmol of an 111In-labeled exendin-3–targeting peptide (14) or ≤5 pmol of 111In-DTPA-Phe1-octreotide (17) or 67Ga-labeled bombesin analog (15) per mouse), tumor uptake decreased again. At the same time, various patterns for the relation of AS and uptake in nontumor tissues have been observed for different radiopharmaceuticals, reaching from strong variation (13,14) to almost no influence of AS (16–19).
Moreover, tumor-to-organ ratios frequently showed an optimum not at maximal but at intermediate specific activities. At this point, it appears logical that the target affinity will play a pivotal role as well, because at picomolar concentrations in vivo, a substantial degree of target binding should only be possible using tracers with picomolar affinities. Hence, application of high-AS formulations for specific targeting of tissue areas with low receptor density should be strongly influenced, or even be made possible in the first place, by a high affinity of the tracer. However, to the best of our knowledge, a systematic experimental investigation of the mutual dependency of a radiopharmaceutical’s AS, its affinity, tissue receptor density, and observed uptake has not been reported so far. Even complementary in vivo images are scarce. Though some of the mentioned previous work also includes some SPECT and PET scans, the knowledge potential of applying potent imaging agents with highly different AS has not yet been explored systematically, most likely because minimal activities required for small-animal imaging are much higher than for biodistribution experiments. Particularly for PET nuclides such as 68Ga, limited AS of tracers allowed for administration of small mass doses only at the expense of very small activities, insufficient for high-quality imaging of rodents (15).
We recently introduced 68Ga-aquibeprin and 68Ga-avebetrin (formerly named 68Ga-TRAP(RGD)3) (21) for PET imaging of integrins α5β1 and αvβ3, respectively (22). Because of the pronounced selectivity and virtually identical renal clearance kinetics of 68Ga-aquibeprin and 68Ga-avebetrin, these radiopharmaceuticals allowed for complementary imaging of their respective target structures in the same tumor xenograft (M21 human melanoma, expressing integrins α5β1 and αvβ3) without interference. Both compounds are trimers (23) based on the TRAP (triazacyclononane-triphosphinate) chelator system (24,25), which possesses extraordinary affinity to (26–28) and selectivity for (29–31) gallium radionuclides. Therefore, 68Ga-aquibeprin and 68Ga-avebetrin can be routinely produced with high AS (32), enabling administration of activity doses sufficient for high-quality PET imaging (>10 MBq) while injecting as little as single-digit picomolar amounts. In view of the aforementioned importance of high target affinity for tracers applied with high AS, the compounds' high integrin affinities (68Ga-avebetrin, 190 pM; 68Ga-aquibeprin, 88 pM) (22) rendered them particularly suitable for a detailed investigation on the influence of AS on PET imaging contrast in mice.
MATERIALS AND METHODS
General
Some of the applied experimental protocols have been fully described earlier, namely, 68Ga labeling for rodent experiments (21), culture of M21 human melanoma cells, generation of respective xenografts in mice and their use in biodistribution experiments (33), and small-animal PET imaging and immunohistochemistry (22). Descriptions of these protocols are provided in the supplemental materials (available at http://jnm.snmjournals.org).
Radiochemistry
68Ga-aquibeprin (22) and 68Ga-avebetrin (21) were produced as described (26), yielding tracers with AS of greater than 1,000 GBq/μmol (typically 1,300–1,800 GBq/μmol, 30 min after start of elution). Lower AS (or, more precisely, total injected amounts of biologically active compound) were adjusted by addition of unlabeled precursor (e.g., 0.15, 1.1, 7, or 55 nmol) to the injection syringes before administration. The actual injected total amounts of cold mass were calculated from syringe activities measured before and after injections. All data reported are based on mass doses; AS values, given for orientation and comparison, are calculated for an exemplary activity dose of 20 MBq as administered for PET studies.
Biodistribution and PET Studies
The supplemental materials provide general PET and biodistribution protocols. For evaluation of AS-dependent uptake in PET, volume regions of interest (ROIs) were drawn manually in the Siemens Inveon analysis interface for tumors, thigh muscle (2 independent ROIs), kidneys (both), thyroid (68Ga-avebetrin only), both knee joints, and both eyes (68Ga-aquibeprin only). Because of the comparably low resolution of 68Ga PET, individual ROIs for intra- and retroperitoneal organs (liver, stomach, spleen, pancreas, intestines) could not be reliably defined. To estimate gross organ uptake, a single ROI was drawn instead, covering the entire abdomen but excluding kidneys and urinary bladder. Percentage injected dose per milliliter values were taken as calculated by the software.
RESULTS
Radiochemistry
68Ga-aquibeprin (22) and 68Ga-avebetrin (21) (supplemental materials provide information on the structures) were obtained by fully automated 68Ga labeling of 0.3 nmol of the respective precursors within 20 min, in approximately 95% decay-corrected yield. Because eluate fractions usually contained 600–800 MBq of 68Ga at the start of syntheses, specific activities at the time of injection (25–40 min after start of syntheses; calculated by division of product yields by the total amounts of precursor, as described before) (32) were typically in the range of 1,300–1,800 MBq/nmol. For a typical activity dose of approximately 20 MBq administered for small-animal PET experiments, this was equivalent to 10–20 pmol of biologically active compound (taking into account all variations of starting activity, injected dose, and time between end of synthesis and tracer injection).
Lower specific activities over the range of 130 to 0.4 MBq/nmol could therefore be adjusted quite precisely by addition of comparably large amounts of unlabeled compound (150 pmol to 55 nmol) directly into the injection syringes. To improve precision, syringes were measured before and after injection, and the residual activities used for calculation of the total administered molar amounts.
Biodistribution
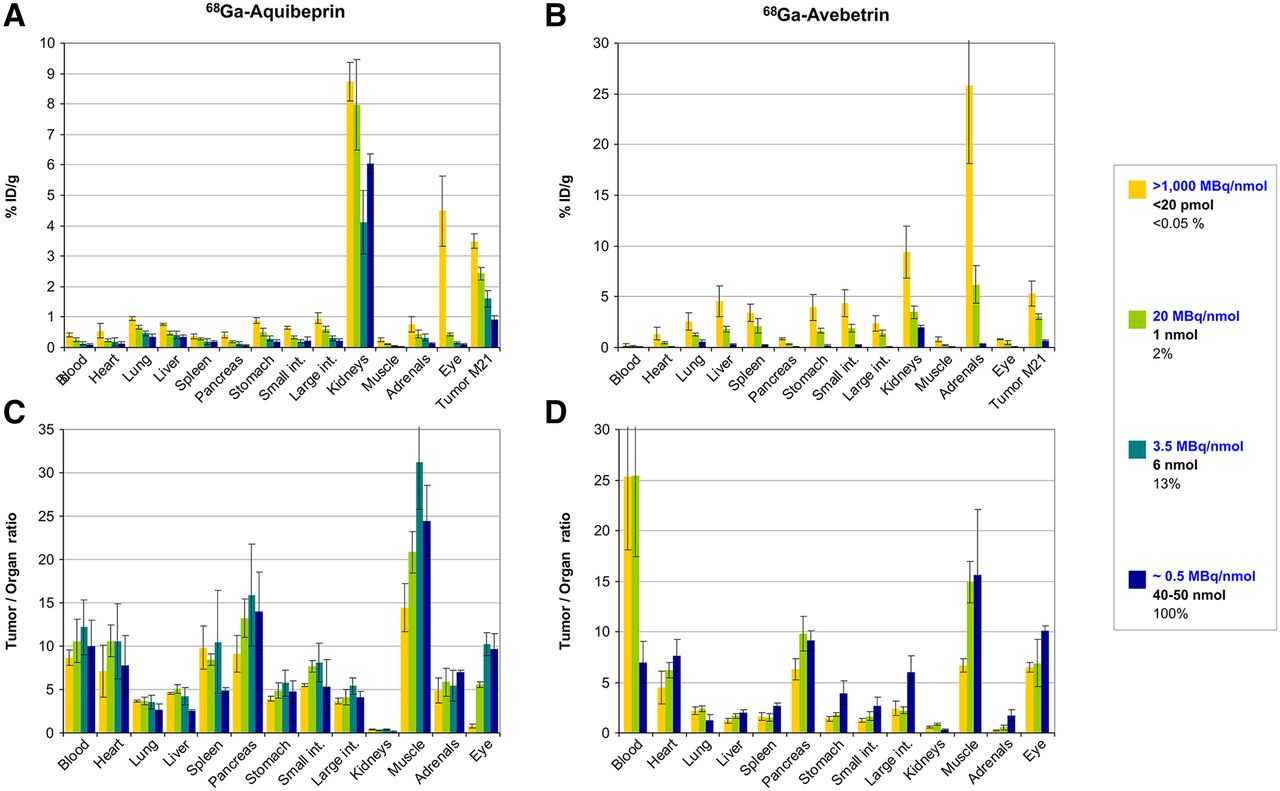
Ex vivo biodistribution data were acquired at 90 min after injection for different total injected masses of compound (Fig. 1). Generally, uptake of 68Ga-avebetrin and 68Ga-aquibeprin in all organs and tissues decreases when mass dose increases. However, this effect was more pronounced for 68Ga-aquibeprin, which showed particularly high uptake at high specific activities greater than 1,000 MBq/nmol, compared with uptake observed for 20 MBq/nmol. Kidney uptake of 68Ga-aquibeprin appeared not to follow the strict pattern observed for all other tissues; however, such irregularities have been observed previously (14) and are most probably related to indeterministic variation of renal excretion.

Biodistribution of 68Ga-aquibeprin (A and C) and 68Ga-avebetrin (B and D) in M21-xenografted severe combined immunodeficiency mice for different total injected molar amounts/specific activities (90 min after injection), expressed as %ID/g of tissue (A and B) and tumor-to-organ ratios (C and D), data plotted as mean ± SD. Exact doses were 11.1 ± 7.7 pmol (n = 6), 0.98 ± 0.03 nmol (n = 4), 6.1 ± 0.4 nmol (n = 8), and 51 ± 2 nmol (n = 4) for 68Ga-aquibeprin and 14.4 ± 5.3 pmol (n = 10), 0.99 ± 0.05 nmol (n = 5), and 38 ± 3 nmol (n = 4) for 68Ga-avebetrin. int. = intestine.
Although tumor uptake of both radiopharmaceuticals decreased with a larger administered dose, tumor-to-tissue ratios showed a remarkably different response. In the case of 68Ga-avebetrin, the effect was somewhat inhomogeneous, although most tumor-to-tissue ratios improved with lower AS. In contrast, a much stronger and consistent influence of AS on all tumor-to-tissue ratios was observed for 68Ga-aquibeprin. Figure 1 shows that most of the values reach an optimum for a dose of 6 nmol (∼3.5 MBq/nmol), where, for example, the tumor-to-muscle ratio peaks at 31.2 ± 5.4.
Interestingly, we observed an exceptionally high uptake of 68Ga-avebetrin in the adrenals (25.9 ± 7.7 percentage injected dose per gram [%ID/g]) for high AS (>1000 MBq/nmol). With increasing mass doses, adrenal uptake was reduced to insignificance and thus, was considered integrin αvβ3-specific. Furthermore, we found a peculiar 68Ga-aquibeprin uptake in the eyes (4.5 ± 1.2 %ID/g); insignificant uptake at higher doses again proved target specificity.
PET Imaging
Static PET scans were recorded 75 min after injection for 20 min, in correspondence to biodistribution experiments (90 min after injection). ROIs were drawn only for distinct and recognizable sites; because of the fairly low resolution of 68Ga PET and a pronounced partial-volume effect, separate addressing of many small organs was not feasible anyway. This circumstance furthermore had to be considered during interpretation of the ROI-based uptake values for small hotspots, such as the eyeballs; a quantitative correlation with ex vivo biodistribution was not to be expected here.
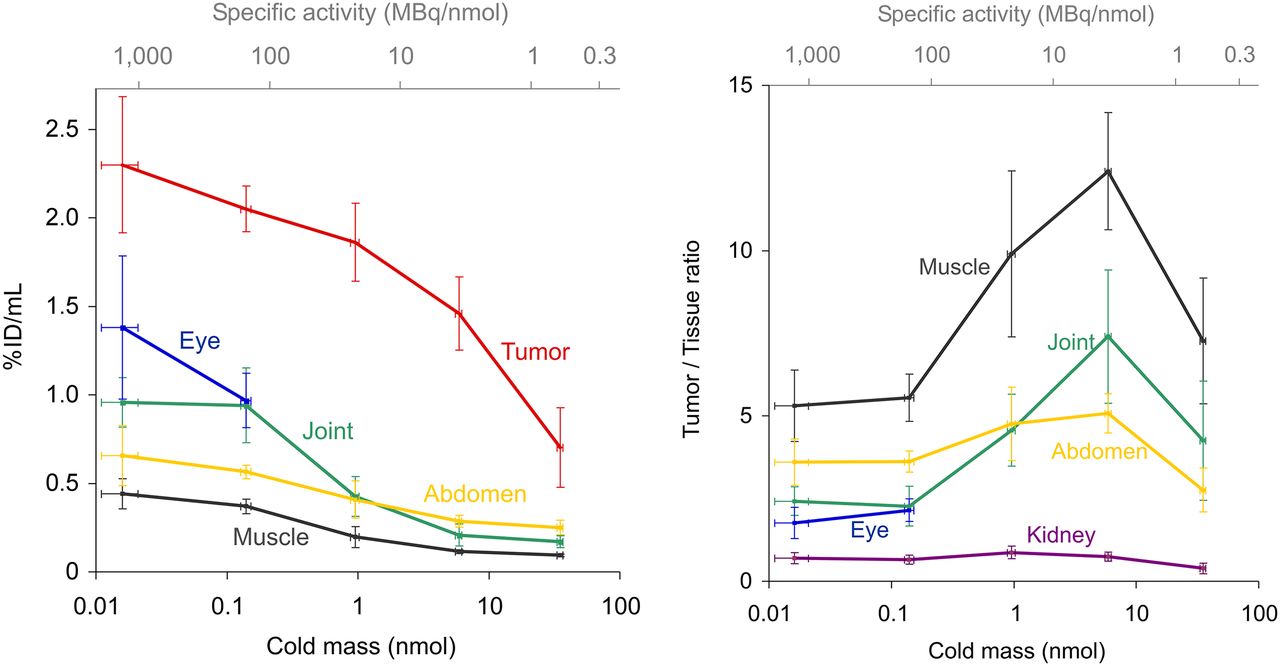
Notwithstanding, the PET-based uptake data (Figs. 2 and 3) corresponded well to actual visual contrast, and particularly the PET-derived tumor-to-tissue ratios allowed for a valid conclusion in terms of optimization of tumor imaging. In accordance with biodistribution experiments, decreasing uptake in the tumor as well as in other tissues was observed with decreasing AS. However, tumor uptake of 68Ga-aquibeprin remained at a high level (1.5 %ID/g) even on administration of comparably large amounts of substance (6 nmol, ≈ 16 μg; AS, ≈ 3.5 MBq/nmol), which, in turn, already suppressed a large part of uptake in organs or muscle. As a result, tumor-to-muscle ratios were highest (12.4 ± 0.7) at this point (Fig. 2), which is in accordance with biodistribution experiments. Surprisingly, tumor-to-background contrast was even better for a fairly large dose of approximately 35 nmol (7.3 ± 0.4) than for less than 20 pmol (5.3 ± 0.7).

68Ga-aquibeprin uptake, expressed as %ID/mL (mean ± SD), and tumor-to-tissue ratios (mean ± SD) for different ROIs as functions of injected total molar amount/AS (mean ± SD), derived from PET data (20-min static scans, 75 min after injection; n = 3–8).

68Ga-avebetrin uptake, expressed as %ID/mL (mean ± SD), and tumor-to-tissue ratios (mean ± SD) for different ROIs as functions of injected total molar amount/AS (mean ± SD), derived from PET data (20-min static scans, 75 min after injection; n = 3–8).
For further illustration of these findings, Figure 4 shows 68Ga-aquibeprin PET images of 3 different M21-bearing severe combined immunodeficiency mice, which were scanned up to 3 times, with different doses applied. One immediately notices the intense 68Ga-aquibeprin uptake in the eyes at a high AS (dose of 14 pmol), which almost completely disappeared when a 10-fold-higher dose (140 pmol) was applied. A considerable uptake, similar for 14 and 140 pmol, was observed in the joints, which disappeared using higher doses. Furthermore, despite a considerably lower tumor uptake for doses of 6 nmol, a low background activity provided excellent tumor-to-background contrast. Comparison of scans of different animals with the same AS demonstrated a good reproducibility and substantiated the decisive influence of AS/applied doses on imaging results.
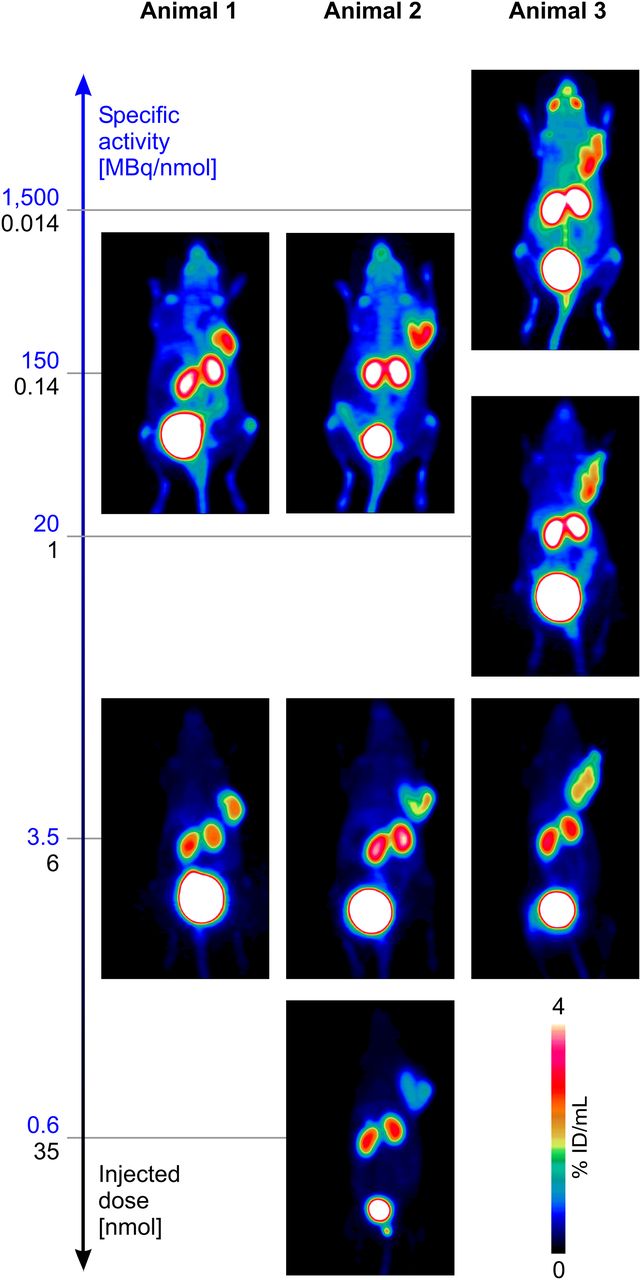
68Ga-aquibeprin PET images (maximum-intensity projection, 15–20 MBq; 75 min after injection) of 3 different severe combined immunodeficiency mice bearing M21 (human melanoma) xenografts on right shoulder. Images belonging to same animal are aligned vertically.
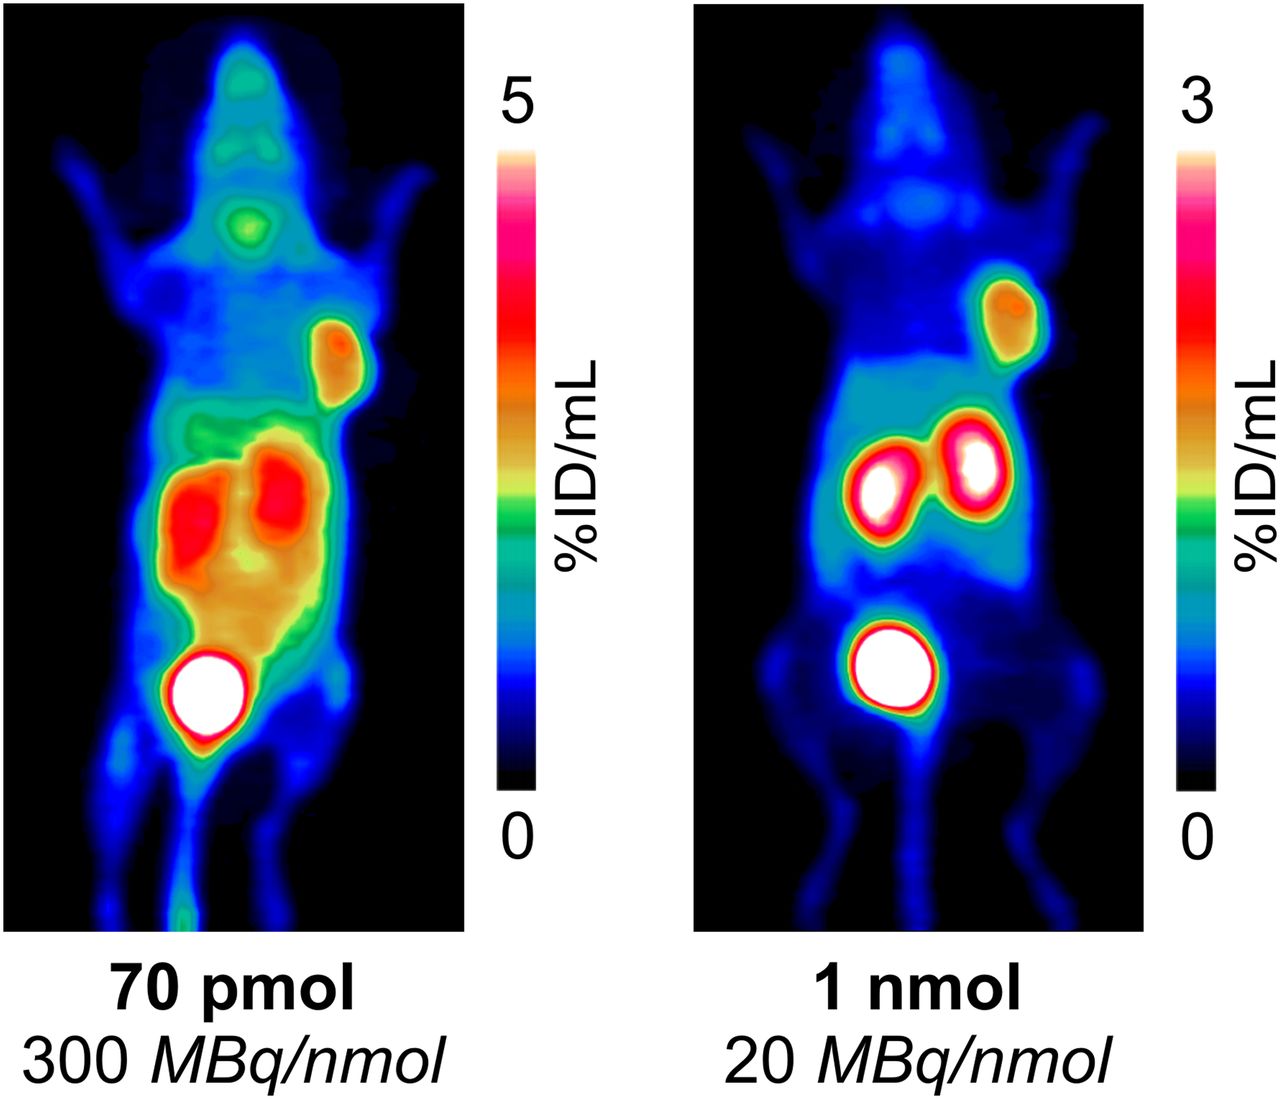
A comparable behavior was observed for 68Ga-avebetrin. Figure 5 shows that although a lower AS entailed lower uptake in both organs and tumor, delineation of the M21 xenograft was improved. Similar to the observations made for eyes and joints with 68Ga-aquibeprin, a strong signal of 68Ga-avebetrin in the thyroid, observed for high AS, was fading when higher doses were used. Unfortunately, the close proximity of the adrenals to the kidneys did not allow for a clear delineation of these organs in the PET image, rendering a visual assessment of the effects observed in the biodistribution infeasible.

68Ga-avebetrin PET images (maximum-intensity projection; 75 min after injection) of same M21-xenografted severe combined immunodeficiency mouse. Images are scaled to show same visual intensity for tumor, to highlight improved tumor-to-organ contrast using higher mass dose. Supplemental Figure 1 shows images with same scaling.
Immunohistochemistry
To further elucidate the origin of the peculiar difference of the uptake of 68Ga-avebetrin and 68Ga-aquibeprin in the adrenals observed for high AS, expression of the integrin subunits β3 and α5 in this organ was investigated by immunohistochemistry. Figure 6 shows a strong membraneous and cytoplasmic β3 integrin expression in the adrenal medulla. Only a faint expression was detected in the outer cortex. The X-zone was β3-negative, apart from single thrombocytes wherein the presence of β3 was due to integrin αIIbβ3 expression. These results were verified by computer-assisted image analysis, revealing an approximately 150 times higher number of positive pixels per mm2 for β3 than α5 integrin within the adrenal medulla (2,202,550 vs. 14,710). This is in agreement with the observation that adrenal uptake of 68Ga-aquibeprin is much lower than that of 68Ga-avebetrin.
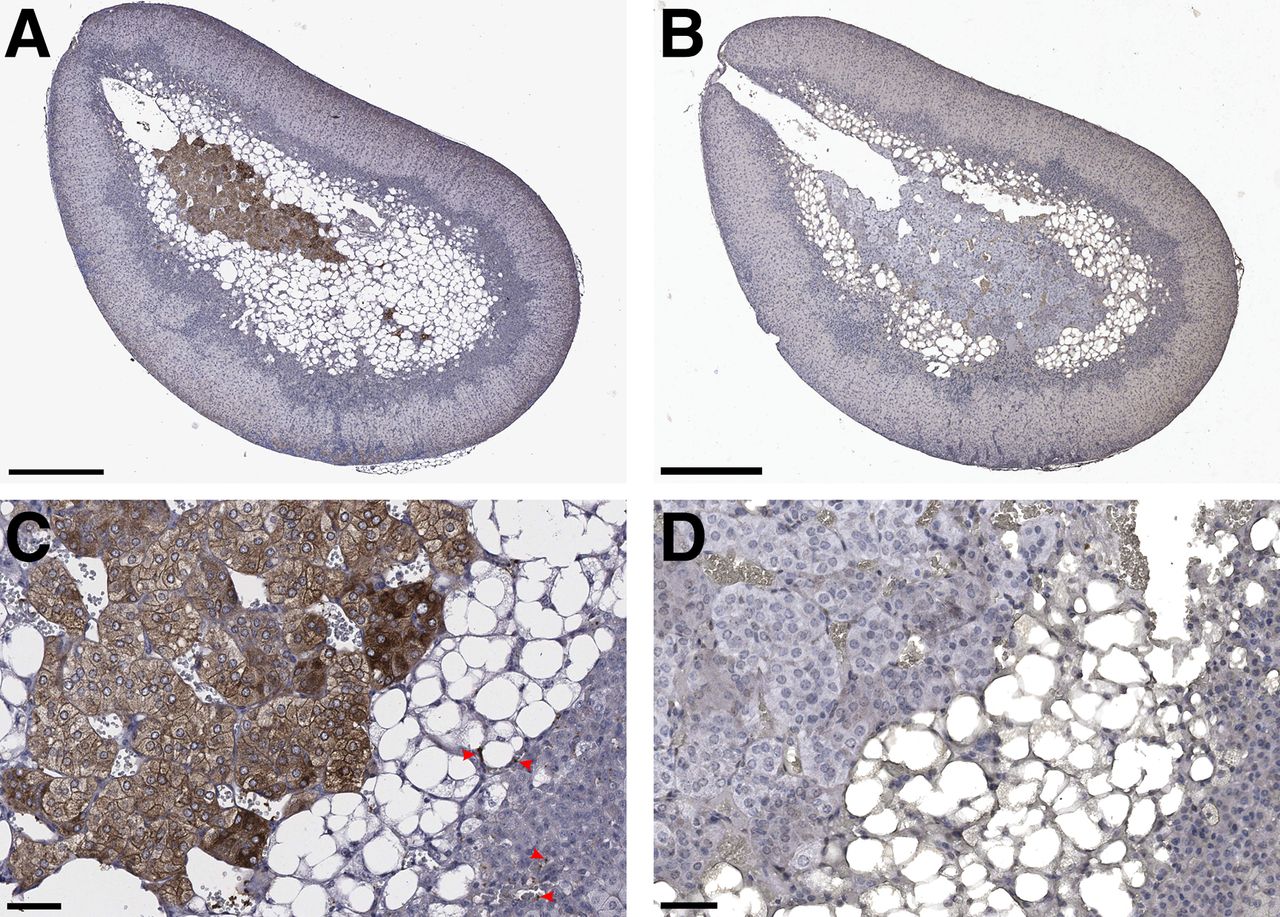
Immunohistochemistry of adrenal gland, showing strong cytoplasmic and membraneous expression of integrin β3 in medulla (A and C) and in single thrombocytes in X-zone (C, examples marked by red arrowheads). No expression of integrin α5 was detected (B and D). Scale bars indicate 500 μm (A and B) and 50 μm (C and D).
DISCUSSION
Why Preclinical Imaging Studies Benefit from High AS
Preclinical studies on dose-dependency of a radiopharmaceutical’s biodistribution do not necessarily require tracers with ultra-high AS. Particularly, nuclides with longer half-life and an efficient labeling chemistry (notably 111In in connection with DTPA-conjugates) allow for investigation of very low (down to single-digit picomolar) doses, because even very small amounts of activity (down to tens of Becquerels) can still be quantified reliably in excised tissues because of the high sensitivity of common γ-counters. Imaging, however, is a different story, because for both PET and SPECT/scintigraphy, the minimally required activities are much higher. Although PET is quite sensitive, all common positron emitters possess rather short half-lives, effectively limiting the maximal duration of image acquisition and, therefore, sensitivity. Collimator-based techniques, such as SPECT, inherently possess limited sensitivity due to a comparably poor photon yield. Although the limited sensitivity of both PET and SPECT can be partly compensated by longer acquisition times due to longer half-lives of the respective nuclides, scan times for in vivo imaging of rodents is furthermore restricted by anesthesia and animal welfare considerations. Hence, in a common setting, application of, for example, 5–10 MBq of a PET nuclide, such as 68Ga or 18F, is considered adequate to obtain a decent in vivo scan within reasonable time (<30 min). In the case of 68Ga, this translates to an AS of 500–1,000 MBq/nmol for a dose of 20 pmol. For radiopharmaceuticals addressing saturable targets, such as peptide receptors, many interesting effects are observed for such or even lower doses (14,15). AS of greater than 500 MBq/nmol are, however, impossible to reach with most standard approaches, such as for 68Ga-DOTA peptides (32). In contrast, 68Ga-TRAP peptides such as 68Ga-aquibeprin or 68Ga-avebetrin can be obtained routinely with AS up to 5,000 MBq/nmol and, under optimal conditions, greater than 10,000 MBq/nmol (32), rendering them ideally suited for investigation of the effects of ultra-low dosage by PET imaging.
In this context, the scientific value of performing actual imaging deserves special attention. Biodistribution experiments inherently do not go beyond the intended area of investigation, because generation of data is restricted to the tissues collected. Unexpected effects, although potentially important, might be overlooked. This is exemplified by the case of 68Ga-aquibeprin imaging, where the peculiar uptake in the eyes at ultra-high AS (Fig. 4) was not addressed on purpose but discovered accidentally by PET imaging. For clinical translation of novel radiopharmaceuticals, such observations nevertheless must be considered highly relevant, because common clinical doses of imaging agents are corresponding to ultra-low doses in mice (4). For example, assuming that 68Ga-DOTATATE is typically applied with an AS in the range of 10–50 MBq/nmol, a typical dose (150 MBq, ∼3–15 nmol) in an average patient (70 kg) calculates to approximately 40–200 pmol per kg of body weight, which is equivalent to a dose of 1–5 pmol for a mouse weighting 25 g. As long as the usual PET tracer production and dosage routines (i.e., the microdosing approach) are adhered to, effects observed in ultra-low-dose rodent PET are therefore not an oddity but, on the contrary, should be expected to govern the observations made in the course of first-in-human applications. In other words, preclinical imaging using radiolabeled receptor ligands with ultra-high AS is much more likely to actually correspond to clinical results.
Integrin α5β1/αvβ3 Selectivity of 68Ga-Aquibeprin and 68Ga-Avebetrin
Angiogenesis (neovascularization) is a common feature of a variety of ophtalmic diseases and can occur in various functional compartments of the eye, such as the cornea, iris, retina, and choroid (34). In mice, strong expression of integrin α5β1 was observed during corneal neovascularization, which could be inhibited by administration of integrin α5β1 antagonist (35). A comparable study in rats demonstrated that integrin α5 is particularly expressed in distal areas in which vessels are just about to develop, whereas integrin β3 appears not to be involved in corneal neovascularization at all (36). On the basis of these findings, we assume that the strong 68Ga-aquibeprin signal in the eyes is indeed correlated to expression of integrin α5β1, originating from neovascularization processes.
The strong immunohistochemistry signal for integrin β3 in the adrenal medulla (Fig. 6) is in accordance with a previous study on β3 integrin gene expression (37). Because the β3 subunit dimerizes with integrins αv and αIIb, a β3 signal in thrombocytes is also found because of expression of platelet integrin αIIbβ3, notwithstanding the fact that all other β3 signals belong to actual αvβ3 expression.
Altogether, we assume that in the eye and the adrenals, only integrin α5β1 and αvβ3, respectively, are present. A comparison of the uptake of high-AS 68Ga-aquibeprin and 68Ga-avebetrin (Supplemental Fig. 2) in these organs thus further supports the finding that these radiopharmaceuticals possess complementary selectivity for their respective targets, as shown in a previous study, wherein selectivity was proven by an invariant PET signal of either tracer in the α5β1/αvβ3 expressing M21 tumor on mutual cross-blockade with an excess of the respective other compound (22).
Impact of AS on Biodistribution and Imaging Contrast
Figure 1 and Supplemental Figure 2 furthermore show that high AS resulted in a particularly increased uptake in tissues containing a lower absolute amount of receptors. Although a change from high (>1,000 MBq/nmol) to intermediate AS (20 MBq/nmol) entailed only a moderate decrease in M21 tumor uptake of both 68Ga-aquibeprin and 68Ga-avebetrin (by 31% and 43%, respectively), 68Ga-aquibeprin uptake in the eyes dropped dramatically by 90% from 4.5 ± 1.2 to 0.44 ± 0.05 %ID/g. Similarly, an exceptionally high uptake of 68Ga-avebetrin in the adrenals (25.9 ± 7.7 %ID/g) was reduced by 76% to 6.2 ± 1.9 %ID/g, which corresponds well to previously reported values (∼5 %ID/g) for radiolabeled RGD peptides (38,39). In contrast, much lower uptake modulations are observed for 68Ga-avebetrin in the eye and for 68Ga-aquibeprin in the adrenals, indicating that the observed effects are indeed related to the differences in target expression, and not to metabolism or unspecific accumulation.
The high accumulation of high-AS 68Ga-avebetrin in the adrenal medulla furthermore suggests that administration of radiopharmaceuticals with high AS/in low doses might be particularly useful for addressing such small tissue areas with high receptor expression density, because a much lower modulation of uptake by AS is observed for large organs with low receptor density, for example, the liver (Fig. 1) (36). Concerning uptake in adrenals, a similar observation has been made earlier on variation of the amount of 111In-DOTATOC administered to rats. For doses of approximately 300 and 30 pmol, uptake of approximately 1.6 and 8.3 %ID/g, respectively, were found (13), most likely mediated by somatostatin receptor expression on pheochromocytes located in the adrenal medulla. The dose range and extent of the AS-dependent uptake variation observed for 68Ga-avebetrin and 111In-DOTATOC is strikingly similar and suggests that both phenomena are essentially governed by the same principles.
However, we presently cannot satisfyingly describe to which extent the high target affinities of the tracers (68Ga-avebetrin, 190 pM; 68Ga-aquibeprin, 88 pM) (22) are governing the AS-related effects we observed, although we suspect a causal relationship. In an earlier study, biodistribution of 68Ga-NOPO-RGD (an integrin αvβ3–targeted cyclo(RGDfK) monomer with a αvβ3 affinity of 1.0 ± 0.1 nM) was evaluated with high AS (1,500 MBq/nmol) in the same tumor model (38), but uptake in the adrenals was only 5.2 ± 1.9 %ID/g (120 min after injection). Although there are a considerable number of pharmacologic variables affecting the in vivo behavior of compounds, we nevertheless assume that high affinity plays a decisive role here. We currently hypothesize that high uptake in small tissue compartments requires radiopharmaceuticals possessing both a high target affinity and high AS. This combination of properties might be key for effective peptide receptor radionuclide therapy of small-sized tumor lesions, such as micrometastases.
CONCLUSION
Presumably because of their high affinities, 68Ga-aquibeprin and 68Ga-avebetrin allow for selective addressing of target sites with different integrin expression levels by virtue of adjusting specific activity, which can be exploited for visualization of low-level target expression or optimization of tumor-to-background contrast.
DISCLOSURE
The costs of publication of this article were defrayed in part by the payment of page charges. Therefore, and solely to indicate this fact, this article is hereby marked “advertisement” in accordance with 18 USC section 1734. Financial support by the Deutsche Forschungsgemeinschaft (grant #NO822/4-1 and SFB 824, projects Z1 and Z2) is gratefully acknowledged. No other potential conflict of interest relevant to this article was reported.
Acknowledgments
The authors furthermore thank Sybille Reder, Markus Mittelhäuser, and Marco Lehmann for assistance with small-animal PET and Martina Wirtz, Stephanie Robu, and Monika Beschorner for assistance with animal experiments.
Footnotes
Published online May 5, 2016.
- © 2016 by the Society of Nuclear Medicine and Molecular Imaging, Inc.
REFERENCES
- Received for publication February 8, 2016.
- Accepted for publication March 29, 2016.


Jump to section
Related Articles
Cited By...
- Increasing molar activity by HPLC purification improves 68Ga-DOTA-NAPamide tumor accumulation in a B16/F1 melanoma xenograft model
- Targeting Cardiovascular Implant Infection: Multimodality and Molecular Imaging
- In Vivo PET Imaging of the Cancer Integrin {alpha}v{beta}6 Using 68Ga-Labeled Cyclic RGD Nonapeptides