


Abstract
Simultaneous PET and MR imaging is a promising new technique allowing the fusion of functional (PET) and anatomic/functional (MR) information. In the thoracic–abdominal regions, respiratory motion is a major challenge leading to reduced quantitative and qualitative image accuracy. Correction methodologies include the use of gated frames that lead to low signal-to-noise ratio considering the associated low statistics. More advanced correction approaches, previously developed for PET/CT imaging, consist of either registering all the reconstructed gated frames to the reference frame or incorporating motion parameters into the iterative reconstruction process to produce a single motion-compensated PET image. The goal of this work was to compare these two—previously implemented in PET/CT—correction approaches within the context of PET/MR motion correction for oncology applications using clinical 4-dimensional PET/MR acquisitions. Two different correction approaches were evaluated comparing the incorporation of elastic transformations extracted from 4-dimensional MR imaging datasets during PET list-mode image reconstruction to a postreconstruction image-based approach. Methods: Eleven patient datasets acquired on a PET/MR system were used. T1-weighted 4D MR images were registered to the end-expiration image using a nonrigid B-spline registration algorithm to derive deformation matrices accounting for respiratory motion. The derived matrices were subsequently incorporated within a PET image reconstruction of the original emission list-mode data (reconstruction space [RS] method). The corrected images were compared with those produced by applying the deformation matrices in the image space (IS method) followed by summing the realigned gated frames, as well as with uncorrected motion-averaged images. Results: Both correction techniques led to significant improvement in accounting for respiratory motion artifacts when compared with uncorrected motion-averaged images. These improvements included signal-to-noise ratio (mean increase of 28.0% and 24.2% for the RS and IS methods, respectively), lesion size (reduction of 60.4% and 47.9%, respectively), lesion contrast (increase of 70.1% and 57.2%, respectively), and lesion position (changes of 60.9% and 46.7%, respectively). Conclusion: Our results demonstrate significant respiratory motion compensation using both methods, with superior results from a 4D PET RS approach.
Simultaneous PET/MR is a promising multimodality imaging technique allowing the fusion of functional (PET) and anatomic/functional (MR) information. In the thoracic–abdominal region, respiratory motion is a major challenge for PET imaging (1–3). Correction methodologies involve the use of gated frames that are of low signal-to-noise ratio since each frame contains only part of the counts available in a motion-averaged PET study (4–6). More advanced correction approaches consist of either accounting for motion in image space (7), where respiration-gated images are deformed to a reference state and summed, or incorporating motion parameters into the iterative image reconstruction process to produce a single motion-compensated PET image (8,9). Within the context of motion compensation, it has been previously shown that the necessary motion parameters may be extracted directly from the PET images (10). However, this approach is limited by the resolution of the DMs, which is equivalent to the PET image resolution (10). Additionally, this approach is likely to fail for specific radiotracers with little background uptake (7), such as 11C acetate imaging. Instead, the DMs can be derived using other modalities, such as 4D CT in the case of combined PET/CT systems. However, the use of 4D CT images is hampered by several issues, the most important being the associated dose to the patient (11). In addition, differences between corresponding gated frames in 4D PET and corresponding phase-matched 4D CT series have been previously reported in PET/CT imaging. Such mismatches are resulting from differences in the conditions of respiration-synchronized PET and CT acquisitions. In turn, such differences result in errors associated with the derivation of DMs from 4D CT frames for PET motion correction (12,13). In the case of PET/MR systems, these 2 issues associated with 4D CT acquisitions are irrelevant, given the nonionizing nature of MR acquisitions, their good tissue contrast even in the lungs as demonstrated using newly developed algorithms (14), and the capability of simultaneous PET and MR acquisitions.
Recently, the use of simultaneous PET/MR has been proposed for the generation of DMs (15), initially to correct for rigid head motion in brain imaging (16). In the case of nonrigid respiratory motion, the use of 2-dimensional (2D) and 3-dimensional (3D) MR sequences for nonrigid motion compensation has been proposed and evaluated using simulated PET data (17,18), phantom studies (19,20), and rabbits and primates (21). To our knowledge, the only study for respiratory motion correction in clinical PET/MR imaging using patient datasets was described by Wurslin et al. (22). The proposed method was shown to work well in a time-efficient and convenient manner allowing for easy integration into clinical routine imaging given that the DMs are extracted by acquiring, in a simultaneous fashion during the first 3 min of the PET scan, multiple sagittal 2D MR slices covering the patient’s body within the PET field of view. The rest of the process involves the acquisition of 2D navigators with no associated time implications. On the other hand, this method was a postreconstruction image-based motion correction, and therefore results could be potentially improved by integrating DMs within the PET reconstruction (9).
In this work we compared, for the first time to our knowledge, in clinical simultaneous 4D PET/MR imaging for oncology applications, 2 different respiratory motion correction implementations previously considered in the field of 4D PET/CT. Within this context, the application of DMs extracted from 4D MR images during PET image reconstruction to produce a single motion-compensated PET image was evaluated. The proposed method was compared with the image-based correction approach presented by Wurslin et al. (22).
MATERIALS AND METHODS
Patient Datasets
Eleven enrolled patients (7 male, 4 female) with metastatic lesions in the thorax or upper abdomen participated in the study (aged 32–70 y; mean, 57 ± 11 y). Table 1 shows an overview of the patient demographics, including the corresponding lesion characteristics. Patient datasets were acquired on a hybrid whole-body PET/MR system (Biograph mMR; Siemens Healthcare). The scanner combines a PET detector system with a transaxial and axial field of view of 59.4 and 25.8 cm, respectively, and a 3-T MR system. Phased-array body coils optimized for minimizing 511-keV photon attenuation were used for MR signal detection. A T1-weighted spoiled gradient-echo sequence with Dixon-based fat–water separation was acquired during a breath-hold (echo time, 1.23 and 2.46 ms; repetition time, 3.6 ms; flip angle, 10°; resolution, 2.6 × 2.6 × 2.6 mm; bandwidth, 965 Hz/pixel; parallel imaging acceleration factor; 2; 128 slices per slab; acquisition time, 19 s; end-expiratory position), and tissues were classified to obtain an attenuation map for the entire PET field of view (23). PET emission data of 1 bed position covering thorax and upper abdomen were subsequently recorded in list-mode format for 5 min under free-breathing conditions. PET/MR scanning started without repeated radiotracer injection after a routine whole-body PET/CT acquisition (122 ± 13 min after injection of 336–371 MBq of 18F-FDG).
Overview of Patient Demographics, Including Lesion and Associated Motion Characteristics
The 1-dimensional respiratory signal used for PET data binning was extracted from 2D MR imaging navigator images of the diaphragm position (22) acquired throughout the PET data acquisition. During the first 3 min of the PET scan, multiple sagittal 2D MR slices covering the patient’s body within the PET field of view were acquired to obtain a 4D MR series (echo time, 1.8 ms; repetition time, 3.7 ms; flip angle, 15°; resolution, 2 × 2 × 10 mm; bandwidth, 670 Hz/pixel; 36 slices per slab; 0.4-s acquisition time per image slice) and framed into 4 different MR images. This is done by inserting, for each slice, the MR image closest to the frame’s mean respiratory position into the corresponding 3D volume of the 4 frames. The choice of 4 frames was based on previous work (22) (Supplemental Figs. 3 and 4 [supplemental materials are available at http://jnm.snmjournals.org]), where it was shown that for a 5-min PET acquisition with the Biograph mMR system, 4 respiratory gates resulted in superior lesion contrast, SNR, and full width at half maximum (FWHM) results compared with 6 or 8 gates. All patients provided written informed consent for participation in the 4D PET/MR study, which was approved by the local institutional review board.
Motion Parameter Extraction
The T1-weighted 4D MR images were registered to the end-expiration image using a nonrigid B-spline registration algorithm (24) to derive deformation matrices (DMs) accounting for the respiratory motion. The end-expiration image was considered as the PET reference frame since it corresponds to the breath-hold state of the MR-based attenuation correction acquisition. The elastic registration was performed using a spatiotemporal algorithm for motion reconstruction from a series of images. This method uses a semilocal parametric model for the deformation based on B-splines and reformulates the registration task as a global optimization problem (24). The obtained transformation Ut(x) between the MR image m(x,t) at time t (t can be 1, 2, or 3, corresponding to the three 4-dimensional [4D] MR images) and the end-expiration MR image m(x,0) is defined as a linear combination of B-spline basis functions, located in a rectangular grid: Eq. 1
Eq. 1
where j are the indices of the grid location and βr is a tensor product of centered B-splines of degree r. The spacing between the grids h determines the number of parameter cj to be optimized and the solution rigidity. The registration is then formulated as an optimization procedure minimizing the sum-of-squared-differences metric to find the best transformation parameter cj (25). To improve speed and robustness, a multiresolution approach is used in the image and the transformation space (24). This approach creates a pyramid of subsampled images optimal in the L2 sense taking advantage of the spline representation. The problem is solved starting at the coarsest level and proceeding to the finest level.
PET Image Reconstruction–Based Respiratory Motion Correction
Before the list-mode data were sorted into respiratory gates, the data were synchronized with the MR-derived respiration signal by parsing the list-mode data file using a synchronization tag that is inserted by the MR scanner at the beginning of the imaging sequence. The MR navigator data were acquired during the full PET acquisition and were used to define 4 respiratory gates with respect to the diaphragm motion amplitude and hence corresponding to the 4 previously mentioned 3D MR frames.
A list-mode–based respiratory motion correction was implemented during PET image reconstruction, allowing the use of all acquired data available throughout a respiratory motion-averaged acquisition. The elastic DMs, extracted as described in the previous section, were incorporated within the one-pass list-mode expectation maximization algorithm to reconstruct a single motion-compensated PET image, according to a previously validated implementation (9).
The standard one-pass list-mode expectation maximization algorithm can be written as follows: Eq. 2
Eq. 2
where  is the expected count in line-of-response i, pij is the purely geometric term representing the geometric probability of detecting at line-of-response i an event generated in voxel j, nj is the voxel j intensity, J is the total number of voxels, sj is the voxel j of the sensitivity image, and K is the number of time subsets k. k is both the iteration number and the number of subsets used in that iteration. Tk is the set of list-mode events in the kth subset. The sensitivity image S including the normalization and attenuation corrections is produced through a forward-projection and backprojection of the attenuation image (9).
The discrete motion DMs ut (calculated in Eq. 1) can be incorporated in a mathematic representation of the system matrix in the PET reconstruction process (9). If P is the system matrix, whose elements pij represent the geometric probability of detecting at line-of-response i an event generated in voxel j (Eq. 2), the new motion compensation–incorporated system matrix Pt accounting for the deformation of the radioactive distribution from time t to the reference time using matrix ut can be described as follows: Eq. 3
Eq. 3
The standard one-pass list-mode expectation maximization algorithm (Eq. 2) is subsequently modified to Eq. 4
Eq. 4
where T is the transpose operator and Nframes (4 in this study) is the number of temporal gated frames (number of DMs + 1). The sensitivity image S used for attenuation and normalization correction was also modified to account for the motion of the voxel location using the modified system matrix Pt (9).
Image Analysis and Validation
The accuracy of the proposed reconstruction space (RS) correction method described above was assessed by comparing the single motion-compensated PET image produced using this approach (RS motion-corrected PET image, or RSC image), with the one produced by applying the elastic transformations in the IS followed by summing together the realigned gated frames (IS-corrected image, or ISC image). In addition, the noncorrected motion-averaged image (NC image) was considered for comparison purposes.
Local profiles were used as qualitative figures of merit. The first chosen quantitative figure of merit was the difference in SNR in a uniform activity distribution organ between corrected and motion-averaged PET images. The SNR is defined as the power ratio between a signal (in the liver) and the background noise. The signal is calculated using the mean of 10 circular regions of interest (ROIs) 3 cm in diameter covering the whole of the liver. The background noise was given by the SD in these ROIs. The second quantitative figure of merit was the percentage improvement of the lesion contrast calculated using a similar ROI analysis. Ten ROIs 3 cm in diameter were placed in the background organ where each lesion was located. The mean activity concentration in these background ROIs was used in the lesion-to-background contrast calculations. The slice with the maximum count density over the lesion was identified for the ROI analysis. Average count densities were subsequently derived for the lesion.
Finally, other quantitative figures of merit considered were the lesion position and size (in terms of FWHM changes). To assess the effects on both the lesion location and the lesion size, line profiles were obtained for each lesion. Each of the lesion profiles was subsequently fitted with a gaussian function to derive the lesion position and corresponding lesion size (FWHM).
Finally, the percentage improvement for all quantitative figures of merit was calculated using the following equation: Eq. 5
Eq. 5
where X is either the lesion contrast, position, or FWHM; the corrected image may be either the RSC image or the ISC image; and the noncorrected image is the NC image. Finally, the results of the correction methods were statistically compared using the Wilcoxon 2-sample paired signed rank test (MedCalc Software). P values below 0.05 were considered significant.
RESULTS
Figures 1A, 1B, and 1C show the RSC image, the ISC image, and the NC image, respectively. Profiles along the lesion for 1 patient (Fig. 1D) indicate high correlation between the 2 methods, with a noticeable difference compared with the NC image. In particular, the tumor on the NC image displays different activity distribution heterogeneity patterns relative to the motion-corrected images.
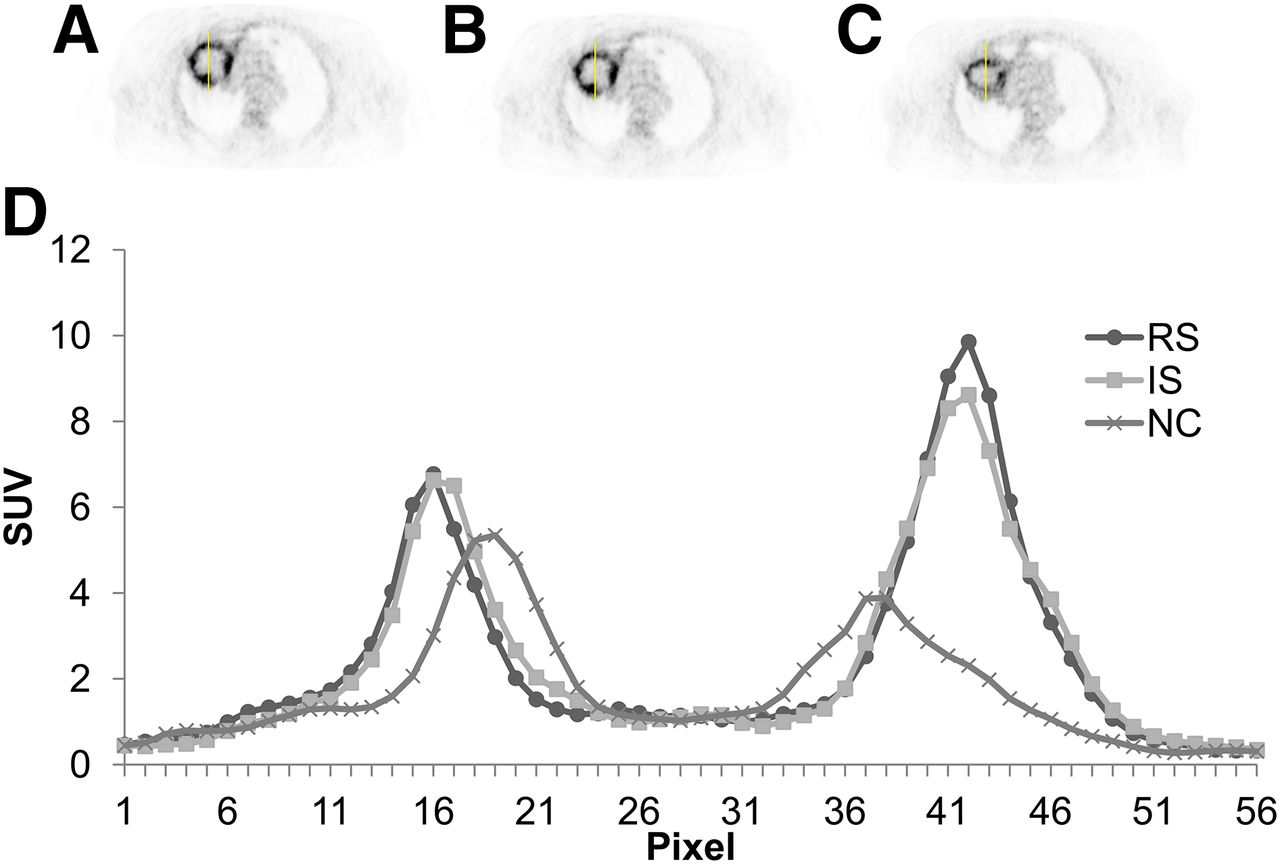
RS motion-corrected PET image (A), IS-corrected image (B), NC image (C), and corresponding profile (D).
Considering the quantitative figures of merit, the SNR indicates an improvement of 28.0% ± 5.3% for the RSC image in comparison to 24.2% ± 6.0% in the case of the ISC image relative to the NC image. In terms of contrast improvements, Figure 2 shows a mean contrast increase of 70.1% ± 27.9% and 57.2% ± 20.2% for the RSC image and the ISC image, respectively. This difference was significant between the 2 correction methods when the Wilcoxon rank sum test was used (P = 0.001). Considering the lesion position results, shown in Figure 3A, average differences in position percentage change of 60.9% ± 21.7% and 46.7% ± 22.4% for the RSC image and the ISC image, respectively, were found, indicating that both motion correction methodologies lead to changes compared with the NC image with a statistically significant advantage (P = 0.002) for the RS- versus the IS-based motion correction. The corresponding position change in millimeters (Fig. 3B) was 9.04 ± 3.27 mm versus 7.74 ± 2.99 mm, respectively. Finally, the lesion FWHM (Fig. 4) also showed statistically significant differences when the RS-based motion correction was used (P = 0.001, when comparing the 2 correction methods), with a mean lesion FWHM reduction of 60.4% ± 21.0% and 47.9% ± 16.2% for the RSC image and the ISC image, respectively.

Mean percentage improvement in contrast for lesions from 11 patients. Results are shown for both correction approaches: RS and IS in comparison to NC image.
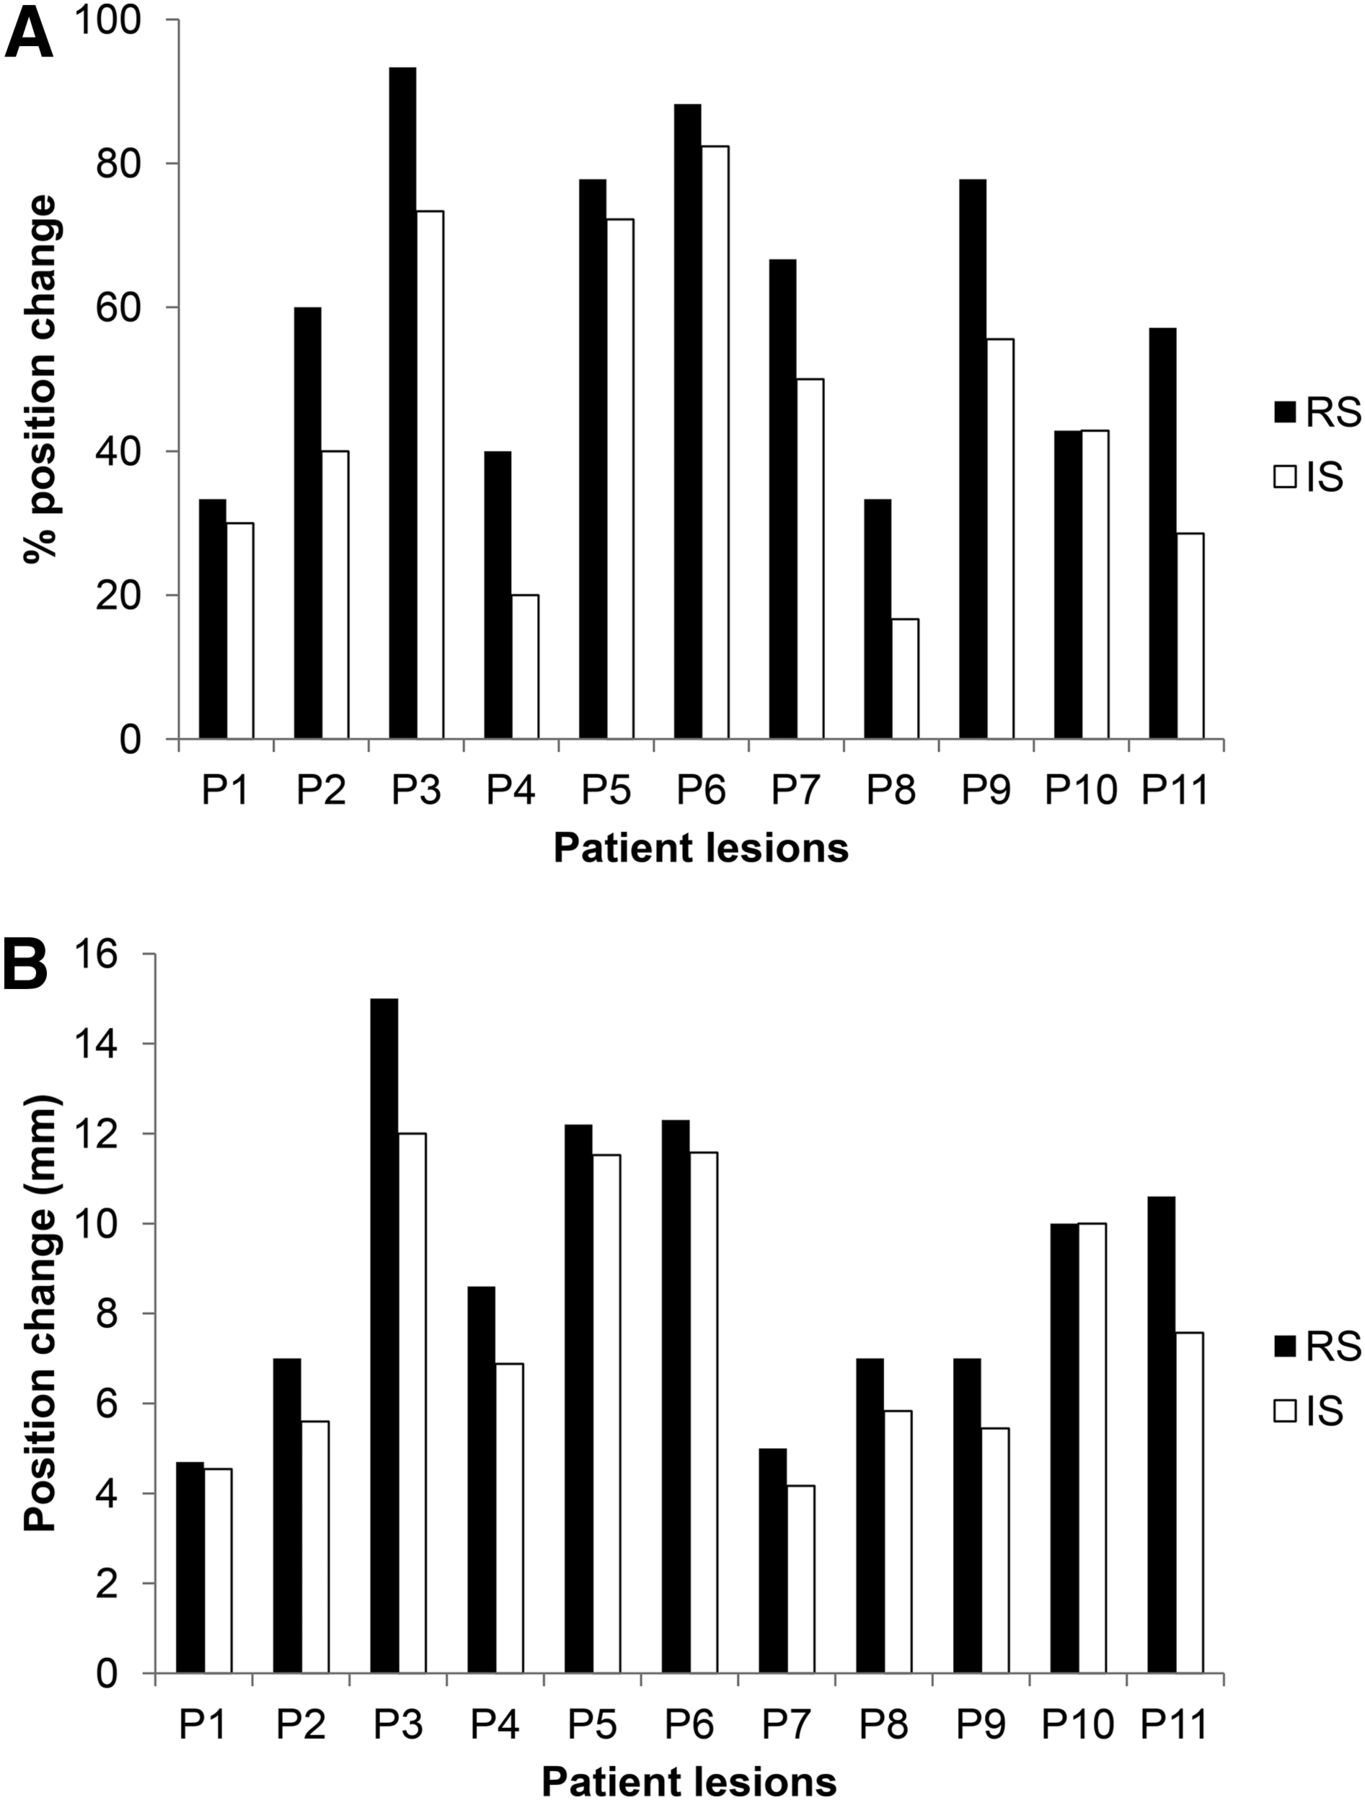
(A) Mean percentage change in position for lesions from 11 patients. Results are shown for both correction approaches: RS and IS in comparison to NC image. (B) Corresponding change in millimeters.
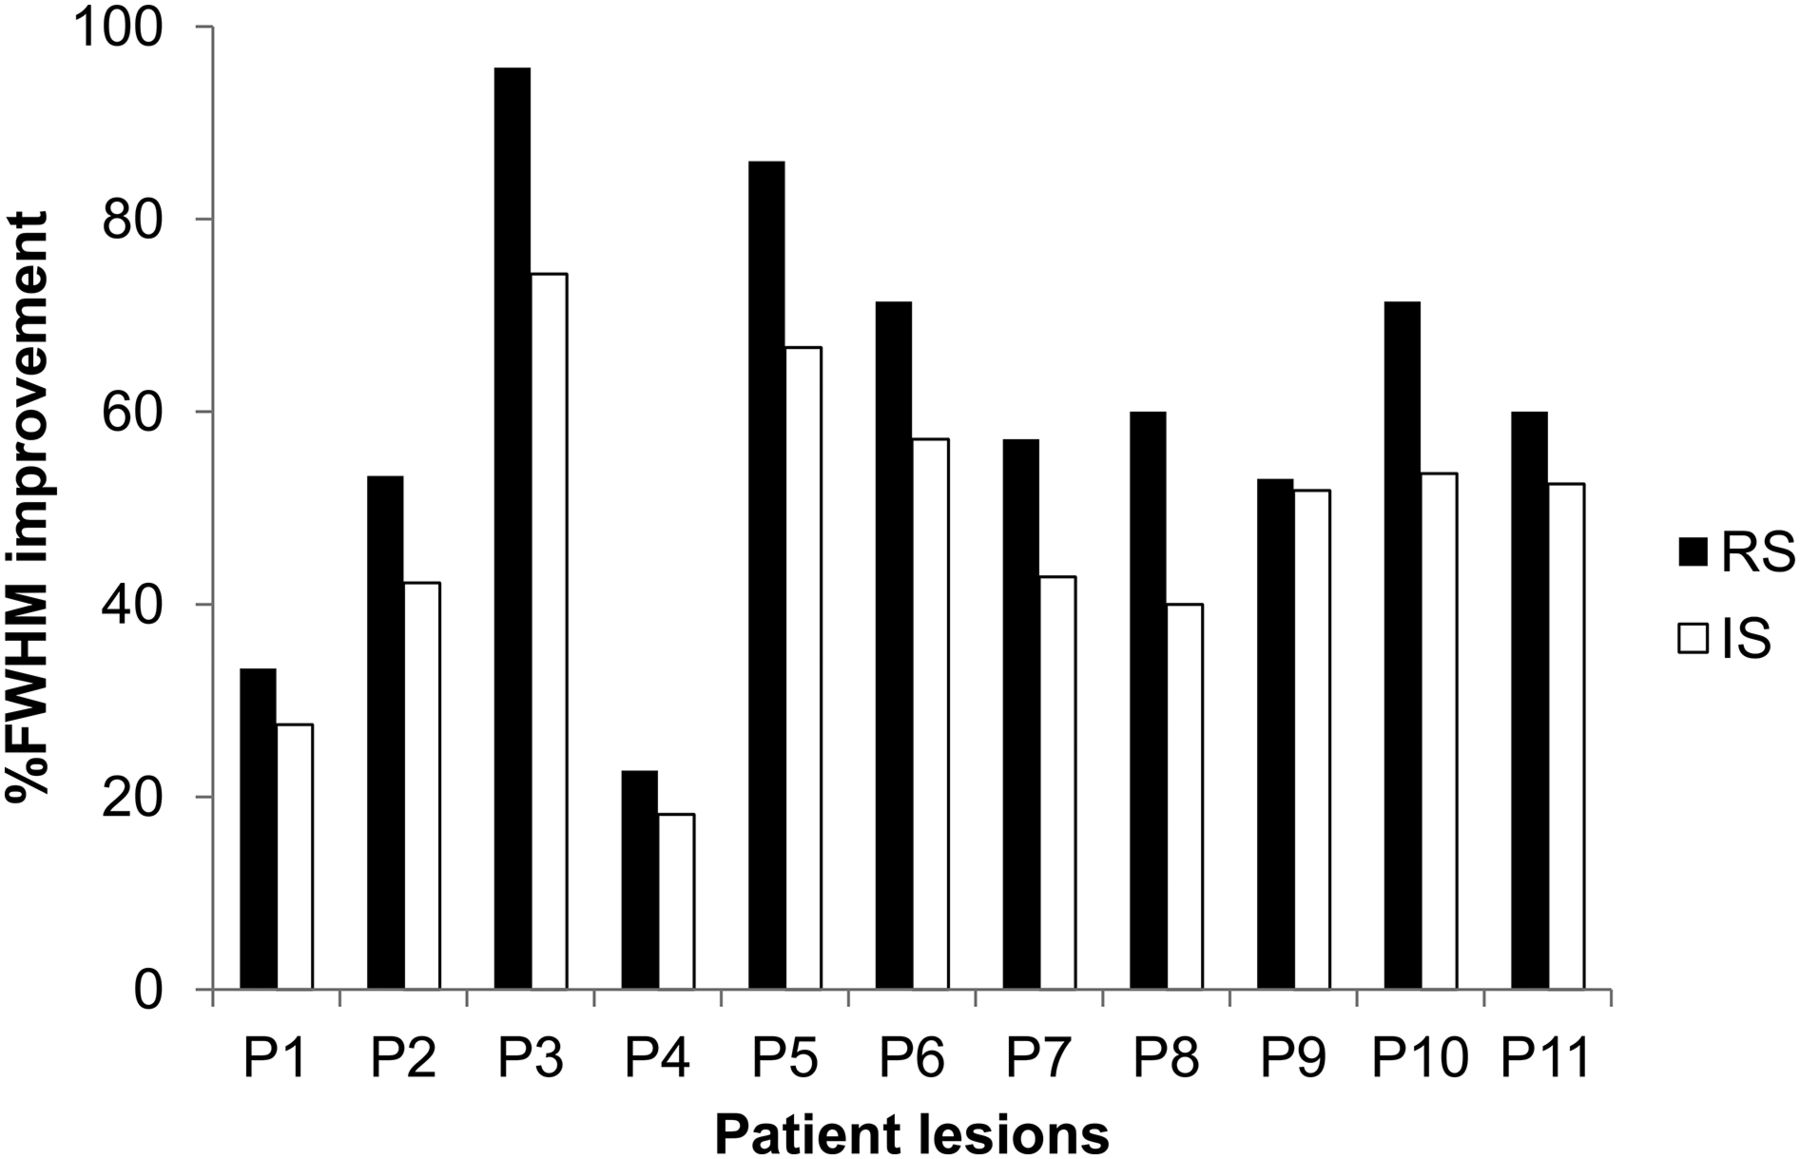
Mean percentage improvement in FWHM for lesions from 11 patients. Results are shown for both correction approaches: RS and IS in comparison to NC image.
DISCUSSION
The goal of this work was to demonstrate the feasibility of image reconstruction–incorporated respiratory motion correction in clinical PET/MR in comparison with an image-based correction approach. The RS method was based on the application of DMs extracted from 4D MR imaging datasets to the list-mode data during image reconstruction. The second approach was based on applying the 4D MR imaging DMs directly on the reconstructed respiration-synchronized PET images. Eleven patient datasets acquired on a dedicated simultaneous PET/MR imaging system were included in the validation stage. The results demonstrated that both techniques led to significant improvements in correcting for respiratory motion artifacts when compared with NC images. Moreover, the RS correction led to overall superior SNR and lesion contrast, with reduced lesion sizes when compared with the equivalent IS correction. As shown in our results, the magnitude of the motion correction effect was more important for patient lesions with large motion, especially those on the lower lobe of the lungs or in the spleen.
This RS approach was originally proposed and evaluated in 4D PET/CT imaging (8,9,26,27). In the current study, we showed its applicability to clinical 4D PET/MR imaging and demonstrated its advantages relative to the IS method. This was confirmed by the mean lesion contrast improvement (+12.9%), changes in mean lesion position (14.2%), and lesion FWHM (12.5%). These patient results are in accordance with those obtained in 4D PET/CT using simulated images (9,28). Lamare et al. (9) showed an increased lesion contrast (20%–30%) as a result of using the RS motion correction compared with the IS correction. Within the same study, they also showed improvements of more than 10% in magnitude on recovered lesion position and size between the 2 motion correction implementations. On a theoretic study using simulated datasets for thoracic PET/CT imaging, Polycarpou et al. showed a superior performance for the RS motion correction in terms of activity concentration recovery accuracy relative to the IS correction (28). The advantages of the RS motion compensation are due to multiple factors. First, the IS correction suffers from the low count statistics associated with each synchronized frame, which may cause convergence-related biases in the resulting gated reconstructed images. Furthermore, the image registration step of the individual gated PET frames that follows may introduce interpolation effects into the final image leading to resolution degradation and potential artifacts. Although such transformations are also used during the RS motion correction, these are not applied directly to the images but during the forward-projection and backprojection steps, which could minimize errors (29). Finally, in terms of computational cost the 2 correction implementations are practically equivalent. On the other hand, one has to consider the ease of implementation for the IS approach as well as the need for and added complexity of accurately accounting for attenuation or scatter corrections within the context of the RS motion correction.
A possible extension of the present study would be the comparison of DMs derived from 4D MR and 4D CT acquisitions on the same patient population. Although this was not the case in our patient cohort, if for each patient both 4D CT and 4D MR images were available, the 4D anatomic image series used to derive the DMs might have had an impact on the RS or IS motion compensation performance. Since 4D CT and corresponding 4D MR images would have different characteristics in terms of tissue contrast but also as a result of differences in data acquisition and associated sorting methodologies, one may expect the use of different image registration parameters and associated motion information extraction. On the other hand, the impact of such potential differences may be limited if one considers a combination of the overall respiratory motion amplitude and the limited spatial resolution of the PET images we are seeking to correct.
A possible limitation of this study is the relatively small numbers of patients. Additional patients may enhance the differences in the performance of the 2 correction methodologies tested in this study. However, the results based on the use of 11 PET/MR patient datasets seem conclusive with respect to the potential impact of respiratory motion correction in PET/MR for oncology applications.
Another limitation of this PET/MR study is the use of a 2-point Dixon approach for attenuation correction (acquisition time of 19 s), by classifying tissues into 4 different classes (air, lung, soft tissue, and adipose tissue), without any bone structure consideration. To resolve this issue, an ultrashort echo time triple-echo MR imaging sequence (acquisition time of 100 s) may be used (30), combining ultrashort echo time sampling for bone detection and gradient echoes for Dixon water–fat separation in a radial 3-dimensional acquisition. Since the attenuation correction data acquisition is performed during a breath-hold whereas the PET data are acquired during free breathing, an intrinsic mismatch may occur between the end-expiratory attenuation map and the end-expiratory state of the 4D MR motion data. Thus, creating a motion-corrected attenuation map directly from the 4D MR data, used for determining the patient motion, might be more appropriate.
In this work, the overall MR sequence acquisition associated with the motion correction task was 3 min long. A possible extension of the proposed correction methodology may be based on integrating a previously proposed respiratory motion model (31) to improve the temporal resolution (number of DMs) of the DMs used in the correction process (3 in this study). This can be done, as shown in preliminary results (32), by creating a motion model based on a relationship between a 2D MR navigator and the 3D motion field allowing the generation of 3D MR volumes and their corresponding DMs for each temporally corresponding navigator. To build such a model, a number (10–15) of patient 4D MR image datasets and corresponding 2D navigators are needed. However once the model is built, for a new patient only 2D navigator acquisitions in parallel to the PET data acquisition would be needed, without increasing overall acquisition times. An alternative solution will be the use of existing or the development of new approaches allowing 4D MR sequence acceleration (33) leading to the availability of 4D MR datasets with higher temporal or spatial resolution without further increasing overall acquisition times. These datasets can be used to improve the accuracy and temporal sampling of the DMs used in the RS PET motion compensation scheme proposed in this work (34).
CONCLUSION
A list-mode reconstruction-based respiratory motion correction for PET has been implemented and its performance evaluated on clinical 4D PET/MR patient datasets. This approach was based on the use of elastic transformations derived from 4D MR imaging during PET image reconstruction. Our results show significant respiratory motion compensation when compared with the motion-averaged PET images, with improved SNR, improved lesion contrast, and reduced lesion size compared with an equivalent 4D PET IS elastic motion correction method.
DISCLOSURE
The costs of publication of this article were defrayed in part by the payment of page charges. Therefore, and solely to indicate this fact, this article is hereby marked “advertisement” in accordance with 18 USC section 1734. This study was partly financially supported by the EU COST action TD1007 (www.pet-mri.eu). No potential conflict of interest relevant to this article was reported.
Footnotes
Published online Apr. 23, 2015.
- © 2015 by the Society of Nuclear Medicine and Molecular Imaging, Inc.
REFERENCES
- Received for publication December 15, 2014.
- Accepted for publication April 2, 2015.


