


Abstract
The 50% normal-tissue complication probability (NTCP) after lobar irradiation of the liver results in highly variable biologic effective doses depending on the modality used: a biologic effective dose for 50% (BED50) of 115, 93, and 250 Gy for external-beam radiotherapy, resin microsphere radioembolization, and glass microsphere radioembolization, respectively. This misunderstood property has made it difficult to predict the maximal tolerable dose as a function of microsphere activity and targeted liver volume. The evolution toward more selective catheterization techniques, resulting in more variable targeted volumes, makes it urgent to solve this issue. Methods: We computed by Monte Carlo simulations the microsphere distribution in the portal triads based on microsphere transport dynamics through a synthetically grown hepatic arterial tree. Afterward, the microscale dose distribution was computed using a dose deposition kernel. We showed that the equivalent uniform dose cannot handle microscale dosimetry and fails to solve the discordance between the BED50 values. Consequently, we developed a new radiobiologic model to compute the liver NTCP from the microscale dose distribution. Results: The new model explains all the observed BED50 values and provides a way to compute the hepatic dose-toxicity relationship as a function of microsphere activity and targeted liver volume. The NTCP obtained is in agreement with the data reported from clinical radioembolization studies. Conclusion: The results should encourage interventional radiologists to fine-tune the delivered dose to the liver as a function of the targeted volume. The present model could be used as the backbone of the treatment planning, allowing optimization of the absorbed dose to the tumors.
Selective internal radiation therapy by radioembolization with 90Y-loaded microspheres is becoming a common procedure in patients with primary hepatic neoplasia and liver-dominant metastatic disease. The evolution toward more selective catheterization techniques makes it urgent to use a model predicting the maximal tolerable delivered dose as a function of the radioembolization device and the targeted liver volume.
Recommendations for lobar radioembolization of the liver differ in maximal tolerable absorbed dose according to the medical device: less than 70 Gy when using 50 Bq of loaded resin microspheres (1) and less than 120 Gy when using 2,500 Bq of loaded glass microspheres (2). Recent voxel-based dosimetry SPECT/CT studies (3,4) support a similar difference in hepatic toxicity risk per gray for these 2 therapies. For hepatocarcinoma treated with resin spheres, Strigari et al. (3) reported 52 Gy as the mean liver tolerable dose for 50% (TD50) in a series of patients with either lobar or whole-liver radioembolization. A similar analysis conducted by Chiesa et al. (4) for the same disease treated with glass spheres in lobar radioembolization resulted in a TD50 of about 100 Gy. In recent studies on 2 Gy of fractionated external-beam radiotherapy (EBRT), Dawson et al. (5) observed a TD50 value of 64 Gy in two-thirds liver volume irradiation.
The biologic effective dose (BED) formalism accounts for the difference in dose rates between irradiation modalities (3,6). However, the resulting biologic effective dose for 50% (BED50) is still highly discordant: 115, 93, and 250 Gy for EBRT, resin microsphere radioembolization, and glass microsphere radioembolization, respectively. The values used to compute BED (α/β = 2.5 Gy and repair half-time of sublethal damage = 2.52 h) were extracted from EBRT (7). α and β values depend only on the cell type and on the linear energy transfer of the particles crossing the cell.
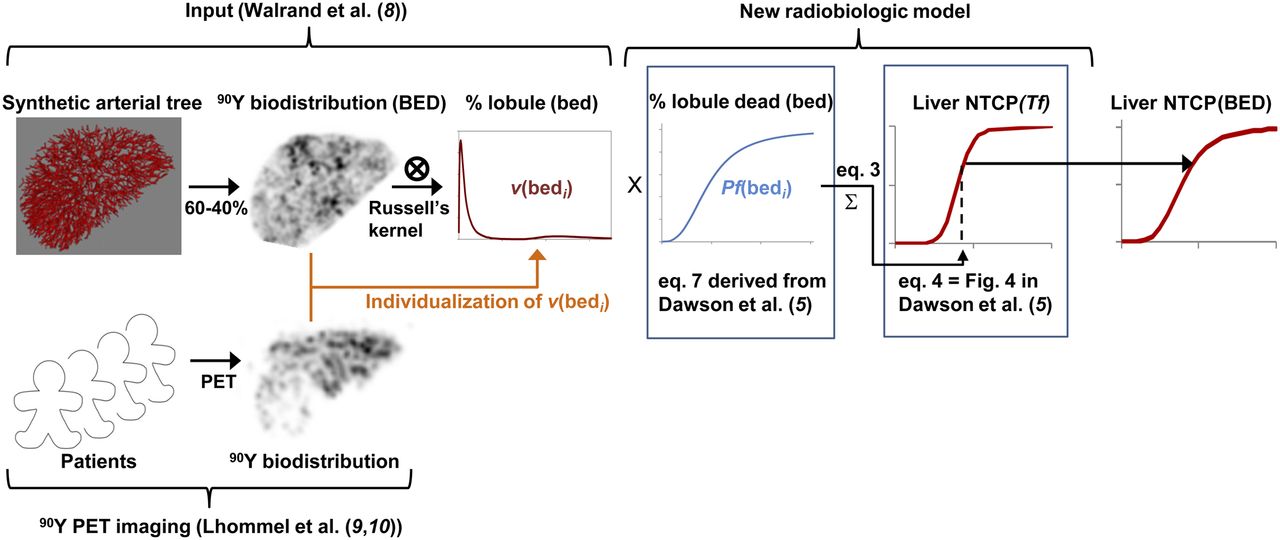
In a recent study (8), we showed by Monte Carlo simulations that the random and asymmetric spreading of microspheres between the daughter vessels at the nodes of the hepatic arterial tree induces a large nonuniformity of microscale dose distribution as observed on PET (9,10) (Fig. 1). As a result, the lobules’ dose-distribution peak is significantly shifted to a lower absorbed dose. Interestingly, for both radioembolization devices used with their own recommendation level, the structures of a similar total fraction of the lobules (≈56%) receive less than 64 Gy in right-lobe radioembolization (≈two-thirds liver). This was a first step in explaining the similar toxicity risk observed for the 2 microsphere devices using such different doses.

NTCP computation scheme. (Top) NTCP computation using simulated lobule dose distribution obtained from synthetic arterial tree. (Bottom) Potential individualization of lobule dose distribution derived from difference between simulated and patient voxel 90Y biodistribution. 90Y biodistribution was computed from synthetic arterial tree convolved with PET resolution to allow its comparison with typical 90Y time-of-flight PET imaging of patient after glass microsphere radioembolization not crossing tumors (both for delivered dose of 120 Gy to liver).
Two equivalent uniform dose (EUD) formalisms were introduced to account for the impact of the nonuniformity of the delivered dose: the Kutcher and Burman (11) dose histogram volume reduction and the Jones and Hoban (12) formalism based on cell survival fraction. However, concerns were expressed about the applicability of EUD to organs structured in different functional subunits, especially when those subunits are smaller than the dose distribution voxel size (12,13).
We show in this paper that both EUD formalisms using microscale dose distribution failed to simultaneously describe the hepatic toxicity risk relationship observed in EBRT and in radioembolization. Consequently, to compute the normal-tissue complication probability (NTCP), we developed a new radiobiologic model based on a single-lobule dose–death probability relationship derived purely from EBRT clinical data. Finally, to optimize the delivered dose, we sketched out a treatment plan based on the developed model.
MATERIALS AND METHODS
Liver Dosimetry Model
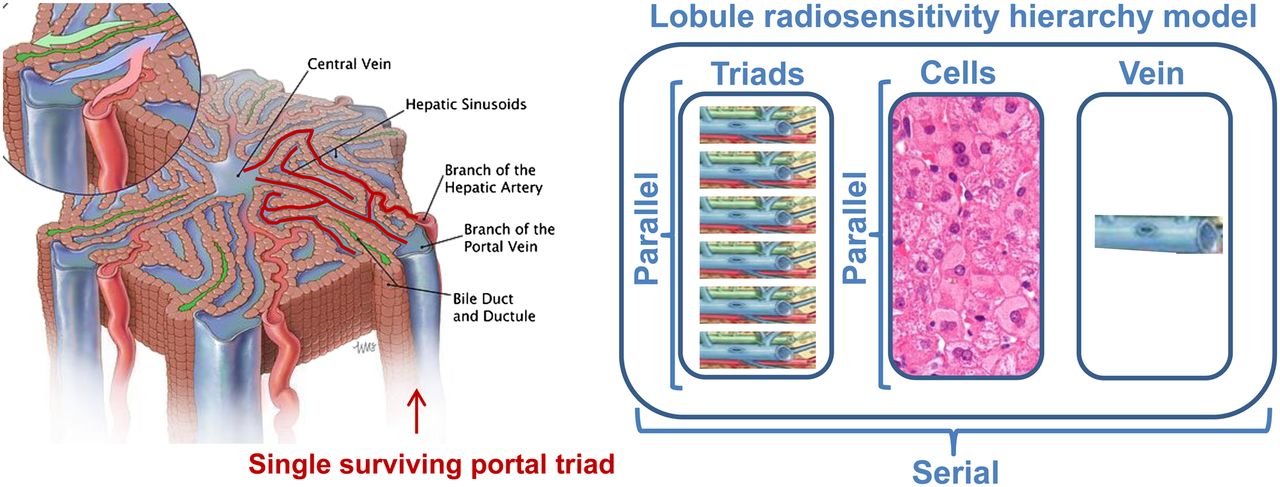
Each hepatic lobule is modeled by a 1.5-mm-long hexagonal prism of 1.2-mm side–to–opposite-side distance (Fig. 2, left). The portal triads (i.e., portal venule, portal artery, and bile duct) are located at the 6 corners of the hexagon. The centrilobular vein is parallel to the portal triads and is located in the center of the hexagon. The liver contains about 106 lobules and 2 × 10⁶ portal triads (6 portal triads per lobule but each shared by 3 lobules). Doses of 60 Gy and 120 Gy delivered to liver tissue correspond to 25 resin microspheres and 1 glass microsphere per triad, respectively.

Lobule radiosensitivity hierarchy model. (Left) Schematic representation of lobule. (Courtesy of Educational Resource Center, College of Veterinary Medicine at University of Georgia; art by Will McAbee.) Because hexagon side-to-side distance is about 1,200 μm, almost all lobule structures are closer than 500 μm from small arteriole or venule (highlighted in red) still transporting blood from only surviving triad (right one). (Right) Lobule is assumed to be serial tissue regarding portal triads, hepatic cells, and centrilobular vein subsets, whereas each subset is assumed to be parallel tissue regarding their respective subunits.
Lobule Dose Distribution Model
The lobule dose distribution was computed according to a previously published model (8). Briefly, a synthetic hepatic arterial tree was grown by randomly selecting the lobules one by one. The selected lobule was connected via a new vessel to the closest existing vessel, which was folded in order to minimize the total length of the vessels (as presented in a demonstration by Schwen and Preusser (14)).
The probability for each portal artery to trap a microsphere leaving the catheter tip was the product of all consecutive microsphere spreading probabilities along the nodes of the arterial tree going from the catheter tip to the portal artery. At each node, the microsphere spreading probability was assumed asymmetric (40%–60%) between the 2 daughter vessels as predicted by Kennedy et al. (15) using computer modeling.
The portal arteries were randomly populated, microsphere by microsphere, accordingly to their individual probability to trap a microsphere leaving the catheter tip (Monte Carlo process). The portal arteries have a length of about 1,300 μm and should thus be fully filled after trapping about 40 microspheres. However, 9% of the portal triads do not own any portal artery, and the other 81% own, on average, 2.9 portal arteries, resulting in an overall average of 2.4 portal arteries per triad (16). Two scenarios were investigated: a fixed value of 2.9 portal arteries per triad in 81% of the triads randomly selected, and a random distribution of the portal artery number following a Poisson law with a mean of 2.4 portal arteries per triad (in this case, the probability of 0 arteries is e−2.4, i.e., in line with the observed 9%).
To take into account the physical embolization in the portal triads, the individual blood flow of the portal artery was reduced each time a microsphere was trapped. This reduction was performed in such a way that the trapping probability of the portal triad linearly decreased to zero when there were several trapped microspheres equal to 40 times the number of portal arteries in this considered triad. Simulations corresponding to various BEDs were performed for the radioembolization of whole-liver and of two-thirds liver, both for different loaded 90Y activities ranging from 0.05 to 2.5 kBq per microsphere.
Lastly, the delivered doses to the structures of each lobule at a microscale level were computed using the dose deposition kernel of Russell et al. (17).
New Radiobiologic Model: Lobule Toxicity
Each lobule was considered as a strictly serial functional subunit with regard to the portal triad, the hepatocytes, and the centrilobular vein (Fig. 2, right); that is, if any of these 3 structures fails, the lobule will not be able to recover.
Typically, oxygen and nutrients can diffuse up to about 500 μm in soft tissue. Thus, one surviving portal triad could be sufficient to allow recovery of the lobule. So, in addition to the mean dose of the different structures in each lobule, we computed the minimal dose of the 6 portal triads in the lobule.
Because lobules were considered as small organs, the probability Pf of lobule failure was thus modeled by the logistic sigmoid function as previously proposed by Jackson et al. (18). This function can model the sigmoid shape of many observed dose responses, and its use is now recommended by the American Association of Physicists in Medicine (19): Eq. 1where bed is the biologic effective dose of the most critical lobule structure (serial organ), bed50 corresponds to a 50% chance of lobule failure, and γ is a parameter that describes the transition slope of the sigmoid function. These 2 parameters were fitted in order to have, for the BED50(Vf) value observed in EBRT after irradiation of the liver volume fraction Vf, a total fraction of killed lobules as close as possible to 40%, namely the value observed by Dawson et al. (5) for an NTCP of 0.5; that is:
 Eq. 2
Eq. 2
As a result, the total fraction (Tf) of damaged lobules can be derived from the lobule dose distribution using: Eq. 3where v(bedi) is the fraction of lobules receiving a dose bedi to their most critical structure (serial organ).
New Radiobiologic Model: Hepatic Toxicity
As presented in their Figure 4, Dawson et al. (5) found a relation between the liver NTCP and the total fraction Tf of lobules damaged, which can be fitted with: Eq. 4
Eq. 4
The liver NTCP was computed with Equation 4 using the theoretic lobule dose distributions corresponding to various BEDs as input of Equations 1 and 3 (Fig. 1, top row).
The parameters of both the lobule dose-toxicity relationship and the hepatic damaged fraction–NTCP relationship were determined purely from the EBRT clinical studies.
RESULTS
Lobule Dose Distributions
Figure 3 shows the lobule dose distributions in the targeted liver volume as functions of the dose delivered to the 3 different structures of the lobules. There was only a small difference between constant and random number of portal arteries per triad using the resin microspheres and no difference at all using the glass microspheres, for which the physical embolization effect of the portal arteries is marginal. The most irradiated structure was the portal triad subset. Consequently, the lobule dose distribution as a function of the lowest irradiated portal triad was used as input in the different liver EUD and NTCP computations.

Microscale dose distributions. (A) Total lobule fraction as function of BED delivered to hepatocytes and centrilobular vein subsets. (B) Total lobule fraction as function of BED of less irradiated portal triad. Lobule dose distributions were derived from resin and glass microsphere transport dynamics in synthetically grown hepatic arterial tree (8) for constant number (2.9) of portal arteries in 81% of triads (C) and for several portal arteries per triad following Poisson law of 2.4 mean (P). Distributions were computed for predicted TD50 in two-thirds liver radioembolization (Table 1). Similar lobule dose distributions are obtained for the 2 radioembolization devices regarding less irradiated portal triad (B).
EUD Formalism
The Kutcher and Burman EUD (EUDKB) (11) is defined as the generalized mean: Eq. 5where Vi is the volume fraction of the tissue receiving a biologic effective dose BEDi and a is a parameter depending on the tissue. When a = 1, Equation 5 reduces to the arithmetic mean. For a widely positive or negative value of a, EUDKB approaches the maximal or minimal BEDi. These 2 ranges of values describe a serial tissue (e.g., organs) or a parallel tissue (e.g., tumors), respectively. The power factor in the EUDKB formalism giving the most similar EUD50 for the different values of BED50 observed in EBRT was a = 1.06.
The Jones and Hoban EUD (EUDJH) (12) is defined as: Eq. 6The term between brackets is nothing other than the survival fraction. α is the tissue radiosensitivity, which was found to be 0.0065 Gy−1 in order to damage 40% of the lobules for the BED50 in whole-liver EBRT according to Dawson et al. (5).
Table 1 shows the EUD50 obtained for the BED50 observed with the different irradiation modalities. Using the lobule dose distribution as input, the EUDKB50 was 239 and 433 Gy for resin and glass microsphere radioembolization, respectively. These values are highly discrepant with the expected value of 77 Gy, which is the BED that—when uniformly delivered in whole-liver EBRT—gives an NCTP of 0.5. On the other hand, the EUDJH50 is not constant with the volume fraction irradiated in EBRT.
Observed and Predicted Doses (Gy) Giving NTCP of 0.5 for Different Irradiation Modalities
New Radiobiologic Model
The modeling of the lobule dose-failure probability Pf gave:  Eq. 7Using this equation, the total fraction of damaged lobules for the BED50 predicted for the different partial volumes irradiated in EBRT (40.0% ± 0.4%) were close to the value (40%) observed by Dawson et al. (5) for an NTCP of 0.5.
The fraction obtained for the BED50 observed in radioembolization of two thirds of the liver volume using glass microspheres was also in good agreement (41%). The exact 40% of total damaged lobules was obtained for a delivered dose of 99 Gy—close to the 100 Gy observed by Chiesa et al. (4) in SPECT/CT dosimetry studies.
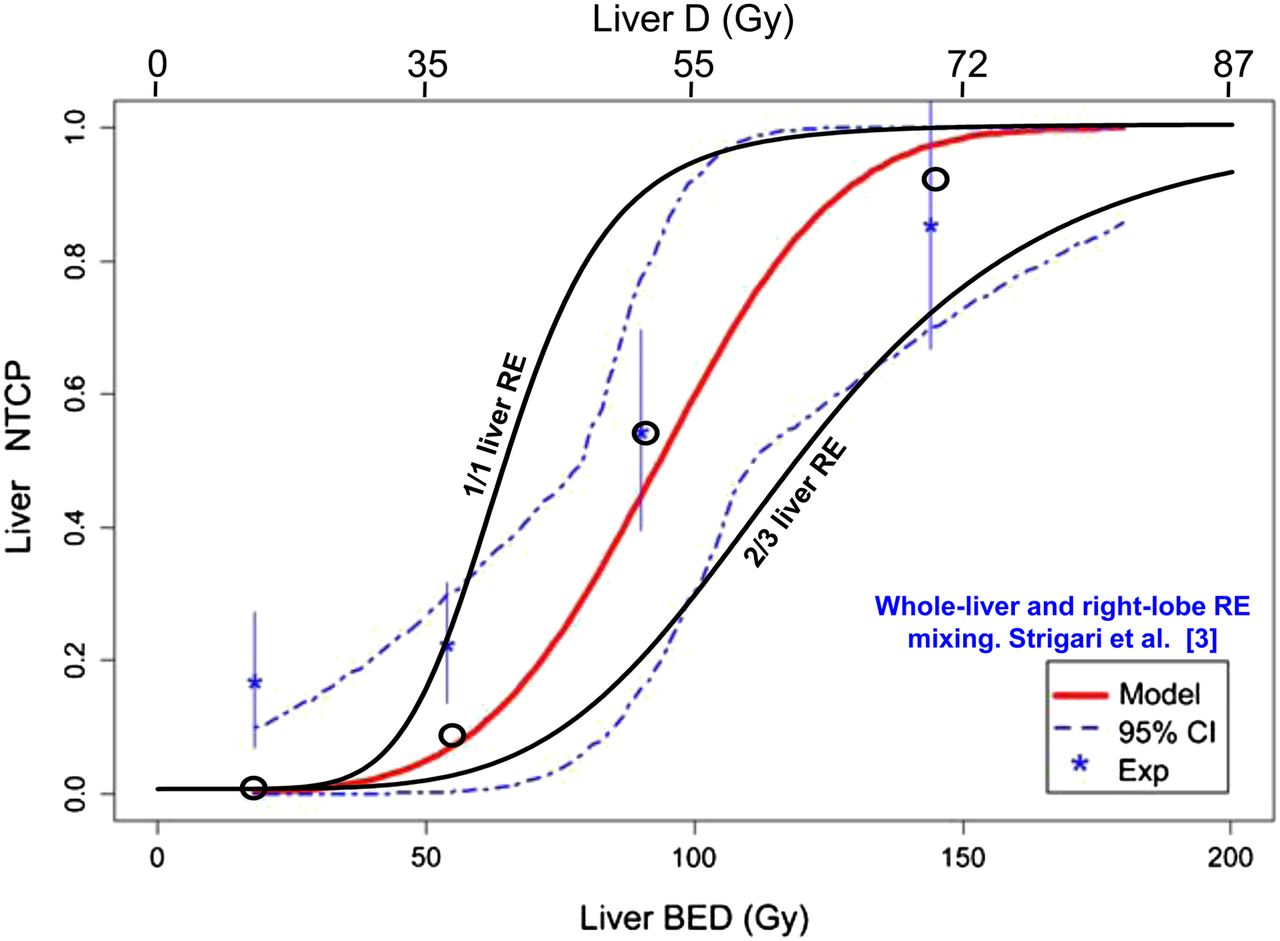
Figure 4 shows for the resin microspheres the NTCP in radioembolization of the whole liver and of two thirds of the liver obtained using the new radiobiologic model compared with the experimental data of Strigari et al. (3) in mixed whole-liver and right-lobe radioembolization studies.

Comparison of observed and predicted liver NTCP. Shown are Lyman–Burman Kutcher fit (red line) of NTCP observed in SPECT/CT dosimetry clinical study (asterisks) mixing whole-liver (35 patients), right-lobe (35 patients), and left-lobe (3 patients) resin radioembolization; SD (vertical bars); 95% confidence interval (dashed line); liver absorbed dose (D); predicted NTCP in whole-liver and two-thirds liver resin radioembolization (RE) computed using new radiobiologic model (black lines); and predicted NTCP accounting for proportion of whole-liver, right-lobe, and left-lobe RE present in each observed point (circles). (Data are from Strigari et al. (3) and from written communication with Strigari, October 2013). CI = confidence interval.
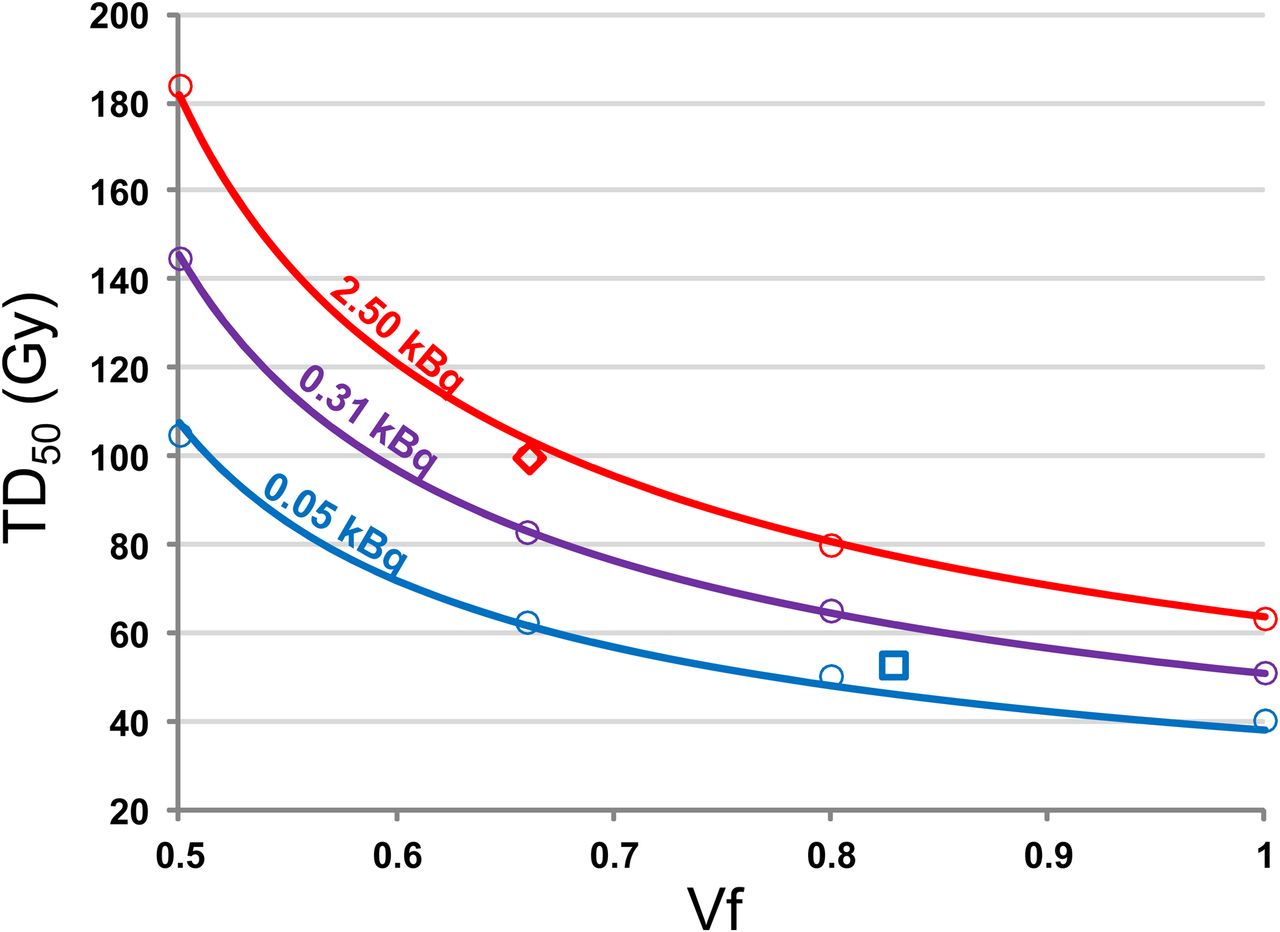
Figure 5 shows the TD50 (Gy) as a function of the targeted volume fraction Vf and for different loaded 90Y activities msA (kBq) per microsphere. As shown in the figure, those simulated TD50 values can be fitted by:  Eq. 8The maximal deviation of the fit prediction was 6.6%, for a mean deviation of 2.0%.

TD50 as function of targeted liver volume fraction Vf for different microsphere activities computed using radiobiologic model. Circles are Monte Carlo simulations. Curves are fit using Equation 8. Red and blue colors correspond to glass and resin microspheres, respectively, at day of calibration. Purple color corresponds to glass microspheres used 8 d after calibration. Diamond is TD50 observed in right-lobar radioembolization using glass microspheres (4). Square is TD50 observed in mixing of right-lobar and whole-liver radioembolization using resin microspheres (3).
The corresponding NTCP for whole-liver and right-lobe radioembolization as a function of the delivered D to the targeted liver volume fraction Vf can be fitted by the logistic function: Eq. 9using:
 Eq. 10The maximal deviation of the fit prediction was 17.0%, for a mean deviation of 7.4%.
DISCUSSION
EUD Formalisms
The results show that although the EUDKB formalism correctly describes the toxicity risk in partial-liver-volume EBRT (Table 1), it failed to explain the toxicity risk in liver radioembolization, for which the observed BED50 resulted in an EUDKB50 about 5-fold higher than in EBRT (Table 1). This result is due to incorrect handling of high doses in the EUDKB formalism (Supplemental Appendix A and Supplemental Fig. 1, available at http://jnm.snmjournals.org).
In contrast, the EUDJH formalism succeeded in giving a similar EUD50 for the dose-toxicity risk observed in whole-liver EBRT and in resin or glass microsphere radioembolization. However, the EUDJH formalism failed to predict the different BED50 values observed in partial-liver-volume EBRT. This failure arises from the fact that a hepatic lobule is not a unique cell but a functional subunit (Supplemental Appendix B).
New Radiobiologic Model
The new radiobiologic model, using the simulated microscale dose distribution as input, correctly predicts the different TD50 values observed in resin or glass microsphere radioembolization and in partial-liver-volume EBRT (Table 1). For resin microspheres, the derived whole-liver and two-thirds liver dose–NTCP relationships symmetrically encompass the experimental curve observed by Strigari et al. (3) in an approximately 50%–50% mixing of whole-liver and right-lobe (≈two-thirds liver) radioembolization. Taking into account the actual proportion of whole-liver and right-lobe radioembolization corresponding to each data point (Strigari et al., written communication, October 2013), the computation of NTCP resulted in predicted points close to the observed data fit.
The new radiobiologic model used the lobule distribution as a function of the less irradiated portal triads as input and consists of 2 steps (Fig. 1). The input is averaged with the lobule dose-failure probability relation Pf(bed) observed in EBRT (Eq. 7), which gives the total fraction Tf of killed lobules. This total fraction is introduced in the NTCP(Tf) relation observed in EBRT (Eq. 4). The fact that the 2 relations used in these 2 steps were derived from pure EBRT clinical data supports the validity and the coherence of the model.
Limitations of the Model
A single surviving portal triad was assumed to be enough to allow lobule recovery. This is a crude assumption, and likely the recovery of such lobules will also depend on the injury level of their 5 other portal triads. However, predicting the lobule death probability as a function of the individual doses delivered to the 6 portal triads will introduce an additional adjustable parameter representing the parallelism level of the portal triad subset. Consequently, supported by the oxygen and nutrient diffusion length in soft tissue, we made the basic assumption that this structure was strictly parallel.
Limitations exist in 3 components of the present lobule dose distribution simulation: arterial tree, dynamics, and lobule structures. Regarding the arterial tree, to achieve a feasible computation time, the total vessel length was minimized rather than the total vessel volume. Regarding dynamics, a fixed 40%–60% microsphere spreading probability was assumed between the daughter vessels at each node. The availability of a variable spreading probability that depends on vessel diameter and curvature would be preferable. Regarding lobule structures, a constant size was used for all lobules. The actual distribution of the lobule sizes should be assessed, as well as a possible correlation between the size of a lobule and the number of portal arteries in its triads. All portal arteries in a single triad were assumed to be the terminations of the same artery branch. This assumption should also be assessed. In other words, are the multiple portal arteries per triad a way to increase the amount of blood being fed to big lobules or just a result of simultaneous recruitment of different neighbor vessels during lobule genesis?
Fortunately, the random nature of the number of portal arteries per triad had a much smaller impact on the microscale dose distribution than that of the random 40%–60% microsphere spreading probability, because the spreading asymmetry has a vertical propagation along the arterial tree, that is, from the catheter tip to the triads, ending with long-range heterogeneities in the microsphere distribution. In contrast, the horizontal nature of the random number of portal arteries per triad induces only uncorrelated fluctuations in the microsphere distribution.
90Y PET spatial resolution (currently ≈9 mm) will likely never be good enough to allow a direct estimation of lobule (≈1.5 mm) dose distribution in patients. The further step needed will be to develop a model allowing estimation of how the voxel activity distribution assessed by 90Y PET imaging (9,10) could modify the simulated lobule dose in order to provide a patient-individualized liver NCTP (light brown arrow in Fig. 1).
The radiobiologic model could be extended to other internal radiotherapies, such as 90Y-DOTATOC or 177Lu-DOTATATE for the toxicity risk of the kidney, whose cortex also displays a nonuniform activity distribution (20).
Perspective: Individualized Treatment Planning
Because TD50 substantially depends on the targeted liver fraction (Fig. 5), the first step of treatment planning should be to assess which selective liver volume fraction Vf is most compatible with the tumor burden. In this way, the dose delivered to the liver tissue could be significantly increased, in turn allowing an increase in the dose delivered to the tumors. The second step should be to choose the desired NTCP as a function of the liver reserve, age, and life expectancy of the patient. These 2 steps require the input of the entire medical staff, that is, oncologist, nuclear physician, and hepatologist.
Afterward, the corresponding delivered dose D to the targeted liver tissue can be determined using Equations 8–10. According to Dawson et al. (5), when less than 40% or 30% of the liver volume is targeted, the NTCP is always lower than 0.5 or 0.1, respectively. In this case, no dose limitation is imposed by the current radiobiologic model, and the radioembolization can be used as a liver segment ablation.
The next step is the conventional arterial tree preparation in order to achieve the aimed targeted liver fraction, followed by 99mTc-macroaggregated albumin injection. After exclusion of an excessive lung shunt fraction, the aimed delivered dose to the liver tissue can be reevaluated using the actual targeted liver volume as measured on 99mTc-macroaggregated albumin SPECT/CT. Then, the activity to be injected can be computed on the basis of the desired delivered dose and on liver tissue uptake measured on 99mTc-macroaggregated albumin SPECT/CT.
Last, a microsphere delivery check has to be performed, preferably using time-of-flight PET/CT, to implement preventive actions, especially in cases of extrahepatic activity delivery.
CONCLUSION
Overall, the new radiobiologic model unifies and explains the different hepatic dose-toxicity relationships observed in EBRT and in resin or glass microsphere radioembolization. It provides an estimation of the TD50 as a function of 2 important parameters (Fig. 5; Equation 8): microsphere activity, which is useful when injecting several days after the manufacturer calibration date, and targeted liver volume, which takes on paramount importance as increasingly selective catheterization procedures are introduced.
More directly, the data provided information to the interventional radiologist and to the nuclear physician on how to fine-tune the delivered dose to the liver as a function of the actual volume targeted (Fig. 5). Introduction of more elaborate treatment planning based on the provided NTCP equation should improve the efficiency of therapy.
DISCLOSURE
The costs of publication of this article were defrayed in part by the payment of page charges. Therefore, and solely to indicate this fact, this article is hereby marked “advertisement” in accordance with 18 USC section 1734. No potential conflict of interest relevant to this article was reported.
Acknowledgments
We thank Dr. Lidia Strigari for providing valuable information and Dr. Carlo Chiesa for his valuable discussions.
Footnotes
Published online Jun. 5, 2014.
- © 2014 by the Society of Nuclear Medicine and Molecular Imaging, Inc.
REFERENCES
- Received for publication November 15, 2013.
- Accepted for publication April 9, 2014.


Jump to section
Related Articles
Cited By...
- No citing articles found.