


Abstract
Current radiologic methods for diagnosing breast cancer detect specific morphologic features of solid tumors or any associated calcium deposits. These deposits originate from an early molecular microcalcification process of 2 types: type 1 is calcium oxylate and type II is carbonated calcium hydroxyapatite. Type I microcalcifications are associated mainly with benign tumors, whereas type II microcalcifications are produced internally by malignant cells. No current noninvasive in vivo techniques are available for detecting intratumoral microcalcifications. Such a technique would have a significant impact on breast cancer diagnosis and prognosis in preclinical and clinical settings. 18F-NaF PET has been used solely for bone imaging by targeting the bone hydroxyapatite. In this work, we provide preliminary evidence that 18F-NaF PET imaging can be used to detect breast cancer by targeting the hydroxyapatite lattice within the tumor microenvironment with high specificity and soft-tissue contrast-to-background ratio while delineating tumors from inflammation. Methods: Mice were injected with approximately 106 MDA-MB-231 cells subcutaneously and imaged with 18F-NaF PET/CT in a 120-min dynamic sequence when the tumors reached a size of 200–400 mm3. Regions of interest were drawn around the tumor, muscle, and bone. The concentrations of radiotracer within those regions of interest were compared with one another. For comparison to inflammation, rats with inflamed paws were subjected to 18F-NaF PET imaging. Results: Tumor uptake of 18F− was significantly higher (P < 0.05) than muscle uptake, with the tumor-to-muscle ratio being about 3.5. The presence of type II microcalcification in the MDA-MB-231 cell line was confirmed histologically using alizarin red S and von Kossa staining as well as Raman microspectroscopy. No uptake of 18F− was observed in the inflamed tissue of the rats. Lack of hydroxyapatite in the inflamed tissue was verified histologically. Conclusion: This study provides preliminary evidence suggesting that specific targeting with 18F− of hydroxyapatite within the tumor microenvironment may be able to distinguish between inflammation and cancer.
Breast cancer is the second most common malignancy among women, accounting for nearly 1 in 3 cancers diagnosed in the United States. It is the second leading cause of cancer death among women, causing almost 40,000 deaths in 2011 alone (1). Current imaging techniques may fail to detect tumors (false-negative) because of their small size or location in the breast, obscuration by nearby organs, or dense breast tissue (2).
One significant feature of breast cancer diagnosis is the presence of calcium deposits (averaging 0.3 mm3 in size) detected via mammograms (3–5). These calcium deposits are potentially the result of condensation of 1 of 2 types of microcalcification found within the tumor microenvironment: type I, which contains calcium oxalate dehydrate, and type II, which contains calcium phosphates in the form of hydroxyapatite (6). Importantly, type I deposits are associated with benign breast disease, whereas malignant cells have the unique capability of producing hydroxyapatite (4,7,8). Alkaline phosphatase on the surface of malignant cells hydrolyzes β-glycerophosphate to glycerol and inorganic phosphate, which is transported into the cell by the type II family of sodium–inorganic phosphate cotransporters. There, the inorganic phosphate combines with calcium to produce hydroxyapatite crystals. Hydroxyapatite then leaves the cells, by unknown mechanisms, to enter the extracellular matrix. Furthermore, hydroxyapatite enhances the mitogenesis of mammary cells, amplifying the malignant process and resulting in accelerated tumor growth (7,8). Therefore, hydroxyapatite may be a biomarker for breast malignancy.
Apatite calcification in bone is generally composed of hydroxyapatite (9). The carbonate substitution for phosphate in the bioapatites significantly increases the reactivity of these compounds, especially to anions such as fluoride, allowing them to substitute into the lattice (10). Sodium fluoride labeled with 18F− (18F-NaF) has previously been used for bone imaging and bone hydroxyapatite abundance quantification, as well as for detecting bone metastases using PET. The free fluoride dissociates from the sodium and binds to the hydroxyapatite matrix (Ca10(PO4)6OH2) of the skeleton (11), where 18F− substitutes for the OH− of the hydroxyapatite and forms fluoroapatite (Ca10(PO4)6F2) (12).
Our working hypothesis is that the same mechanisms of uptake of 18F− in bone apply to breast tumors containing hydroxyapatite within their microenvironment. Therefore, we investigated the ability of 18F-NaF to detect breast tumors via targeting of the hydroxyapatite microenvironment using mouse models of MDA-MB-231, a triple-negative human breast cancer cell line that does not express the genes for estrogen receptor, progesterone receptor, or Her2/neu. MDA-MB-231 cells produce highly invasive malignant tumors (13). Thus, this cell line is a prototype for highly differentiated breast cancer cells with overexpressed epidermal growth factor receptors (14). We then assessed the ability of this technique to discriminate between inflammation and cancer by applying it to a rat model of acute inflammation.
MATERIALS AND METHODS
All studies were approved by the Vanderbilt University Animal Care and Use Committee before the experiments began.
Tumor Model and Imaging
MDA-MB-231 cells were cultured in Dulbecco modified Eagle medium (Invitrogen) supplemented with 10% fetal bovine serum and 1% penicillin streptomycin (Invitrogen) at 37°C in a humidified, 5% CO2 incubator. Four- to 5-wk-old female Foxn1 nu/nu mice were injected subcutaneously in the right hind limb (n = 10) with about 10 million MDA-MB-231 cells in a 1:2 ratio of Matrigel and Dulbecco modified Eagle medium.
Once the tumors reached 200–400 mm3, the mice were imaged in a microPET Focus 220 (Siemens Preclinical Solutions) for 120 min in dynamic acquisition mode with a simultaneous intravenous injection of about 18 MBq of 18F-NaF, provided by the Vanderbilt Radiochemistry Core. All mice were anesthetized with 2% isoflurane vaporized with oxygen at a steady flow rate of 2.5 L/min during imaging. The dynamic acquisitions consisted of twelve 5-s frames, four 60-s frames, one 5-min frame, and eleven 10-min frames. All datasets were reconstructed using the maximum a posteriori algorithm into 128 × 128 × 95 slices with a voxel size of 0.95 × 0.95 × 0.8 mm at a β value of 0.001. Immediately after the PET scans, the mice were imaged in a microCAT II (Siemens) at an x-ray beam intensity of 180 mAs and an x-ray tube voltage of 80 kVp for anatomic coregistration with the PET images. The images were reconstructed in a 512 × 512 × 512 matrix with a voxel size of 0.122 × 0.122 × 0.173 mm.
Inflammation Model and Imaging
Carrageenan (100 μL of a 1% solution in sterile saline) was injected subcutaneously into the rear right footpad of wild-type Sprague Dawley rats (n = 3). Two hours later, when inflammation was maximal (15), the rats were injected with 18F-NaF and imaged in our microPET Focus 220 for 30 min at 1 h after radiotracer administration in static mode followed by a CT scan as described earlier.
Histologic Search for Hydroxyapatite
Staining
Immediately after PET/CT imaging, the tumors and muscle were harvested. For the rat inflammatory model, the feet were harvested at the end of the imaging session. Sections of the harvested tissue (5 μm) were loaded onto glass slides and assessed for mineralization via alizarin red S and von Kossa staining. The staining process was performed at the Vanderbilt Translational Pathology Shared Resource, which uses manufacturer-provided staining protocols. Positive staining for alizarin red S (color, red) indicates the presence of calcium, whereas positive staining for von Kossa (color, black/brown) indicates the presence of calcium phosphates (8).
Raman Microspectroscopy
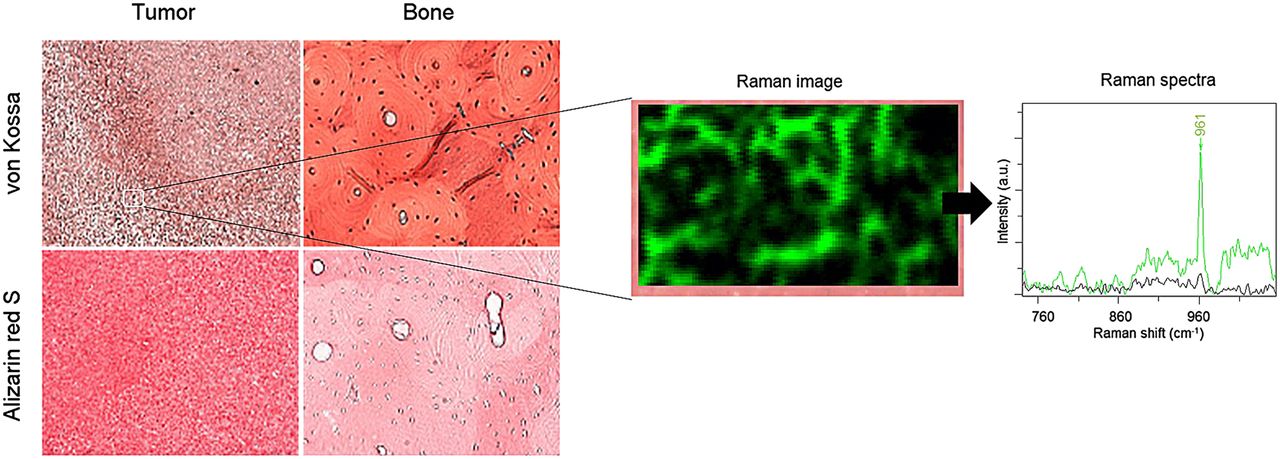
The stained tissue sections, along with stained mouse bone sections provided by the Translational Pathology Core at Vanderbilt University, were subjected to Raman microspectroscopy using an inVia Raman microscope (Renishaw) with a 785-nm laser and a ×50 objective (numeric aperture, 0.75). Regions of 100 × 60 μm of the sample were mapped over the entire section, and Raman spectra were acquired over those areas with an axial resolution of 1 μm. A shift near 960 cm−1 is typical of hydroxyapatite (6,8,16). Spectra were processed using WiRE software, version 3.3 (Renishaw). The bone slides were used for initial calibration. On the basis of the Raman spectra, regions on the mapped sample were classified using a direct classic least-squares method and were color-coded in green to indicate a 960 cm−1 shift or black to indicate no shift.
Data Analysis
Anatomic regions of interest (ROIs) were drawn around the entire tumor, hip bones, lungs, heart, and muscle of the opposing hind limb on the CT images for each mouse using the medical imaging analysis tool AMIDE (17) and superimposed on the PET images. In addition, ROIs were drawn around the corporal arenacea (brain sand) directly on the PET images because CT cannot accurately distinguish brain regions. Time–activity curves were established for all ROIs over the entire duration of the dynamic scans. For the rat inflammation studies, ROIs were drawn around each paw on the CT images and superimposed on the PET images.
The distribution of 18F− is determined by blood flow initially and then clears rapidly from plasma and is excreted by the kidneys (12). In the bone, the 18F− ions pass through plasma to the extracellular fluid space, into the shell of bound water on the hydroxyapatite crystal surface, and into the interior of the crystal, where 18F− exchanges for OH− on the hydroxyapatite lattice. The kinetics of 18F− moving from the blood plasma to incorporation into fluoroapatite have been described by a 3-compartment model (12,18) as demonstrated in Figure 1. Therefore, we used a similar model to describe tumor uptake of 18F−.

A 3-compartment model was used to describe kinetic distribution of 18F− ions to tumor and bone. K1 is transfer rate of 18F− from compartment 1 (plasma) to compartment 2 (extracellular fluid space) in units of mL/min/g, k2 is transfer rate from 2 to 1 in units of 1/min, k3 is transfer rate from 2 to 3 (hydroxyapatite lattice) in units of 1/min, and k4 is transfer rate from 3 to 2 in units of 1/min.
The mean concentrations of 18F− within a 20-min interval between 40 and 60 min after 18F-NaF injection were normalized to the total injected dose (%ID/cc) for the tumor, muscle, and bone regions of the mice. This time window was chosen on the basis of the results described below. Similarly, the %ID/cc for the rat paws was measured for the entire scan (30 min). A 2-tailed Student t test was used to compare %ID/cc between tumor and muscle in rats and between tumor and bone in mice; the statistical significance threshold was considered to be at a P value of 0.05.
RESULTS
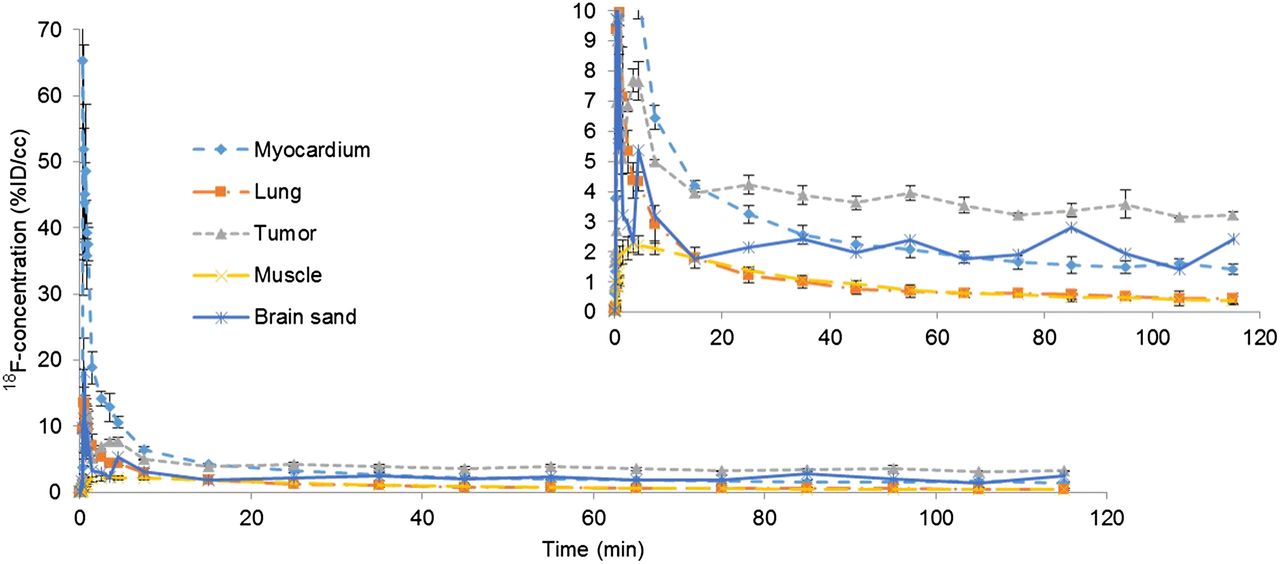
Initial perfusion of 18F− was observed in all tissues, including tumor and muscle, within the first minute after injection of 18F-NaF. The 18F− ions were quickly excreted by the kidneys, and by about 40 min, residual ions were concentrated in the bone and tumor with little or no signal observed in the muscle, as shown in Figure 2. The time–activity curves were fairly flat from 40 to 120 min, indicating a state of equilibrium, as demonstrated in Figure 3. Washout of the radiotracer from bone and tumor was fairly slow as indicated by a negligible k4 (Table 1). Therefore, we measured the 18F− uptake constant as K18F = K1k3/(k2 + k3).
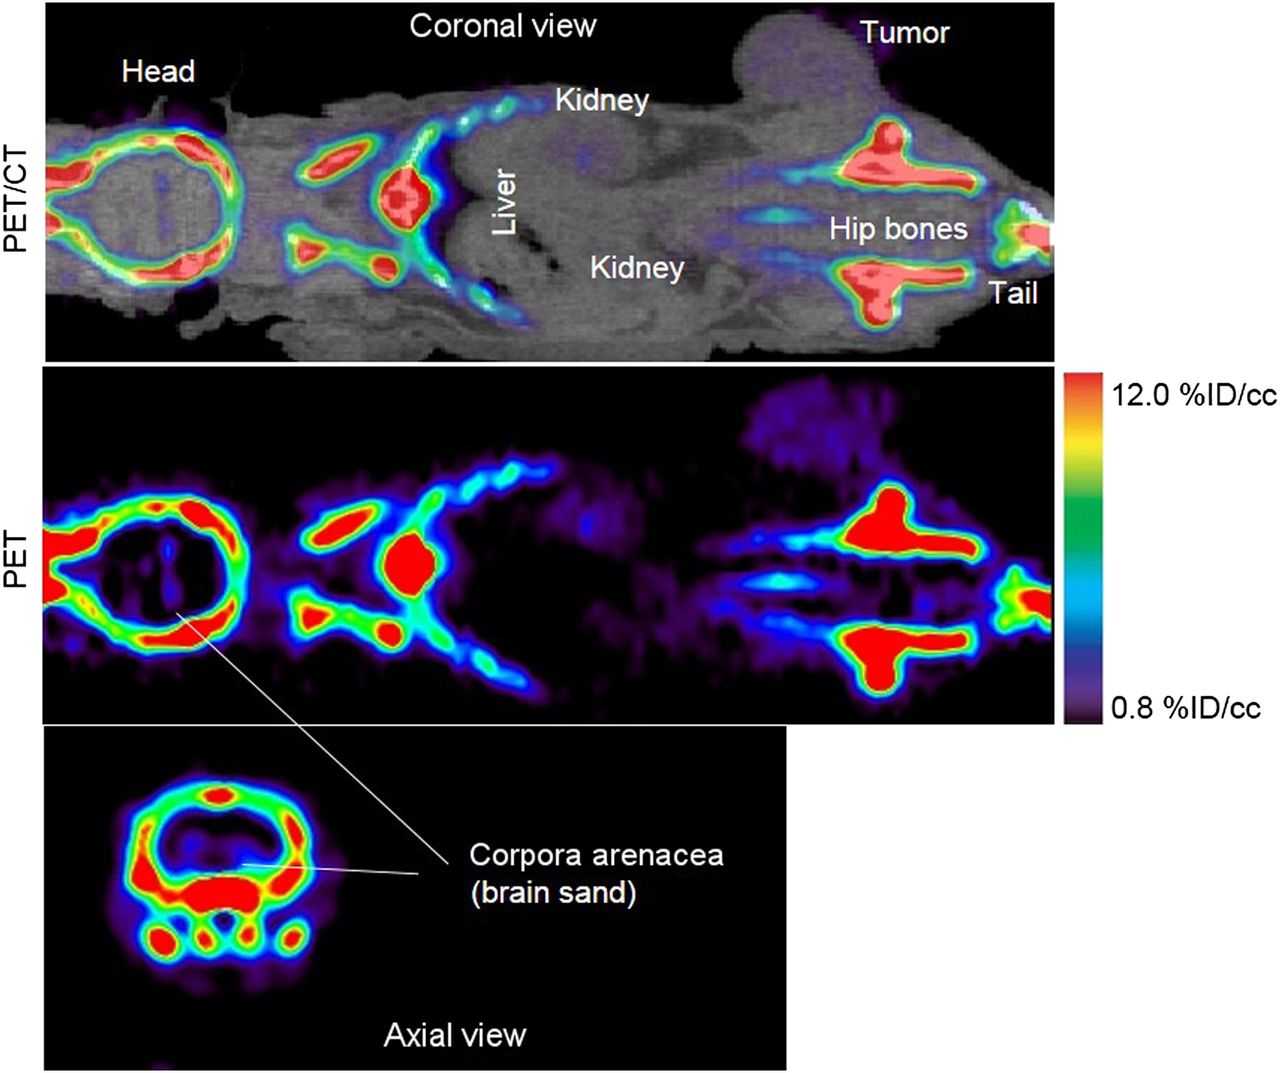
A 60- to 80-min summed PET/CT and PET image of 18F− uptake in mouse bearing MDA-MB-231 tumor and imaged for 120 min. With windowing level set between 0.8 and 12 %ID/cc, bone image is saturated but tumor and brain sand are visible with high contrast-to-background soft-tissue ratio

Time–activity curves of different regions in mouse injected with 18F-NaF displayed in Figure 2. %ID/cc is 18F− concentration within each ROI normalized to total injected dose. Insert is zoomed view of time–activity curves.
Kinetic Parameters of 18F− Uptake in Mice Bearing MDA-MB-231 Tumors (Tumors Contain Hydroxyapatite Similar to What Is Found in Normal Bone)
The concentration of 18F− in the tumor between 60 and 80 min was about 3.5 times higher than that of muscle (n = 7, P < 0.05), where the %ID/cc within the tumor ROI was 2.9 ± 0.8 (mean ± SD) and those of muscle and bone were 0.8 ± 0.2 and 31 ± 4, respectively.
Positive staining for calcium and calcium phosphate was observed in both tumor and bone, as shown in Figure 4. The positive von Kossa staining suggests the presence of type II calcifications specifically (8). A Raman shift of about 960 cm−1 was observed for the MDA-MB-231 slides as shown in Figure 4, where the green color over the tumor section in the 100 × 60 μm2 Raman image indicates that a shift near 960 cm−1 was found within that region. Thus, we confirmed the presence of carbonated calcium hydroxyapatite, type II microcalcifications, in the MDA-MB-231 microenvironment. No positive staining using alizarin red S or von Kossa was observed for the muscle, nor did we observe a hydroxyapatite Raman shift in these tissues.

Staining of MDA-MB-231 breast cancer samples and normal bone with von Kossa (red/brown) and alizarin red S (red). Positive von Kossa staining indicate presence of calcium carbonates, suggesting presence of type II calcification specifically. A 100 × 60 μm2 region of same tumor section scanned with Raman microscope reveals locations within that region where 960 cm−1 shift was found (green color in Raman image and Raman spectra) and where there was no shift near 960 cm−1 (black color). Shift at ∼960 cm−1 indicates presence of hydroxyapatite. a.u. = arbitrary units.
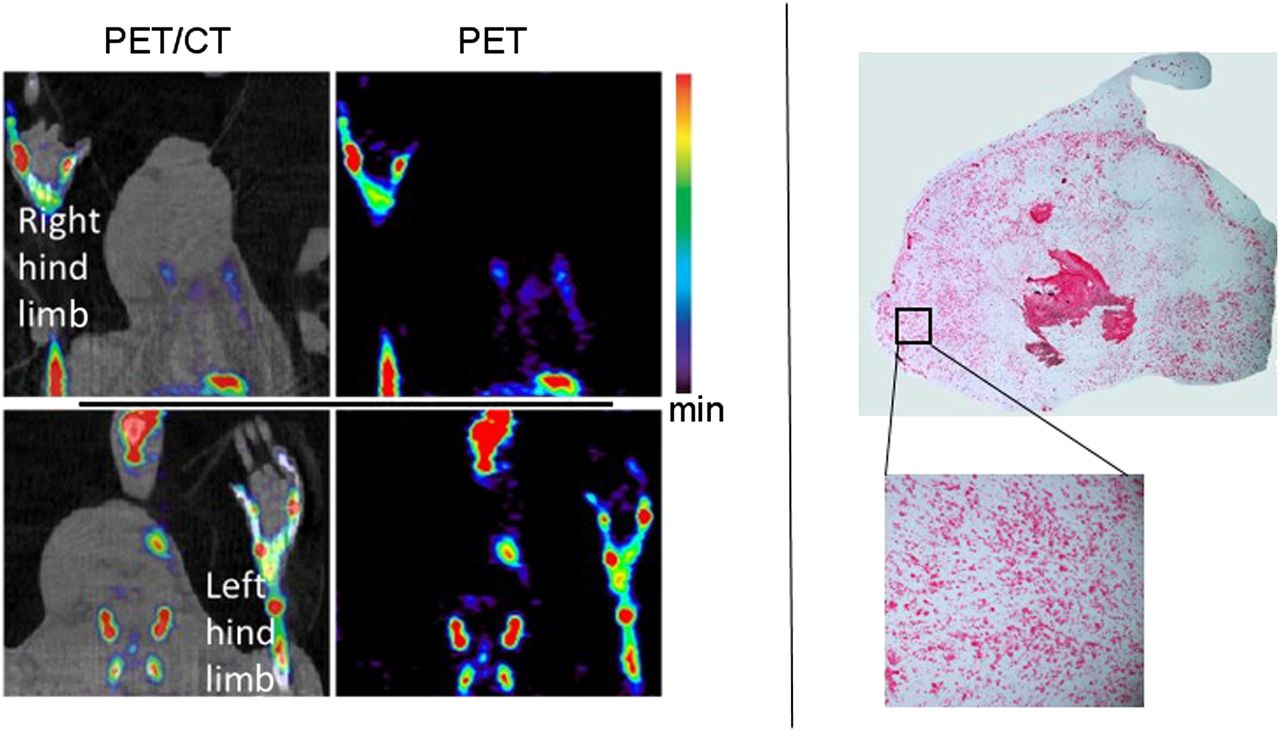
In some cases, we observed a localized region that had a high concentration of 18F− (∼9 times higher than muscle, %ID/cc > 8.5, n = 3), as shown in Figure 5. Interestingly, these mice were also the only mice with tumors that had started to ulcerate. In addition, no solid calcium deposits were observed in the CT scans. These mice were excluded from the statistical analysis since their %ID/cc values were more than twice the SD from the mean (physiologically, the skin surrounding the tumor was red, indicating the initial stages of ulceration). Autoradiography correlated well with the von Kossa stain results, as shown in Figure 5.
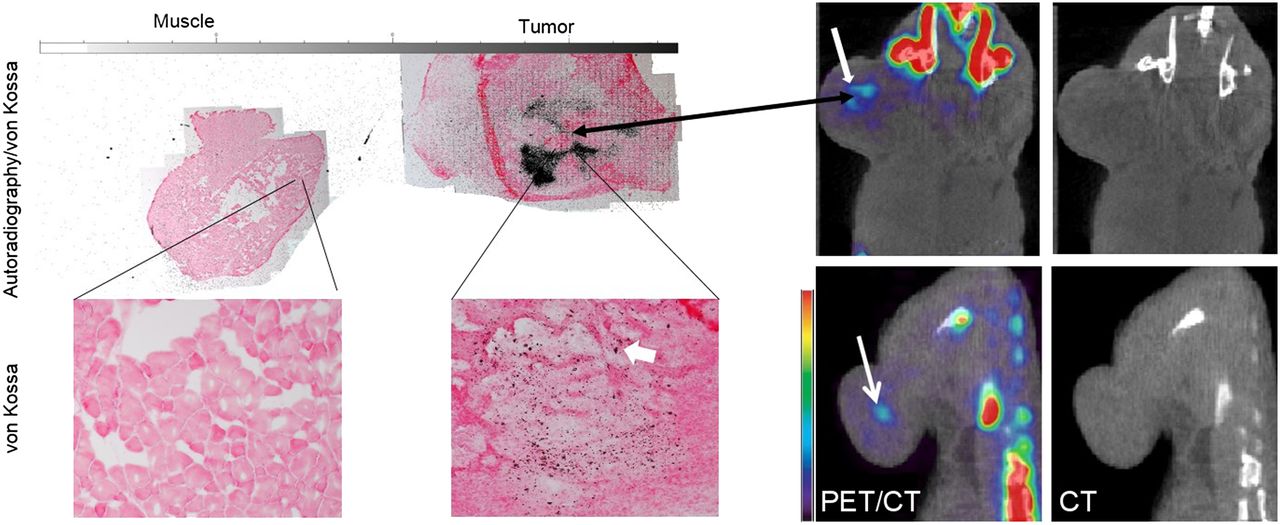
Coronal view of PET/CT and CT-only images of 2 mice injected with 18F-NaF (right) and corresponding autoradiography/von Kossa staining of tumor section and normal muscle of one of the mice (left). Thick white arrow in stained image points to red/brown spot representing positive von Kossa staining. Localized region, indicated by white arrows in PET/CT images, with high 18F− concentration (about 9 times higher than muscle and 3 times lower than bone) were observed in tumors in PET images, indicating dense hydroxyapatite. These regions were not observed in CT images. Autoradiography correlated well with PET and staining results.
We did not observe any 18F− uptake, or positive staining for alizarin red S or von Kossa, in the inflamed soft tissue of the rat paws, as shown in Figure 6; for comparison, %ID/cc of noninflamed soft tissue and paw bone were 0.9 ± 0.4 and 29 ± 3, respectively. As expected, no Raman shift at about 960 cm−1 was detected in the inflamed tissue, indicating the lack of hydroxyapatite in it (data not shown because the Raman images appear as just black rectangles).

(Left) Rat model of acute inflammation (in right footpad) imaged with 18F-NaF PET at maximal inflammation. Uptake of 18F− was limited to bone, with no accumulation in inflammatory soft tissue because of lack of hydroxyapatite. (Right) Section of inflamed tissue stained with von Kossa. No positive staining (or red/brown spots) was observed within stained tissue, indicating no presence of calcium phosphates or type II microcalcification. Lower and upper limits on scale bar are 0.8 and 12 %ID/cc.
Accumulation of 18F− was also observed in the corpora arenacea (brain sand), known to contain hydroxyapatite in humans and animals (19–21), as shown in Figure 2.
DISCUSSION
This study presents the first—to our knowledge—proposed use of 18F-NaF PET imaging to specifically detect tumors on the basis of their hydroxyapatite abundance. The 18F− concentration was approximately 10 times higher in bone than in tumors, as is expected because of the high density of hydroxyapatite in the bone and the large bone surface area. This higher concentration of 18F− in bone than in tumors was also indicated by K18F (Table 1). Therefore, to visually identify the tumor in the PET images, the windowing level was adjusted to a maximum of 12 %ID/cc, as shown in Figure 2, causing the bone signal to appear saturated. For bone structure identification, the high end of the scale bar would be set to at least 45% so that the tumor is not visible. In addition, the minimum windowing level was set to 0.8 %ID/cc to mask normal tissue perfusion (e.g., muscle). All analyses of PET images in this work used these same windowing limits.
Of the limited number of studies performed on hydroxyapatite and breast cancer, we are not aware of any that included negative control tumor models. Because breast lesions may be inflammatory lesions, we used an inflammatory rodent model to study the ability of 18F− PET images to distinguish between inflammation and malignancy. No accumulation of 18F− occurred in the rat inflammatory tissue because of lack of hydroxyapatite (Fig. 6). Therefore, this technique may indeed represent a novel and potentially reliable noninvasive in vivo method for distinguishing between malignant and inflammatory lesions with high specificity or between lesions that contain hydroxyapatite and those that do not. No other imaging modalities and techniques have been shown to have this capability. In addition, this technique can be used to measure hydroxyapatite abundance and the relationship between tumor progression and hydroxyapatite in preclinical settings.
The lack of accumulation of 18F− in the normal soft tissue, taken with the accumulation of 18F− in the brain sand and the tumor, supports the specificity of 18F− in binding to hydroxyapatite when present in soft tissue. This binding occurs through mechanisms similar to those of bone uptake of 18F−, with a high soft-tissue contrast-to-background ratio because the tracer does not accumulate in soft tissue not containing hydroxyapatite.
Calcium oxalate is implicated in the composition of most kidney stones (22–25). Prolonged exposure to high concentrations of NaF (60 mM) has been shown to be able to dissolve calcium oxalate in vitro, but this concentration would be considered toxic in vivo (26). Since radiotracer concentrations, including 18F-NaF, are on the order of submicromolar or smaller (27), it is highly unlikely that 18F-NaF can break the calcium oxalate bond in benign breast lesions. Therefore, this technique can be used not only to detect single and multicentric tumors with high contrast-to-background ratio but also to differentiate between type I and type II microcalcifications within the tumor’s microenvironment.
This imaging technique can rapidly be translated to clinical trials since 18F-NaF, or 18F−, is already Food and Drug Administration–approved. Although the approach is not appropriate for screening, it could be deployed to support mammograms when suggestive lesions or multicentric lesions are detected and biopsy is not feasible. The total-body adsorbed dose is about 0.024 mSv/MBq (0.989 mrem/mCi), or 4.44 mSv for a typical 185-MBq (5-mCi) dose of 18F-NaF injection, which is well within the radiation dose tolerance for nonradiation workers (28). Additionally, because microcalcifications were detected with 18F-NaF PET imaging when no solid calcium deposits were observed on the CT scan, this technique could be useful in early breast cancer diagnosis before solid calcium deposits are visible on mammograms. This ability would be especially important in cases of chronic inflammation, ductal carcinoma in situ, or lobular carcinoma in situ, which could progress to malignancy over time (29–31).
Previous studies on breast cancer have used 18F− and sometimes a cocktail of 18F− and 18F-FDG (32,33). Those studies, however, focused on bone metastases of breast cancer, and the cancer was at an advanced stage and had already spread and metastasized to different locations of the skeleton. Our work suggests the use of 18F− imaging within the breast and at a very early stage for primary detection rather than metastasis detection.
CONCLUSION
The results from this study provide the first evidence, to our knowledge, that PET imaging of breast cancer with 18F− via specific targeting of hydroxyapatite within the tumor microenvironment may be able to sensitively and noninvasively identify intratumoral microcalcifications with high specificity and contrast-to-background ratio, as this technique targets type II microcalcifications in vivo. Because of radiation and cost, this technique could not be used for initial screening for breast cancer. However, it can be used for identifying multicentric tumors, as well as for discriminating between malignancies and benign factors (e.g., inflammation, cysts, and fat necrosis). Additionally, this technique can be used for the early detection of breast cancer cells progressing from chronic inflammation, ductal carcinoma in situ, or lobular carcinoma in situ, avoiding repeated biopsies.
DISCLOSURE
The costs of publication of this article were defrayed in part by the payment of page charges. Therefore, and solely to indicate this fact, this article is hereby marked “advertisement” in accordance with 18 USC section 1734. The National Institutes of Health provided funding via NCI R01CA138599, NCI P30CA68485, and NCI P50CA098131, and the Kleberg Foundation provided generous support of the Imaging Program. No other potential conflict of interest relevant to this article was reported.
Acknowledgments
We thank Dr. Zou Yue for animal support.
Footnotes
Guest editor: Johannes Czernin, UCLA School of Medicine
Published online May 15, 2014.
- © 2014 by the Society of Nuclear Medicine and Molecular Imaging, Inc.
REFERENCES
- Received for publication February 20, 2014.
- Accepted for publication April 2, 2014.


