


Abstract
Epidermal growth factor receptor (EGFR) is overexpressed in many carcinomas and remains a prime target for diagnostic and therapeutic applications. There is a need to develop noninvasive methods to identify the subset of patients that is most likely to benefit from EGFR-targeted treatment. Noninvasive imaging of EGFR messenger RNA (mRNA) expression may be a useful approach. The aim of this study was to develop a method for preparation of single-photon-emitting probes, 99mTc-labeled EGFR mRNA antisense peptide nucleic acid (PNA) (99mTc-EGFR-PNA), and nontargeting control (99mTc-CTL-PNA) and to evaluate their feasibility for imaging EGFR mRNA overexpression in malignant tumors in vivo. Methods: On the 5′ terminus of synthesized single-stranded 17-mer antisense EGFR mRNA antisense PNA and mismatched PNA, a 4-amino-acid (Gly-(D)-Ala-Gly-Gly) linker forming an N4 structure was used for coupling 99mTc. Probes were labeled with 99mTc by ligand exchange. The radiochemical purity of these 99mTc-labeled probes was determined by reversed-phase high-performance liquid chromatography. Cellular uptake, retention, binding specificity, and stability of the probes were studied either in vitro or in vivo. Biodistribution and radionuclide imaging were performed in BALB/c nude mice bearing SKOV3 (EGFR-positive) or MDA-MB-435S (EGFR-negative) carcinoma xenografts, respectively. Results: The average labeling efficiencies of 99mTc-EGFR-PNA and 99mTc-CTL-PNA were 98.80% ± 1.14% and 98.63% ± 1.36% (mean ± SD, n = 6), respectively, within 6 h at room temperature, and the radiochemical purity of the probes was higher than 95%. 99mTc-EGFR-PNA was highly stable in normal saline and fresh human serum at 37°C in vitro and in urine and plasma samples of nude mice after 2–3 h of injection. Cellular uptake and retention ratios of 99mTc-EGFR-PNA in SKOV3 cells were higher than those of 99mTc-CTL-PNA and the EGFR-negative control. Meanwhile, EGFR mRNA binding 99mTc-EGFR-PNA was blocked with an excess of unlabeled EGFR-PNA in SKOV3 cell lines. The biodistribution study demonstrated accumulation of 99mTc-EGFR-PNA primarily in the SKOV3 xenografts and in EGFR-expressing organs. Radionuclide imaging demonstrated clear localization of 99mTc-EGFR-PNA in the SKOV3 xenografts shortly after injection but not in 99mTc-CTL-PNA and the EGFR-negative control. Conclusion: 99mTc-EGFR-PNA has the potential for imaging EGFR mRNA overexpression in tumors.
Epidermal growth factor receptor (EGFR or ErbB-1) is often overexpressed in various human cancers including lung, breast, glioma laryngeal, colorectal, ovarian, head and neck, and prostate (1–5). Activating mutations or overexpression of the EGFR or its ligand can cause aberrant signaling. Moreover, the EGFR signaling pathway has been known to be associated with tumor progression, apoptosis, angiogenesis, survival, motility, and metastasis and resistance to different treatments (6–9). Therefore, EGFR has become an attractive target for both cancer diagnosis and various treatment strategies. Tyrosine kinase inhibitors (TKIs), especially derivatives of quinazoline, have been developed as powerful EGFR-targeted antitumor drugs; gefitinib (Iressa, ZD1839; AstraZeneca) and erlotinib (Tarceva, OSI-774; Genentech) are the two most extensively evaluated TKIs (10). These agents can specifically bind to the intraendothelial tyrosine kinase domain of EGFR and consequently block the signaling pathway (11). However, the clinical data on TKIs indicate their significant variability, and not all cancer patients are suitable for the same targeted treatment. Therefore, the patients should be selected before this treatment (12). Several studies have proven that the status of the EGFR can be both an indicator of suitability for treatment with and a predictor of the likelihood of response to EGFR-targeted therapy. High EGFR expression is also a prognostic and predictive biomarker in some cancers (13,14). However, analysis of the expression of EGFR and the presence of mutations requires a tumor biopsy, which is not always clinically available. In addition to mutations, increased EGFR gene copy number has emerged as another relevant method for the selection of suitable patients (15,16). Thus, there is a need to develop noninvasive methods to identify the subset of patients that is most likely to benefit from EGFR-targeted treatment.
An attractive noninvasive method for assaying EGFR expression in tumors is molecular imaging. Molecular imaging differs greatly from traditional anatomic imaging. It can visually represent, characterize, and quantify biologic processes at the cellular or subcellular level. Several modalities using PET, SPECT, and MR imaging have been introduced to noninvasively evaluate EGFR. Some noninvasive molecular agents, such as 11C-erlotinib, 11C-labeled 4-N-(3-bromoanilino)-6, 7-dimethoxyquinazoline, 177Lu-nimotuzumab, 18F-labeled Affibody protein, or anti-EGFR monoclonal antibodies using contrast-enhanced MR imaging, have been developed as molecular imaging biomarkers for evaluating tumor EGFR status (17–21). Although these EGFR-specific imaging probes have been investigated, they all have been directed either at an external ligand binding domain using antibodies and Affibody molecules or at the internal adenosine triphosphate binding domain with small organic reversible and irreversible inhibitors (22).
Direct imaging of messenger RNA (mRNA) of overexpressed oncogenes may provide information on cellular gene expression patterns and reveal molecular changes in disease states at relatively early stages (23). The successful use of antisense peptide nucleic acid (PNA) radiolabeled with 99mTc has been reported for targeting and imaging tumor-associated mRNA (24–27). PNA, invented by Nielsen et al. (28), is the third generation of chemically modified oligonucleotides in which the charged phosphate-ribose backbone has been eliminated and replaced by uncharged repeating N-(2-aminoethyl)-glycine units. PNA has been reported to resist nuclease and protease degradation (29) and can enhance acid specificity and inhibit mRNA expression (30,31). Furthermore, these modifications can increase the flexibility and binding affinities of PNA for its complementary single-stranded PNA, exceeding that of comparable DNAs (28). Recently, Metaferia et al. reported PNA probes for the detection of the human epidermal growth factor receptor 2 oncogene using fluorescence imaging (32). This study was performed with the intention of creating a single-photon-emitting 99mTc-labeled EGFR mRNA antisense PNA (99mTc-EGFR-PNA) and evaluating the feasibility for the visualization of EGFR mRNA expressed in tumors.
MATERIALS AND METHODS
PNA Probe Design and Synthesis
The design of antisense PNA probe possesses GC (guanine-cytosine) content between 40% and 65% and melting temperatures ranging between 65°C and 85°C for the DNA/PNA duplex at 1 μM concentration. The melting temperature of PNA was calculated as described (33,34): melting temperature (DNA/PNA) = C0 + C1 × melting temperature (DNA) × C2 × number of pyrimidines + C3 × length, where C0 = 20.79, C1 = 0.83, C2 = −26.13, and C3 = 0.44. The specificity of the design PNA sequence to the EGFR transcript was checked by aligning them against the whole transcriptome and the reversed transcriptome, allowing no gaps or mismatches using BLAST (35). Antisense PNA (5′-AATGAGGACATAACCAG-3′), specifically targeting the gene sequence of EGFR mRNA from 503 to 519 (Gene Bank no. 201283.1) and mismatch PNA (5′-AGTAGAGATGTGACGAT-3′), which targets none of the human genes, were synthesized and purified. At the 5′ terminus of the EGFR mRNA antisense or mismatch PNA, a peptide with 4 amino acids (Gly-(D)-Ala-Gly-Gly), which forms a N4 structure, was used as a linker for the coupling of 99mTc, and one 4-aminobutyric acid (Aba) was introduced as a spacer to prevent steric hindrance. The 99mTc-EGFR-PNA probe and its mismatched control counterpart 99mTc-labeled EGFR mRNA mismatch PNA (99mTc-CTL-PNA) were prepared by the ligand exchange method.
Radiolabeling with 99mTc
Briefly, 10 μL of 0.15 M NaOH were added to 20 μL (10 μg) of antisense or mismatch PNA (0.5 mg/mL), and the solution was adjusted to pH 11. Subsequently, 200 μL (148–185 MBq [4–5 mCi]) of fresh 99mTc-pertechnetate were added immediately after 20 μL of SnCl2·2H2O in 0.01 M HCl (1 mg/mL) were added. The mixture was stirred in a vortex mixer briefly and incubated for 60 min at room temperature. The reaction mixture was analyzed to determine free 99mTc and chelated 99mTc by reversed-phase high-pressure liquid chromatography (RP-HPLC) on a microbond C18 column (model 305, 4.6 × 250 mm; Alltech) coupled to a ultraviolet detector, an NaI (Tl) radioactivity monitor, and a rate meter. The column was eluted with a gradient of 5%–70% buffer A (A, 0.1% trifluoroacetic acid–CH3CN) and 95%–30% buffer B (B, 0.1% trifluoroacetic acid–H2O) in 30 min and a flow rate of 1 mL/min at 25°C monitoring at 260 nm.
Cell Cultures
The SKOV3 cell line derived from human ovarian carcinoma with high expression of EGFR and the MDA-MB-435S cell line derived from human breast cancer with low EGFR expression were purchased from the Cell Bank of Chinese Academy of Sciences. The cell culture method is described in the supplemental materials (available at http://jnm.snmjournals.org). Adherent cells were grown in RPMI 1640 medium (Gibco, Invitrogen) containing 10% fetal bovine serum (FBS). Cells were cultured at 37°C in a humidified atmosphere with 5% CO2. The cells were harvested using 0.25% trypsin and 0.02% ethylenediaminetetraacetic acid (EDTA) (Invitrogen). Cell growth was monitored under an inverted microscope with phase contrast.
In Vitro and In Vivo Stability Analysis
The stability of 99mTc-EGFR-PNA or 99mTc-CTL-PNA in vitro and in vivo was evaluated by RP-HPLC analysis (supplemental materials). To evaluate the labeling stability in vitro, 99mTc-EGFR-PNA was incubated in normal saline or fresh human serum at 37°C for 1, 2, 4, 6, 12, and 24 h, respectively. At each time point, the radiochemical purities of the probe samples were analyzed by RP-HPLC using the experimental conditions described above.
The in vivo radiochemical stability was evaluated by RP-HPLC analysis of the urine and plasma from 2 groups of 5 SKOV3 tumor–bearing mice at 30 min and 2–3 h after injection with 99mTc-EGFR-PNA or 99mTc-CTL-PNA. The urine and plasma samples were collected in Eppendorf vials and then centrifuged at 4,000 rpm for 10 min before analysis by RP-HPLC for the amount of radiolabeled probes as described above.
Cellular Uptake, Retention Kinetics, Internalization, and Blocking Studies
Cellular uptake, retention, internalization, and blocking studies of 99mTc-EGFR-PNA and 99mTc-CTL-PNA were performed (the tasks are described in more detail in the supplemental materials). Cellular uptake studies of 99mTc-EGFR-PNA and 99mTc-CTL-PNA were accomplished with SKOV3 and MDA-MB-435S cells plated at a density of 6 × 10⁵ cells per well. Sextuplicate cell wells were used for each data point. The cells were washed twice with phosphate-buffered saline (PBS), and 2 mL of fresh RPMI 1640 medium containing 10% FBS were added, followed by 37 kBq of 99mTc-EGFR-PNA or 99mTc-CTL-PNA directly into each well. Cells were incubated with the probes at 37°C and harvested using the same trypsin-EDTA solution at 1, 2, 4, 6, 12, and 24 h as described above. Before cell lysis, the medium containing 10% FBS was removed, and the wells were washed with PBS twice. Counts containing radioactive medium and PBS were designated as Cout. After being lysed with 0.5 mL of trypsin-EDTA, 0.5 mL of medium containing 10% FBS was added to each well, and then cells were washed twice with PBS. Radioactivity counts of the lysis solution and PBS were defined as Cin. The collected fractions were measured in an automated γ counter. The cellular uptake ratio was calculated using the formula Cin/(Cin + Cout).
To determine cellular retention, 99mTc-EGFR-PNA or 99mTc-CTL-PNA was added directly into 6-well plates containing 6 × 10⁵ SKOV3 or MDA-MB-435S cells and incubated at 37°C for 6 h. Subsequently, the medium was removed, and all wells were washed twice with PBS. After 2 mL of fresh RPMI 1640 medium containing 10% FBS were added into each well, the plates were incubated at 37°C for 1, 2, 4, 6, 12, or 24 h. Before cell lysis, the medium containing 10% FBS was removed, and the wells were washed with PBS twice. Counts containing radioactive medium and PBS were designated as Cout. After being lysed with 0.5 mL of trypsin-EDTA, 0.5 mL of medium containing 10% FBS was added to each well, and then cells were washed twice with PBS. Radioactivity counts of lysis solution and PBS were defined as Cin. The collected fractions were measured in an automated γ counter. The cellular retention ratio was calculated using the same formula for determining cellular uptake kinetics given above.
For internalization studies, radiopharmaceutical uptake was performed as described. Several additional cell dishes were used during the binding study to separate the membrane-bound fraction of the conjugate from internalized radioactivity. The wells were washed with PBS twice. Then the isolated cell pellet was washed with 0.2 M acetic acid/0.5 M NaCl, pH 2.5, to remove surface-bound radioactivity at each time point. Radioactivity that was removed from cells by an acidic buffer was considered membrane-bound, and the rest was considered internalized.
For blocking experiments, 2.5 μg (500 times) or 5 μg (1,000 times) of unlabeled PNA were added simultaneously with the 99mTc-EGFR-PNA. After incubation for 2 h, the EGFR mRNA expression of SKOV3 cells was measured by real-time quantitative reverse transcription polymerase chain reaction (qRT-PCR) to determine the block results. Meanwhile, the control blocking experiments of unlabeled CTL-PNA in MDA-MB-435S cells were performed as above.
Measuring Cellular EGFR mRNA Expression by qRT-PCR
The measuring method of cellular EGFR mRNA expression by qRT-PCR is described in more detail in the supplemental materials.
Total RNA was extracted from 1 × 10⁶ cell samples using a standard TRIzol (Invitrogen) RNA isolation method and quantified by measuring ultraviolet absorbance at 260 nm. Reverse transcription of RNA was performed according to the instructions of the Easy Script First-Strand cDNA Synthesis Super Mix kit (Trans Gen Biotech). Real-time PCR was performed on an ABI PRISM 7300 PCR System (Applied Bio Systems) using SYBR Green I GoTaq qPCR Master Mix (Promega). PCRs were performed in a total of 25 μL as follows: 1 cycle at 95°C for 5 min, followed by 40 cycles of 95°C for 15 s, 58°C for 20 s, and 72°C for 30 s. The primers used in this study included: EGFR forward: 5′-CAGTTGGCACTTTTGAAGAT-3′, reverse: 5′-TGAGGGCAATGAGGACATAAC-3′; glyceraldehyde-3-phosphate dehydrogenase (GAPDH) forward: 5′-TGAACGGGAAGCTCACTGG-3′, reverse: 5′-GCTTCACCACCTTCT-TGATGTC-3′. The EGFR mRNA expression from each sample was analyzed in duplicates and normalized against GAPDH. The results were expressed as relative gene expression using the 2-ΔΔCt method. The relative expression of EGFR mRNA in SKOV3 and MDA-MB-435S cells was obtained by the software SDS (version 1.3.2; Applied Bio Systems) attached with the PCR machine. The EGFR mRNA binding was blocked with an excess of unlabeled EGFR-PNA in SKOV3 and was also measured by qRT-PCR.
Animal Xenograft Model
SKOV3 and MDA-MB-435S xenograft models were prepared (supplemental materials). Female BALB/c nude mice (mean weight ± SD, 20 ± 5 g; age, 4–6 wk [Department of Animal Center, Peking University]) were used in this study. Mice were injected subcutaneously with 6 × 10⁶ SKOV3 or MDA-MB-435S cells (200 μL of RPMI 1640 medium without FBS) in the right anterior superior limbs. The tumors were allowed to grow for 2–3 wk and reached a diameter of 1.0–1.5 cm before the experiments were performed. The mice were maintained on a standard diet, bedding, and environment, with free access to food and drinking water. All animal experiments were approved by local Animal Welfare Committee in accordance with Chinese legislation and performed in accordance to their guidelines, and the institutional review board approved this study in mice with human tumor xenografts.
Biodistribution in EGFR-Expressing Tumor Model
Biodistribution studies of 99mTc-EGFR-PNA or 99mTc-CTL-PNA in BALB/c nude mice bearing SKOV3 or MDA-MB-435S xenografts were performed. The detailed procedures are described in the supplemental materials. For biodistribution studies, a 1,110-kBq dose of 99mTc-EGFR-PNA or 99mTc-CTL-PNA was injected through the tail vein into BALB/c nude mice bearing SKOV3 or MDA-MB-435S xenografts (n = 6/group), which were sacrificed at 1, 2, 4, or 6 h after injection. Tumor and normal tissues were excised and weighed, and radioactivity was measured using a γ-well counter (Capintec). The radioactivity uptake in the tumor and normal tissues was expressed as the percentage of the injected dose per gram of organ (%ID/g).
Molecular Imaging Procedure
The SKOV3 and MDA-MB-435S tumor xenografts were imaged by either 99mTc-EGFR-PNA or 99mTc-CTL-PNA using a SPECT planar scanner (e.camduet SPECT; Siemens). The detailed protocol is described in the supplemental materials. Ten BALB/c nude mice with SKOV3 tumor xenografts were randomly divided into 2 groups of 5 mice each; 37 MBq (100 μL) of either 99mTc-EGFR-PNA or 99mTc-CTL-PNA (pH 7.0) were injected into each mouse via the tail vein. Moreover, 5 BALB/c nude mice with MDA-MB-435S tumor xenografts were injected with 37 MBq (100 μL) of 99mTc-EGFR-PNA. At 1, 2, 4, 6, 8, and 10 h after injection, mice were anesthetized and placed supine near the center field of the view of the detector and imaged using the e.camduet SPECT equipped with a pinhole collimator. A static anterior image (300,000 counts) was taken with a zoom factor of 1.78 and digitally stored in a 128 × 128 matrix. The energy window setting was 140 keV, 15%. The ratio of radioactive counts in the tumor to that in the contralateral equivalent region (tumor to nontumor [T/NT]) was calculated by drawing regions of interest at each time point.
Statistical Analysis
All numeric data are expressed as the mean ± SD ( ± SD). A Student t test or t′ test was used to analyze the variables between different groups at the same time point. A nonparametric test with rank transformation was used if the data did not fit the normal distribution and homogeneity of variance criteria. P values of less than 0.05 were considered significant.
RESULTS
PNA Synthesis and Radiolabeling with 99mTc
Antisense and mismatched PNAs (99mTc-EGFR-PNA and 99mTc-CTL-PNA, respectively) were synthesized using Fmoc solid-phase peptide synthesis and purified by CP Biochen. The predicted melting temperature of the antisense PNA sequence to the EGFR mRNA is 81.76°C. Under the specified set of conditions established in this study, the average labeling efficiency of the 99mTc-labeled antisense or mismatched PNA probe was 98.80% ± 1.14% and 98.63% ± 1.36% (n = 6), respectively, within 6 h at room temperature after labeling, and the radiochemical purity of either probe was more than 95%. In the RP-HPLC analysis, the retention time of 99mTc-EGFR-PNA was observed at about 12.5 min, with a high and sharp peak, which was consistent with its single peak of absorbance at 260 nm, and 99mTc-CTL-PNA showed results similar to those of the antisense PNA (Fig. 1).
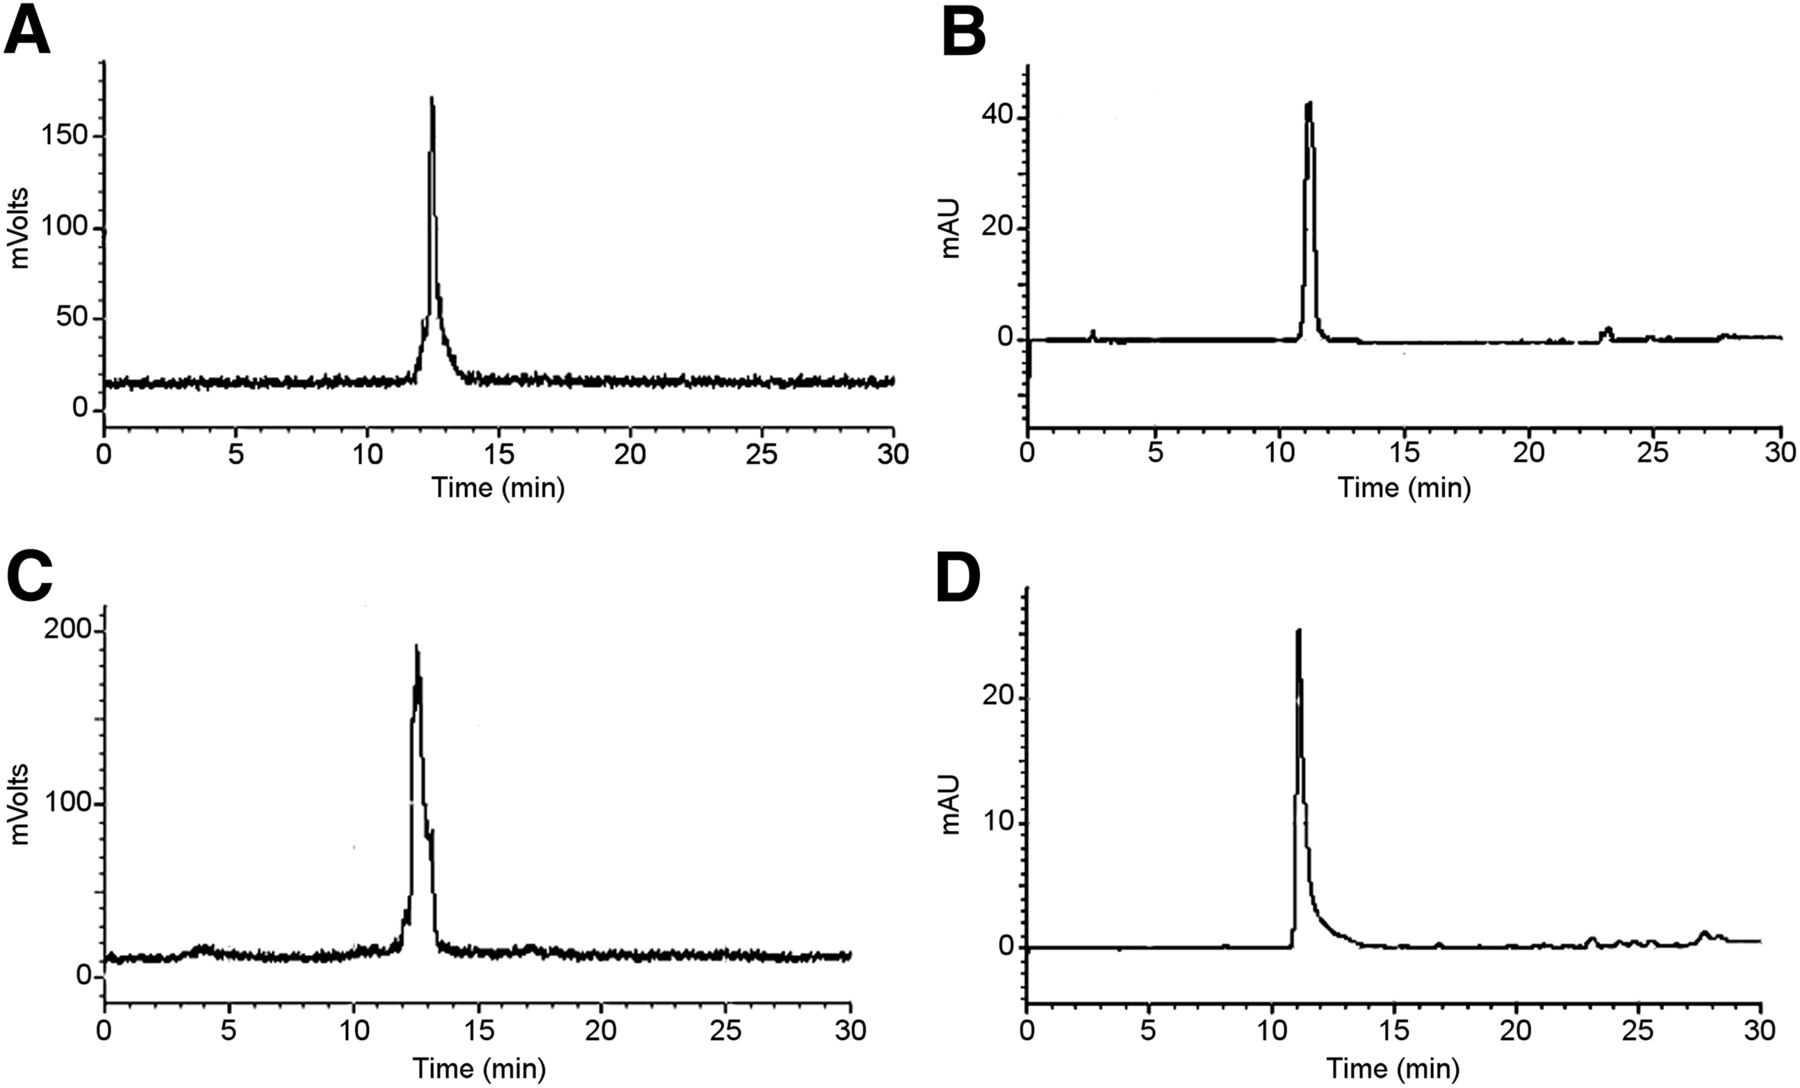
HPLC retention time of 99mTc-EGFR-PNA (A) and its single peak of absorbance at 260 nm (B). HPLC retention time of 99mTc-CTL-PNA (C) and its single peak of absorbance at 260 nm (D).
In Vitro and In Vivo Stability Analysis
Figure 2 showed the results of stability of 99mTc-EGFR-PNA or 99mTc-CTL-PNA incubated in normal saline or fresh human serum at 37°C for 1, 2, 4, 6, 12, and 24 h in vitro. RP-HPLC analysis indicated that the radiochemical purity of 99mTc-EGFR-PNA was 95.18% ± 0.06% and 95.16% ± 3.54%, respectively (n = 6), within 6 h at room temperature. Even after 24 h, the radiochemical purity of the probes was still as high as 85%, indicating that no significant degradation and off-labeling occurred in fresh human serum or normal saline at 37°C.
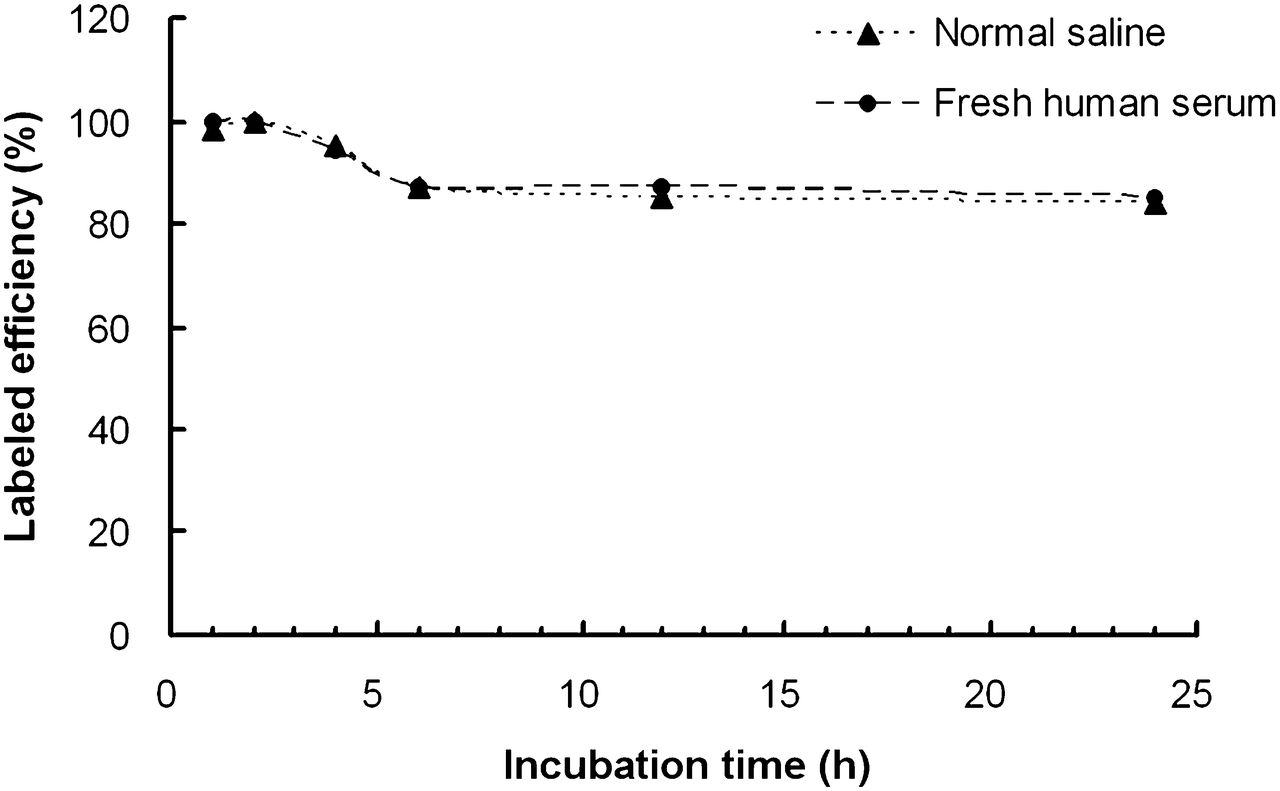
Radiochemical stability of 99mTc-EGFR-PNA in normal saline and in fresh human serum at 37°C.
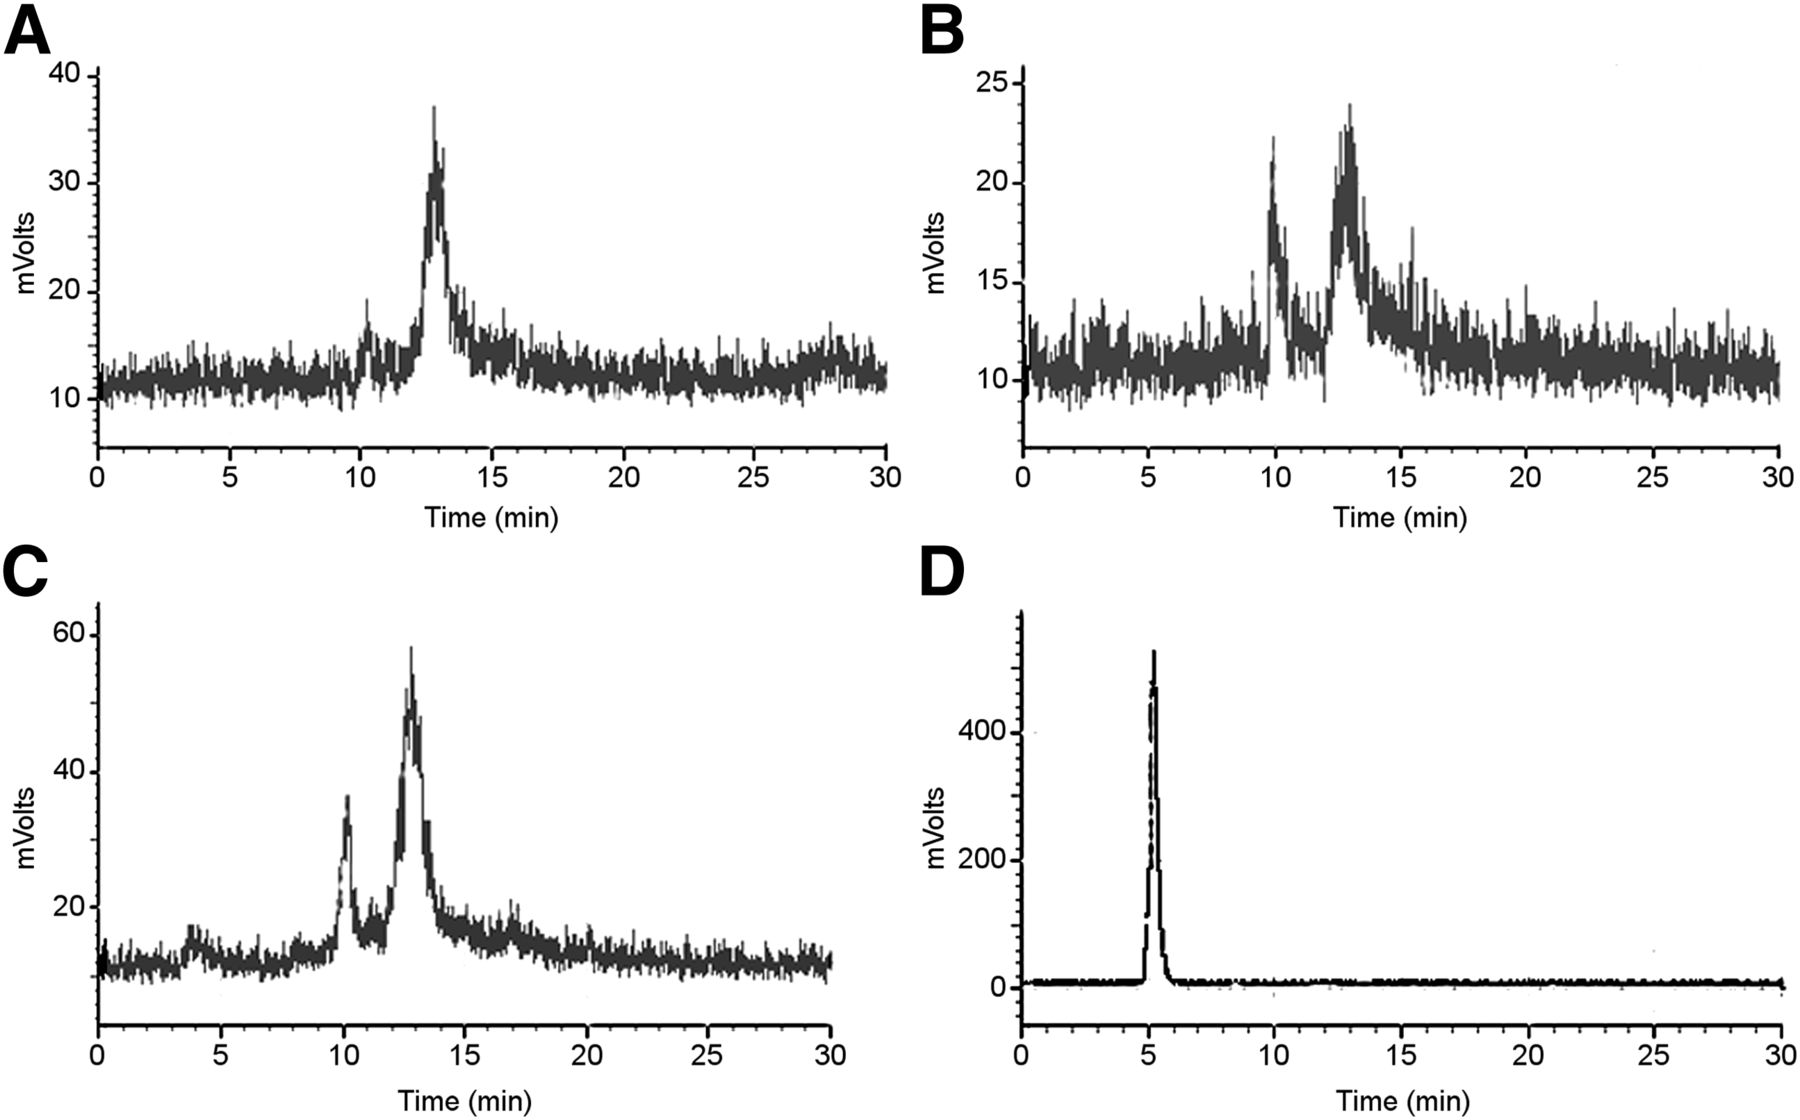
Figure 3 showed the results of stability of 99mTc-EGFR-PNA or 99mTc-CTL-PNA in urine and plasma samples of SKOV3 tumor–bearing mice in vivo. RP-HPLC analysis of the urine and plasma samples from nude mice administered 99mTc-EGFR-PNA at 30 min showed only an intact probe peak with a retention time of 12.5 min, and no peak corresponding to free 99mTc was seen. When either 99mTc-EGFR-PNA or 99mTc-CTL-PNA was injected into SKOV3 tumor–bearing mice, RP-HPLC analysis of their urine and plasma samples after 2–3 h revealed 2 peaks, one at 10 min (11% of radioactivity) and a probe peak at 12.5 min (89% of radioactivity). The peak detected at 10 min may be the degradation fragments of the PNA.

HPLC analysis of urine collected from nude mice after injection of 99mTc-EGFR-PNA for 30 min (A) and 2–3 h (B) or 99mTc-CTL-PNA for 2–3 h (C). HPLC retention time of fresh 99mTc-pertechnetate (D).
Analysis of Cellular Uptake, Internalization, and Retention Kinetics
As shown in Figure 4A, the cellular uptake of 99mTc-EGFR-PNA was significantly higher than that of 99mTc-CTL-PNA in SKOV3 cells (P = 0.019–0.005, n = 6) and 99mTc-EGFR-PNA in MDA-MB-435S cells at each time point from 4 to 24 h (P = 0.0306–0.0001, n = 6). After 1 h, the cellular uptake of 99mTc-EGFR-PNA increased faster than that of the 99mTc-CTL-PNA in SKOV3 cells. At 6 h, the cellular uptake of the 99mTc-EGFR-PNA probe in SKOV3 cells peaked at 5.84% ± 0.28% (n = 6), whereas that of the 99mTc-CTL-PNA probe in SKOV3 cells reached a maximum of only 2.11% ± 0.17% (n = 6). 99mTc-EGFR-PNA probe in MDA-MB-435S cells peaked at 4.71% ± 0.61% (n = 6), whereas, that of the 99mTc-CTL-PNA probe had only maximum uptake of only 2.10% ± 0.29% in MDA-MB-435S cells (n = 6).

Cellular uptake kinetics (A) and internalization (B) of 99mTc-EGFR-PNA or 99mTc-CTL-PNA in SKOV3 and MDA-MB-435S cells.
The cellular internalization results summarized in Figure 4B show that internalization of 99mTc-EGFR-PNA or 99mTc-CTL-PNA is a rapid process in both cell lines; more than 30% of the radioactivity was internalized 30 min after incubating 99mTc-EGFR-PNA with SKOV3 cells.
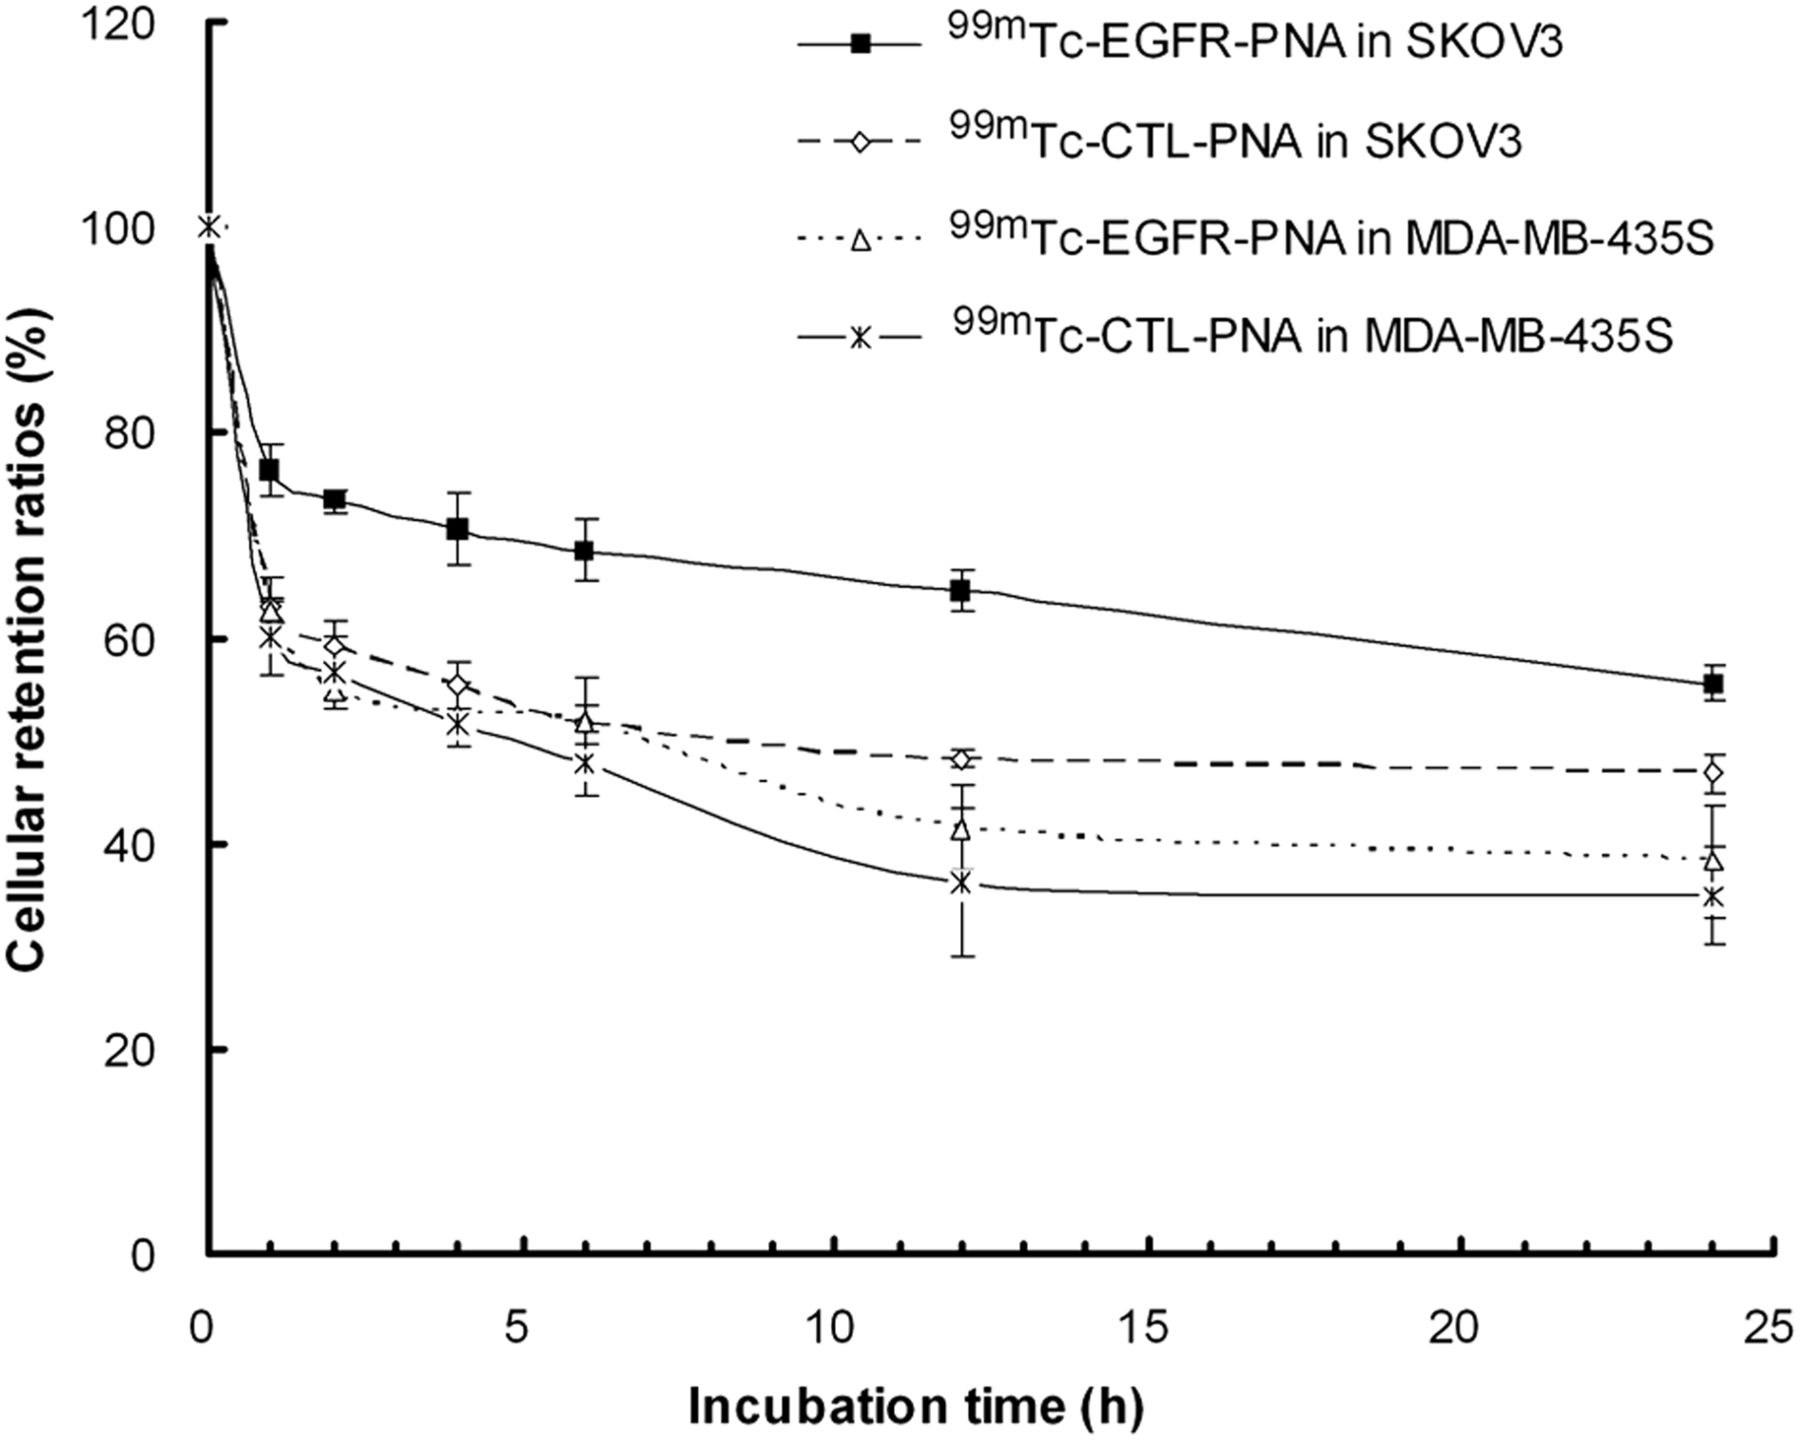
The cellular retention patterns of radioactivity after interrupted incubation with 99mTc-EGFR-PNA and 99mTc-CTL-PNA for SKOV3 or MDA-MB-435S cells were similar (Fig. 5). The results demonstrated good retention of 99mTc-EGFR-PNA in SKOV3 cells, with 68.48% ± 3.56% at 6 h after interrupted incubation, whereas retention of 99mTc-CTL-PNA in SKOV3 cells and 99mTc-EGFR-PNA or 99mTc-CTL-PNA in MDA-MB-435S cells were 51.61% ± 2.12%, 51.90% ± 3.23%, and 47.81% ± 3.02%, respectively, at 6 h (P = 0.0001–0.0051, n = 6). Significant differences in cellular retention between the SKOV3 and MDA-MB-435S cells were observed under the same conditions from 1 to 24 h (P = 0.0001–0.0122, n = 6).

Cellular retention kinetics of 99mTc-EGFR-PNA and 99mTc-CTL-PNA in SKOV3 and MDA-MB-435S cells.
Analysis of Cellular EGFR mRNA Expression by qRT-PCR and Blocking Studies
EGFR mRNA expression in SKOV3 human ovarian carcinoma cells was significantly higher than that in MDA-MB-435S cells as confirmed by qRT-PCR (P = 0.0001, n = 6). EGFR mRNA binding of 99mTc-EGFR-PNA was successfully blocked with an excess amount (500 or 1,000 times) of unlabeled EGFR-PNA in SKOV3 cells (P = 0.0000–0.0001, n = 6, Fig. 6). In addition, EGFR mRNA binding of 99mTc-EGFR-PNA was blocked more effectively when 1,000 times of unlabeled EGFR-PNA were added as compared with that of 500 times of unlabeled EGFR-PNA in SKOV3 cells, suggesting EGFR-specific binding.
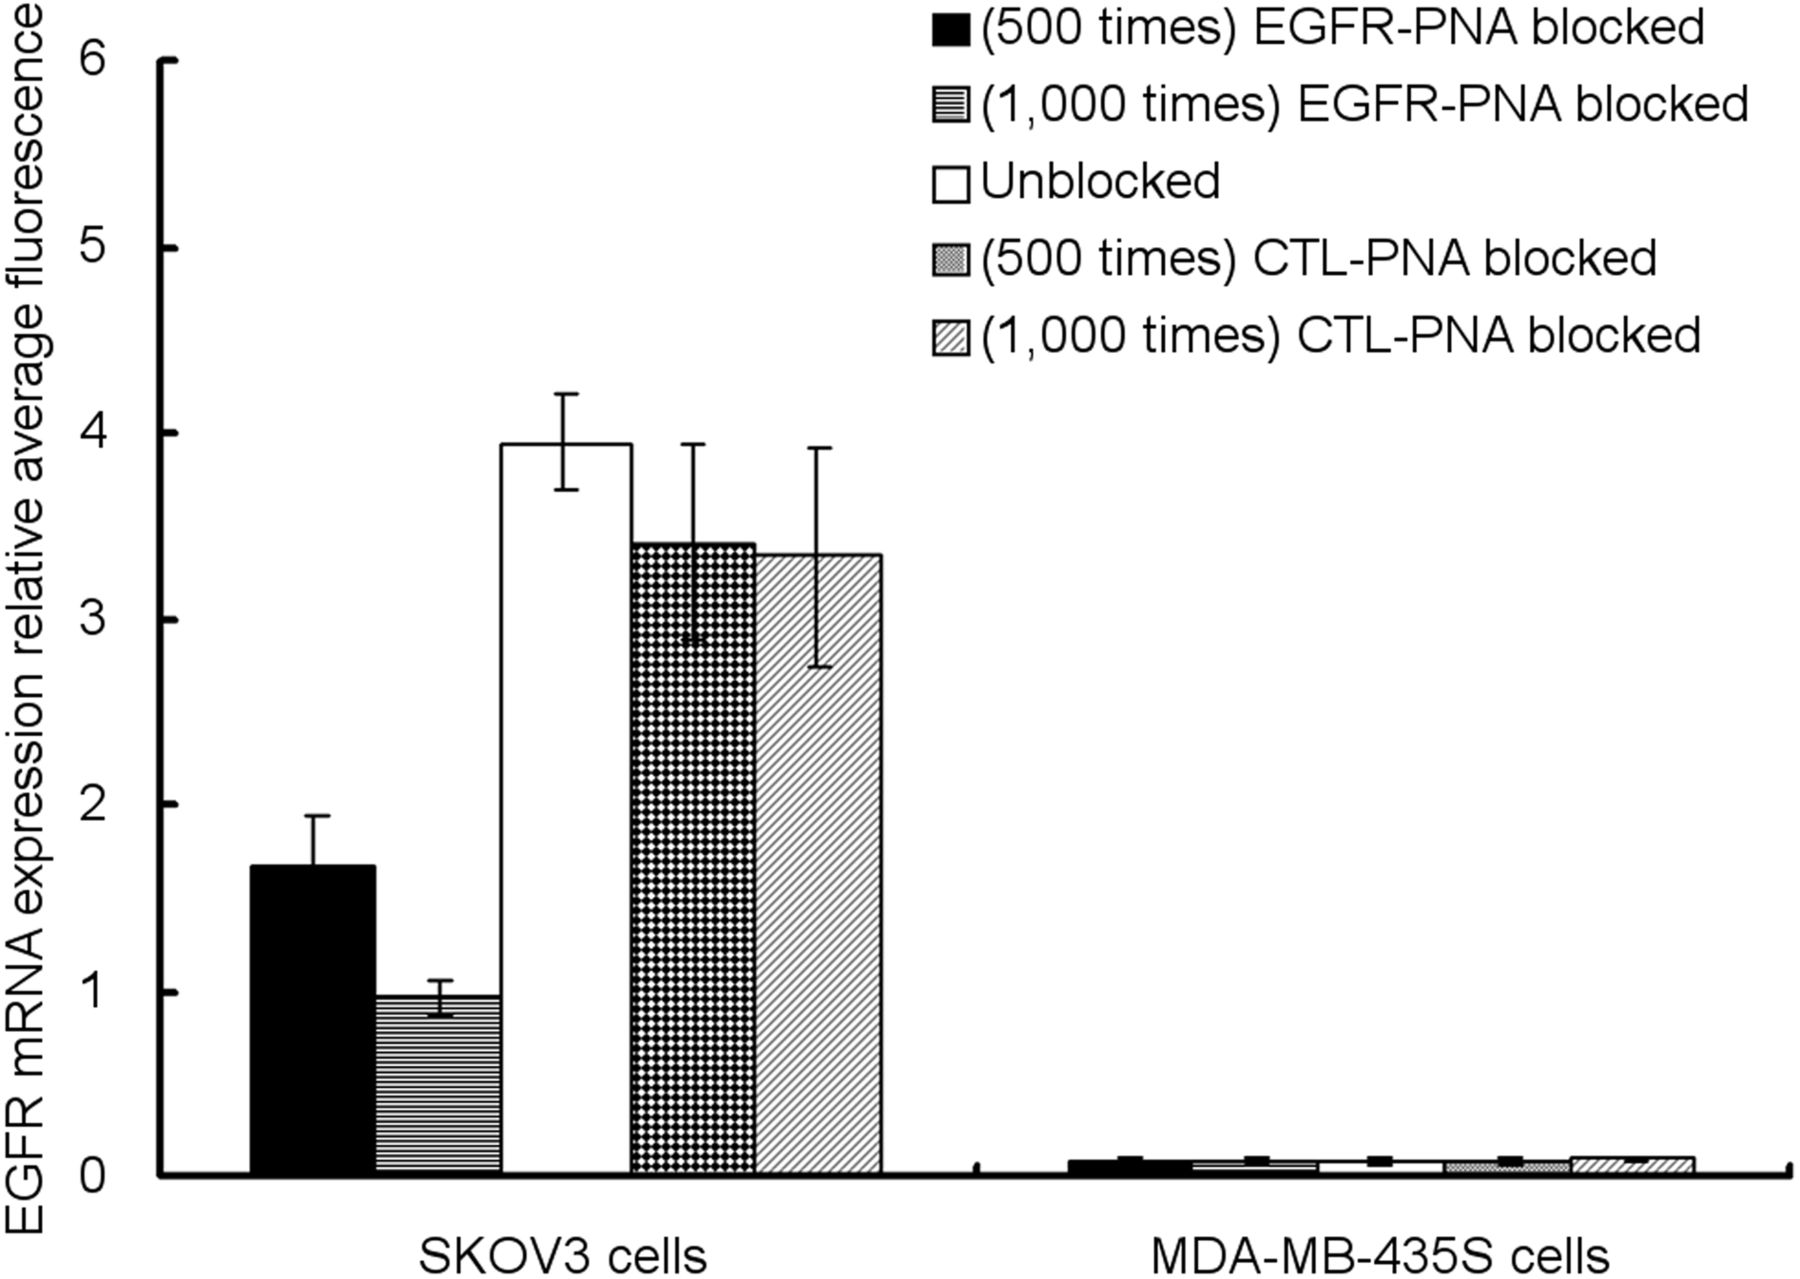
Specificity of 99mTc-EGFR-PNA binding EGFR mRNA to SKOV3 and MDA-MB-435S cells. Cell cultures were incubated with 99mTc-EGFR-PNA for 2 h. EGFR binding was blocked with excess amount of unlabeled EGFR-PNA. EGFR mRNA expression was determined by qRT-PCR. Data are presented as mean ± SD (n = 6).
Biodistribution Analysis
Biodistribution analyses of 99mTc-EGFR-PNA and 99mTc-CTL-PNA were performed in nude mice bearing SKOV3 or MDA-MB-435S xenografts at 1, 2, 4, and 6 h. Table 1 shows that the uptake of 99mTc-EGFR-PNA in SKOV3 xenografts increased from 1.55 ± 0.12 %ID/g at 1 h to 3.93 ± 0.74 %ID/g (mean ± SD) at 6 h after injection. Conversely, 99mTc-CTL-PNA displayed low SKOV3 tumor uptake (Table 2), and 99mTc-EGFR-PNA showed low MDA-MB-435S tumor uptake (Table 3).
Biodistribution of 99mTc-EGFR-PNA in SKOV3 Xenografts
Biodistribution of 99mTc-CTL-PNA in SKOV3 Xenografts
Biodistribution of 99mTc-EGFR-PNA in MDA-MB-435S Xenografts
In Vivo Imaging
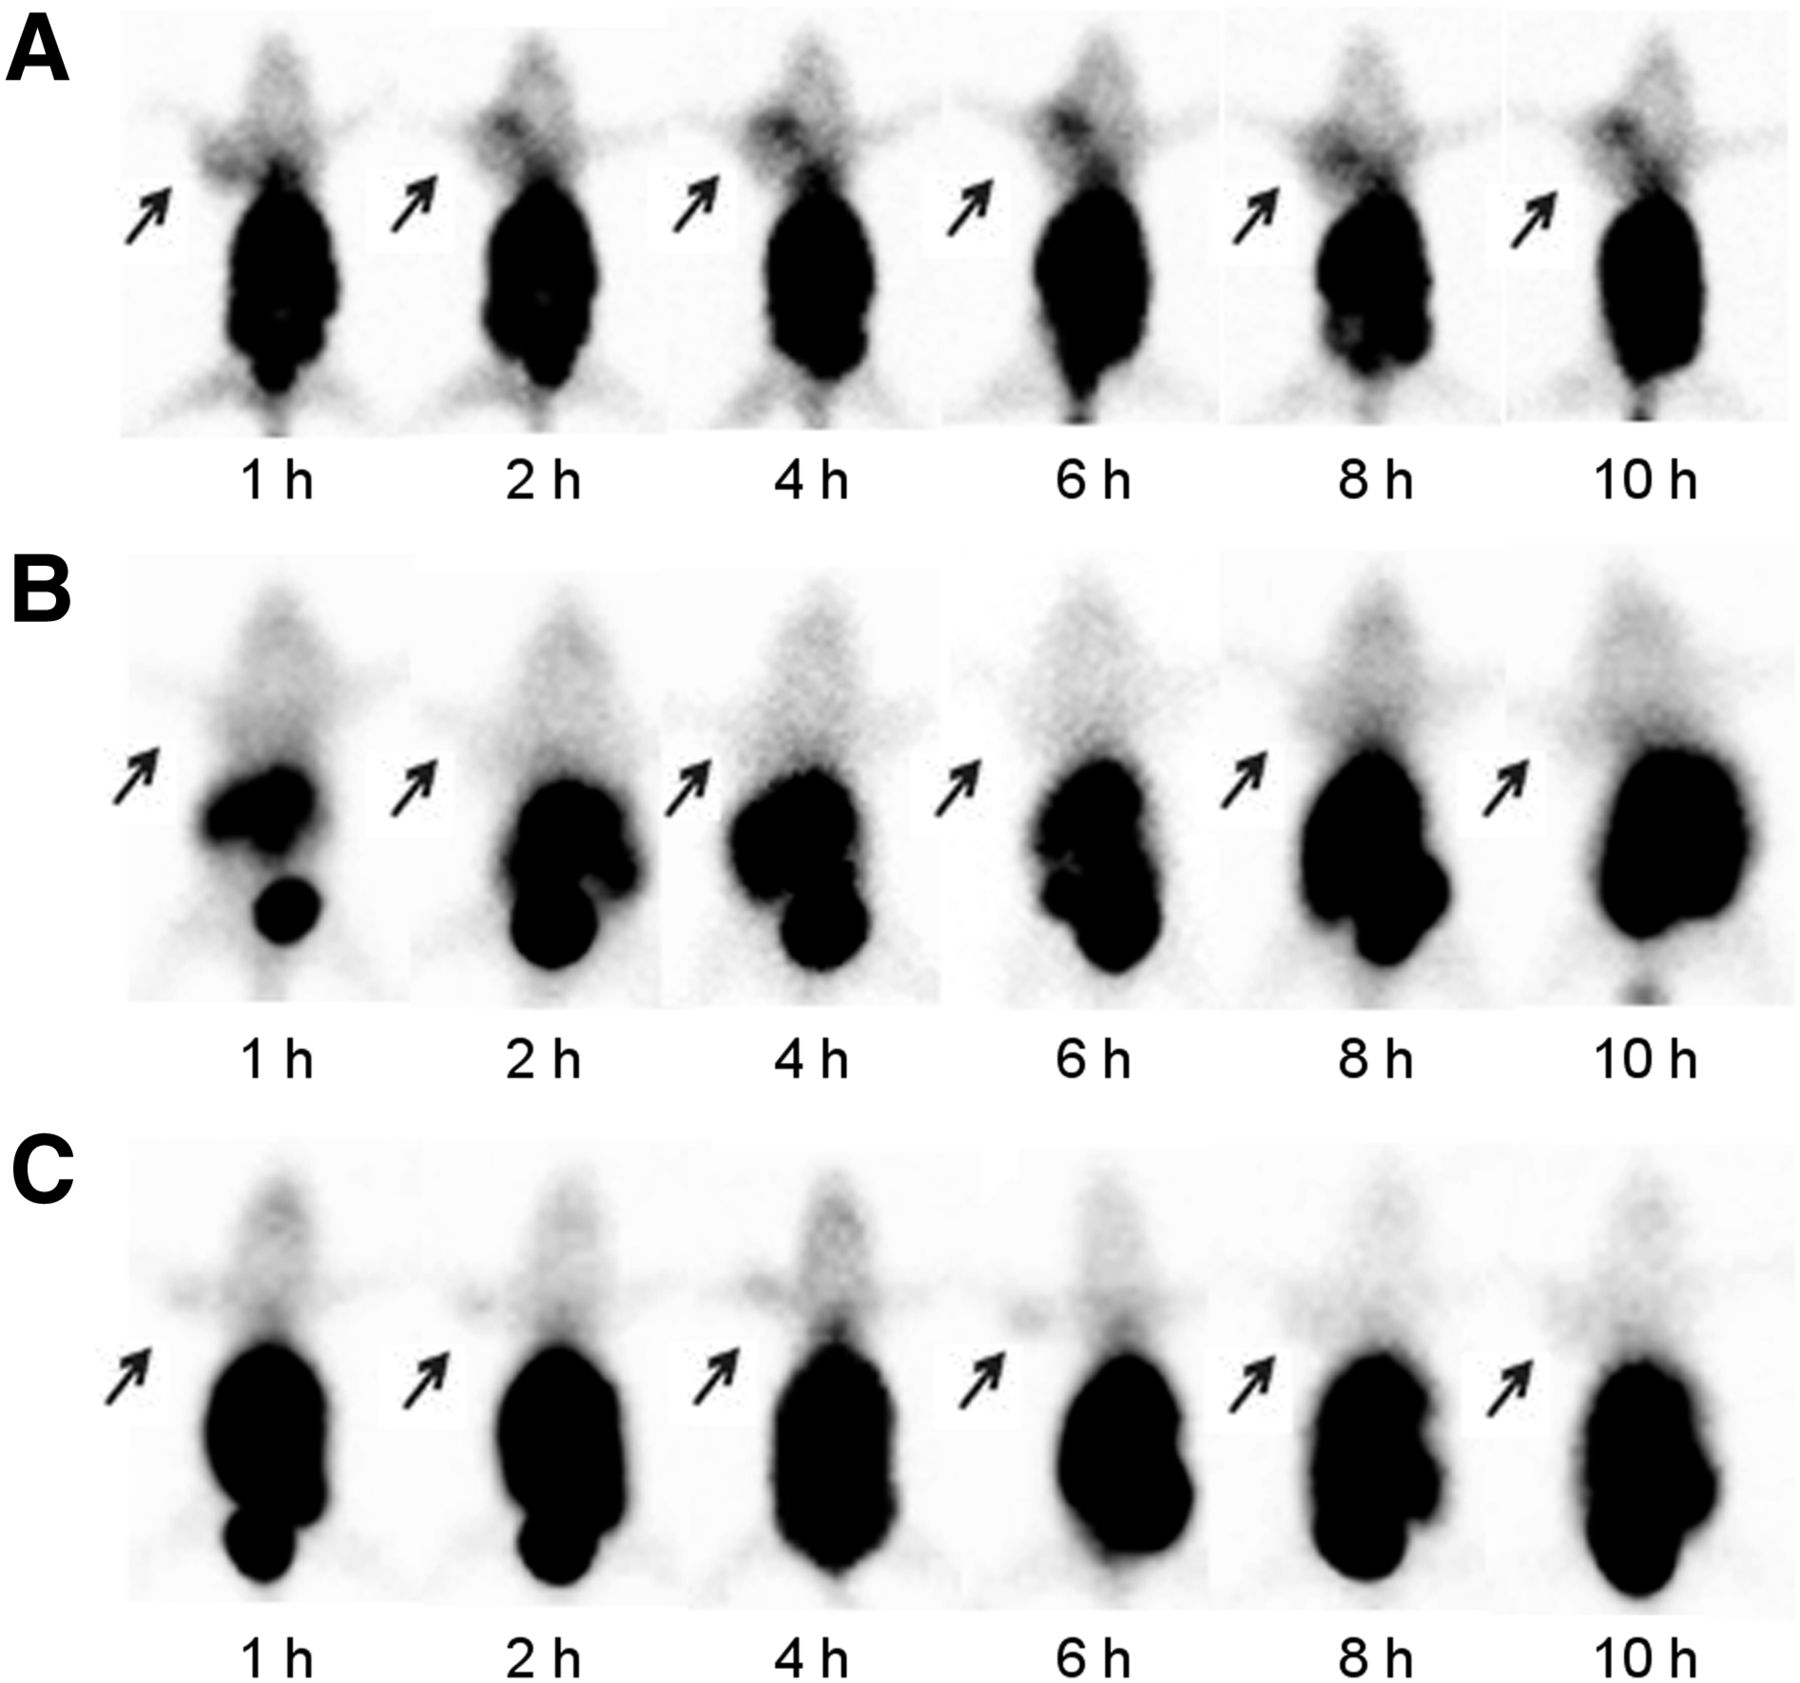
After administration of 99mTc-EGFR-PNA in nude mice bearing SKOV3 xenografts, the images showed intense tracer uptake in the tumor, liver, and kidneys, indicating that the radioactivity was eliminated mainly through the renal and hepatic routes and decreased gradually throughout the body. 99mTc-CTL-PNA in nude mice bearing SKOV3 xenografts and 99mTc-EGFR-PNA in nude mice bearing MDA-MB-435S xenografts shared imaging characteristics similar to those of 99mTc-EGFR-PNA in nude mice bearing SKOV3 xenografts, except for the specific uptake in the tumor (Fig. 7). The 99mTc-EGFR-PNA probe in nude mice SKOV3 xenografts yielded strong images of the tumors at 2–6 h. By contrast, 99mTc-CTL-PNA in nude mice bearing SKOV3 xenografts and 99mTc-EGFR-PNA in nude mice bearing MDA-MB-435S xenografts yielded weak images at all time points. The high-EGFR-expressing SKOV3 xenografts accumulated significantly more 99mTc-EGFR-PNA radioactivity than did the low-EGFR-expressing MDA-MB-435S xenografts and the control group (99mTc-CTL-PNA in SKOV3 xenografts), with significantly different T/NT ratios (P = 0.0000–0.0001, n = 5).

Imaging of EGFR mRNA expression in SKOV3 and MDA-MB-435S xenografts in BABL/c nude mice. Tumor was clearly seen after administration of 99mTc-EGFR-PNA in SKOV3 xenografts in BABL/c nude mice (A), whereas it was not clearly evident after administration of 99mTc-CTL-PNA in SKOV3 (B) and 99mTc-EGFR-PNA in MDA-MB-435S xenografts (C). Arrow = tumor.
DISCUSSION
The overexpression of EGFR in tumors is becoming an attractive target for the development of new cancer imaging agents. EGFR antibodies, Affibody molecules, and EGFR–TKIs were considered candidate probes for EGFR imaging. However, no optimal radiotracer is currently available. Recently, antisense EGFR mRNA–targeted imaging has been developed as an approach to detect EGFR overexpression, particularly of tumors, and monitor metabolism and gene expression in tissues or organs, and it can provide important molecular clues for cancer patient management. In this study, we successfully labeled a 17-mer single-stranded antisense PNA with 99mTc to trace EGFR mRNA expression in the SKOV3 and MDA-MB-435S tumor xenograft models. We found that the SKOV3 xenograft tissues were positively identified by qRT-PCR to overexpress EGFR mRNA; EGFR mRNA binding of 99mTc-EGFR-PNA can be blocked with an excess amount of unlabeled EGFR-PNA in SKOV3 cells; and from the imaging analysis, radioactivity uptake was specifically detected at the EGFR-positive tumor site but not in the control EGFR-negative tumor site.
The 2 probes prepared were a peptide of 4 amino acids (Gly-(D)-Ara-Gly-Gly) with an N4 strong chelating structure and Aba as a spacer to prevent steric hindrance at the 5′ end. This labeling method was simple and shown to be able to achieve high labeling efficiency and radiochemical purity. Compared with the labeling protocol reported by others (25–27), the current method uses NaOH instead of Na3PO4, and the samples are added in a different sequence. A radiochemical stability of over 93% purity was maintained in vitro over a 6-h period. Good stability of the radiolabeled probes was demonstrated both in vitro and in vivo. These characteristics indicated the resistance of the probe to proteases and nucleases in blood and tissues. However, a peak containing 11% of total radioactivity at the retention time of 10 min suggested that they may be degraded fragments of the PNA. Because the polarity of the breakdown product of PNA was increased, it was eluted earlier at 10 min. These results demonstrated the excellent stability of 99mTc-labeled antisense or mismatched PNA and provide solid support for the use of these probes in imaging of EGFR mRNA–expressing targets in vivo.
A comparison of the cellular uptake, internalization, cellular retention, blocking experiment, biodistribution, and molecular imaging between the 2 probes was performed to define the specificity of the EGFR mRNA–targeted probe. EGFR mRNA binding of 99mTc-EGFR-PNA can be blocked with an excess amount of unlabeled EGFR-PNA in SKOV3 cells. Binding was specific, because it could be suppressed. Both the nonspecific and the specific cellular uptake rates of the 99mTc-EGFR-PNA in SKOV3 cells were found to be higher than those observed in the 99mTc-CTL-PNA in SKOV3 cells and 99mTc-EGFR-PNA in MDA-MB-435S cells at 4–24 h after administration. Meanwhile, the cellular retention of the 99mTc-CTL-PNA probe and 99mTc-EGFR-PNA in MDA-MB-435S cells decreased more significantly than that of 99mTc-EGFR-PNA in SKOV3 cells. These results obtained from in vitro experiments indicated that 99mTc-EGFR-PNA can specifically bind the EGFR mRNA sequence in SKOV3 cells.
On the basis of results of the biodistribution and imaging studies, in the tumor itself, the uptake of 99mTc-EGFR-PNA in SKOV3 xenografts was significantly higher than that of the 99mTc-CTL-PNA in SKOV3 xenografts and 99mTc-EGFR-PNA in MDA-MB-435S xenografts after injection. Among the organs, the kidneys and liver saw the highest accumulation of radioactivity. This result is expected because the liver, as a major organ involved in metabolism, carries a high expression level of EGFR (36). During molecular imaging, substantial radioactivity was seen accumulated in the abdomen, consistent with the biodistribution analysis, which would render assessments of tumors relatively challenging in this region. However, SPECT/CT imaging of the abdomen may be useful to help evaluate the uptake of the radiolabeled probe in a known lesion, and the well-defined shape of the kidneys can reduce the risk of image misinterpretation. In this study, a clear image of the SKOV3 tumor was seen shortly after injection of the 99mTc-EGFR-PNA, whereas the 99mTc-CTL-PNA SKOV3 tumor image and 99mTc-EGFR-PNA MDA-MB-435S tumor image did not localize to the tumor at any time. Overall, these results suggest that 99mTc-EGFR-PNA is specifically taken up in EGFR-expressing cells, allowing the detection of EGFR-positive tumors in vivo too.
The presented probe is different from previously described probes that directed EGFR either at an external ligand or at the internal adenosine triphosphate binding domain for imaging of EGFR; it provides an approach to visualize the EGFR mRNA gene expression specifically in vivo. Moreover, the present probe has high sensitivity, specificity, and stability and good imaging of EGFR mRNA in vivo. However, in this study, there are some limitations that should be addressed in future investigations. First, the detailed mechanism for internalization of the 99mTc-labeled EGFR mRNA antisense PNA for hybridization into cells remains unknown. Second, improving the transport of the probe across biologic membranes may allow better imaging results. We propose that the 99mTc-labeled EGFR mRNA antisense PNA molecules penetrate the cells through passive diffusion, because there is no special delivery vector allowing PNA to target cellular oncogenes. Third, PNA molecules are small and as such it may require direct modification or other methods to reduce the nonspecific uptake of PNA by some organs.
CONCLUSION
This study successfully develops an EGFR mRNA antisense PNA probe labeled with 99mTc. This probe not only showed high sensitivity and specificity but also displayed excellent contrast between EGFR-positive and EGFR-negative tumors in imaging studies. Our results showed that 99mTc-EGFR-PNA may be a promising molecular probe for imaging EGFR mRNA expression in tumors in vivo, and it definitely merits further development.
DISCLOSURE
The costs of publication of this article were defrayed in part by the payment of page charges. Therefore, and solely to indicate this fact, this article is hereby marked “advertisement” in accordance with 18 USC section 1734. This study was supported by the National Natural Science Foundation of China (no. 81071186) and the Natural Science Foundation of Hebei Province, China (no. H2102206151). No other potential conflict of interest relevant to this article was reported.
Acknowledgments
We thank Frank T. Wang, at the Molecular Genetics Program, the University of Toronto, for helpful discussion.
Footnotes
Published online Apr. 17, 2014.
- © 2014 by the Society of Nuclear Medicine and Molecular Imaging, Inc.
REFERENCES
- Received for publication December 7, 2013.
- Accepted for publication March 11, 2014.


Jump to section
Related Articles
Cited By...
- No citing articles found.