


Abstract
Ultrashort-echo-time (UTE) sequences have been proposed in the past for MR-based attenuation correction of PET data, because of their ability to image cortical bone. In the present work we assessed the limitations of dual-echo UTE imaging for bone segmentation in head and neck imaging. Sequentially acquired MR and PET/CT clinical data were used for this purpose. Methods: Twenty patients referred for a clinical oncology examination were scanned using a trimodality setup. Among the MR sequences, a dual-echo UTE acquisition of the head was acquired and used to create tissue R2 maps. The different undesired structures present in these maps were identified by an experienced radiologist. Global and local measurements of the overlap between R2-based and CT-based bone masks were computed. Results: UTE R2 maps displayed a nonfunctional relation with CT data. The obtained bone masks showed acceptable overlap with the corresponding CT data, in the case of the skull itself (e.g., 47% mismatch for the parietal region), with decreased performance in the base of the skull and in the neck (e.g., 78% for the maxillary region). Unwanted structures were detected, both anatomic (e.g., sternocleidomastoid, temporal, and masseter muscles) and artifactual (e.g., dental implants and air–tissue interfaces). Conclusion: It is indeed possible to estimate the anatomic location of bone tissue using UTE sequences. However, using pure parametric maps for attenuation correction may lead to bias close to certain anatomic structures and areas of high magnetic field inhomogeneity. More sophisticated approaches are necessary to compensate for these effects.
Twelve years after its commercial introduction, integrated PET/CT has evolved into one of the major imaging procedures in oncology, infection imaging, and cardiology. However, PET/CT has several limitations, both technical and diagnostic, that have recently led to the emergence of hybrid PET/MR scanners (1–3). Among other advantages, PET/MR imaging offers superior soft-tissue contrast (e.g., higher sensitivity for small liver metastases, additional information for lesion characterization, and better depiction of pelvic structures) and lower radiation exposure to the patient. There are, however, several technical and clinical challenges that have to be solved before this modality can reach its full potential.
One of the main topics of controversy is how the attenuation correction of the PET images should be addressed (4–6). PET/CT machines provide the possibility of generating the annihilation photon attenuation map of the patient from a fast low-dose CT scan. This has replaced the former slow measurement of this map by means of external 511-keV radiation sources, thus significantly reducing the total scan time.
Several approaches are currently being investigated to generate valid annihilation photon attenuation maps from fast MR sequences (7–11). Comprehensive reviews of current MR-based attenuation correction methods, their advantages and limitations, are available in the literature (12,13).
MR-based attenuation correction usually falls into 1 of 2 categories: atlas-based methods and segmentation-based methods. The former rely on a set of reference images with known attenuation distribution, which is registered to the acquired MR data. The latter rely on the segmentation of MR data into several tissue classes (e.g., air, lung, fat, soft tissue, and bone) to which predetermined attenuation coefficients are then assigned.
Also worth mentioning because of their great potential, despite being still unsuited for standalone operation, are methods that rely on iterative algorithms to extract both emission and attenuation information from the PET data (14–16). Although currently limited to the correction of small regions for which MR information is unavailable or inaccurate, new scanner designs with time-of-flight PET capability are expected to boost the performance of iterative methods. Furthermore, recent studies propose the inclusion of transmission sources as a means to acquire additional information to constrain the optimization problem (17,18).
For the particular problem of head imaging, atlas-based methods are generally preferred, because of the high impact of bone attenuation in this anatomic region. Indeed, standard MR sequences are unable to depict cortical bone tissue, making the separation of air and bone all but impossible with segmentation-based methods. On the other hand, atlas-based methods are not well suited to dealing with deviations from standard anatomy, such as those found in patients with certain oncologic diseases in the head and neck area, or postoperative patients.
Ultrashort-echo-time (UTE) MR sequences were proposed as a potential solution to this problem. The reason why conventional MR sequences are unable to detect bones—more precisely, the water bound to the organic matrix of bone and the free water in the microscopic pores and canals of the osteons—is not only the low proton density (∼20% of water) but also the short signal lifetime (T2, ∼390 μs at 3 T) (19,20). MR sequences capable of imaging tissues with short T2 relaxation times (<1 ms) could offer the means to account for bone attenuation in hybrid PET/MR scanners. Several studies have already been published discussing the technical feasibility of UTE for PET/MR attenuation correction (21–24).
The goal of the present work was to assess the limitations of dual-echo UTE imaging for bone segmentation in head and neck imaging. For this purpose, we extended the existing technical studies (and in particular that of Keereman et al. (21)) with a detailed clinical comparison of the anatomic structures yielded by UTE bone imaging and CT. For this purpose, a trimodality PET/CT–MR setup was used, enabling the acquisition in a single study of matching datasets of clinical oncology patients.
MATERIALS AND METHODS
Data Acquisition
This investigation was performed in a collaboration between GE Healthcare and the University Hospital, Zurich, Switzerland. The acquisitions were performed using a trimodality setup consisting of a Discovery 750w 3-T MR system (GE Healthcare) located in a room adjacent to a Discovery 690 time-of-flight PET/CT scanner (GE Healthcare). Patients were transported between the systems using a dedicated transfer device, enabling consistent patient placement between the PET/CT and MR imaging systems (25). An improved transfer shuttle that uses air pressure to facilitate the patient transfer was incorporated during the study but should have no impact on the results.
Twenty patients referred for a clinical oncology PET/CT examination were enrolled in this study. The average patient age (±SD) was 62 ± 16 y (range, 24–81 y), the average weight was 73 ± 14 kg (range, 50–101 kg), and the average body mass index was 25 ± 4 kg/m2 (range, 17–34 kg/m2). Two thirds of our patients were men (13), and one third women (7). The present study did not involve any extra radiation dose delivered to the patients, since the used CT is part of the clinical routine PET/CT examination. This study was approved by the institutional ethics committee, and written informed consent was obtained from all patients before the examination.
The PET/CT acquisition followed the standard protocol for a clinical oncology study. First, a helical CT scan (120 kV; 15–80 mA with automatic dose modulation; rotation time, 0.5 s; helical thickness, 3.75 mm; pitch, 39.37 mm/rotation; matrix size, 512 × 512; voxel size, 1.4 × 1.4 × 3.3 mm) was acquired and subsequently used for attenuation correction of PET data. Each PET bed position was acquired for 2 min. The average 18F-FDG dose was 266 ± 30 MBq.
Because the voluntary MR examination was performed during the resting time after the injection of 18F-FDG, the patient’s total time within the department (PET/CT–MR compared with standard PET/CT) was not altered. This allowed us approximately 30 min of MR scanning time. The UTE acquisition lasted 320 s. This relatively long acquisition time—not ideal for clinical purposes—was selected to provide reliable information on the intrinsic performance of UTE bone imaging, without compromises in image resolution or k-space undersampling. A 22-cm transaxial and 24-cm axial field of view was acquired, with a resolution of 1.5 × 1.5 × 2.0 mm. The sequence consisted of 2 echo times (TE1, 30 μs; TE2, 1.7 ms), with a flip angle of 10° and a 125-kHz bandwidth. The k-space was parsed using a radial/conical trajectory optimized to fulfill the Nyquist condition. By adding a twist to the standard center-out 3-dimensional radial trajectory, we increased the readout time, enabling shorter scanning times and higher signal-to-noise efficiency. The implementation of the trajectory was simplified by separating the problem into 2 parts: first, a set of conical surfaces revolving around the z-axis was selected. Second, the gradient waveforms required to optimally cover each of these surfaces was computed (26).
The MR protocol included further sequences, used for the anatomic referencing of whole-body PET findings.
Data Processing
An image registration package (Integrated Registration, AW workstation; GE Healthcare) was used to verify and adjust the registration between the patient head MR and CT images, for each clinical case. Among the most common causes of misregistration were minor rotations of the head around the superior–inferior axis due to patient motion. The included interactive rigid-body motion tool was used to ensure proper alignment of the images, using salient bony structures as a reference (e.g., the lateral orbital pillar, superior part of the frontal sinus, internal occipital protuberance, and clivus). The CT datasets were then resampled to match the resolution of the MR images for use as a quality reference.
Following the well-known approach for bone tissue segmentation of Keereman et al. (21), we combined the dual-echo UTE datasets to estimate a parametric map of the apparent relaxation rate: where ITE1 and ITE2 indicate the magnitude images with echo times TE1 and TE2, respectively. In practice, this calculation yields maps of R2* relaxation, making its results sensitive to local inhomogeneities of the static field. We will keep for simplicity the R2 nomenclature corresponding to the ideal case.
Acquisition noise was accounted for by adding a small constant term to ITE2. The value of this term was automatically adjusted using the SD of the image background.
The resulting map was then masked to remove the high-intensity voxels found on patient skin. The mask of the patient head was obtained by intensity thresholding of the first-echo image using an empiric threshold (ITE1 > 2.5⋅103) and morphologic erosion of the resulting binary image. The whole procedure was automated and required no parameter adjustment for the individual patients.
Image Evaluation
Each CT and R2 image pair was inspected by an experienced radiologist using the AW Volume Viewer software. Fused single axial, sagittal, and coronal 2-dimensional views, as well as overlaid volume renderings of CT and R2 data, were used to determine the anatomic structures present in the R2 images and validate them versus the CT reference.
Joint histogram representations of CT versus R2 values were generated to determine the suitability of UTE MR for the estimation of bone density.
The similarity between the binary bone masks obtained with CT and UTE was measured using the Jaccard distance, which is equal to 1 for maximal dissimilarity and to 0 for complete equality: The binary masks ICT and IUTE were obtained by thresholding using threshold values of 300 Hounsfield units (HU) for CT and 500 s−1 for R2. These values were determined to be optimal by an exhaustive search using Jδ as a metric. Once established, the same threshold values were used for all patients.
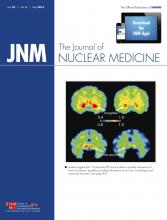
Using this similarity criterion, the quality of the bone masks obtained with the UTE was separately assessed for the following regions: frontal (including orbits), parietal–occipital, nasal, maxillary, and vertebral (Fig. 1).

CT maximum-intensity-projection slab showing anatomic regions considered for distance evaluation: frontal (A), parietal (B), nasal (C), maxillary (D), and vertebral (E).
RESULTS
Anatomic Artifacts
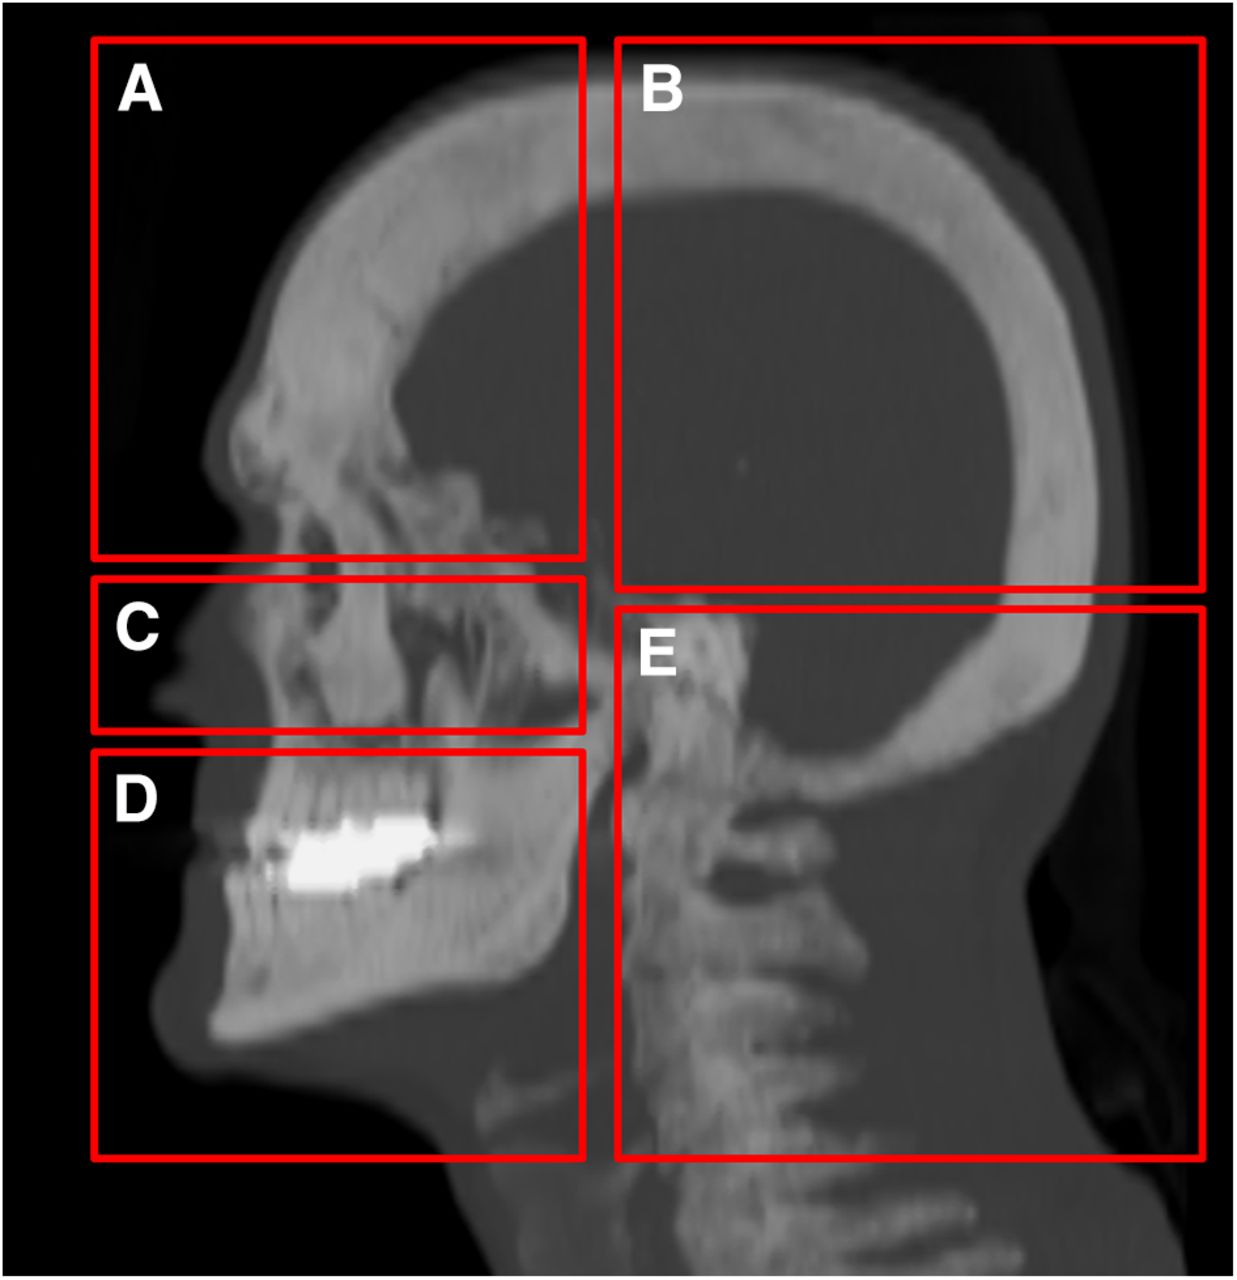
As reported in the literature, UTE R2 maps have been shown to provide a reasonable estimation of the bony structures in the head and neck, with potential use for the attenuation correction of PET data in PET/MR scanners. Two examples of dual-echo UTE images and the resulting R2 maps can be appreciated in Figure 2. The corresponding CT views have been included as a reference.

CT (A and C) and UTE-based R2 (B and D) images of 2 patients. Top row for each patient shows volume-rendered and sagittal views; bottom row shows coronal and axial views. Strong dental artifact can be seen in mouth of second patient.
On the other hand, several unwanted structures with short echo times associated with the facial and neck musculature also show up in the R2 maps. Among these, the most prominent were the cartilage in the ears and the fibers associated with the sternocleidomastoid, temporal, and masseter muscles.
Technical Artifacts
Other unwanted structures found in R2 maps arise from artifacts in the processing of UTE data. The most prominent causes of these were dental implants and air–tissue interfaces. The former were due to MR signal voids around the implant and manifested as spheric hulls of varying size (up to 5 cm) in the R2 map. The latter were due to signal ringing, partial-volume effects, and local field inhomogeneities leading to high R2* values in air interfaces. These can readily be corrected in the case of skin, using a mask of the patient head that can be obtained from the original UTE images. Interfaces in the nasopharyngeal cavities and within the folds of the neck fat, on the other hand, are more complicated to correct. Also, the posterior part of the eyeballs consistently shows high R2 values, probably because of eye motion during the acquisition.
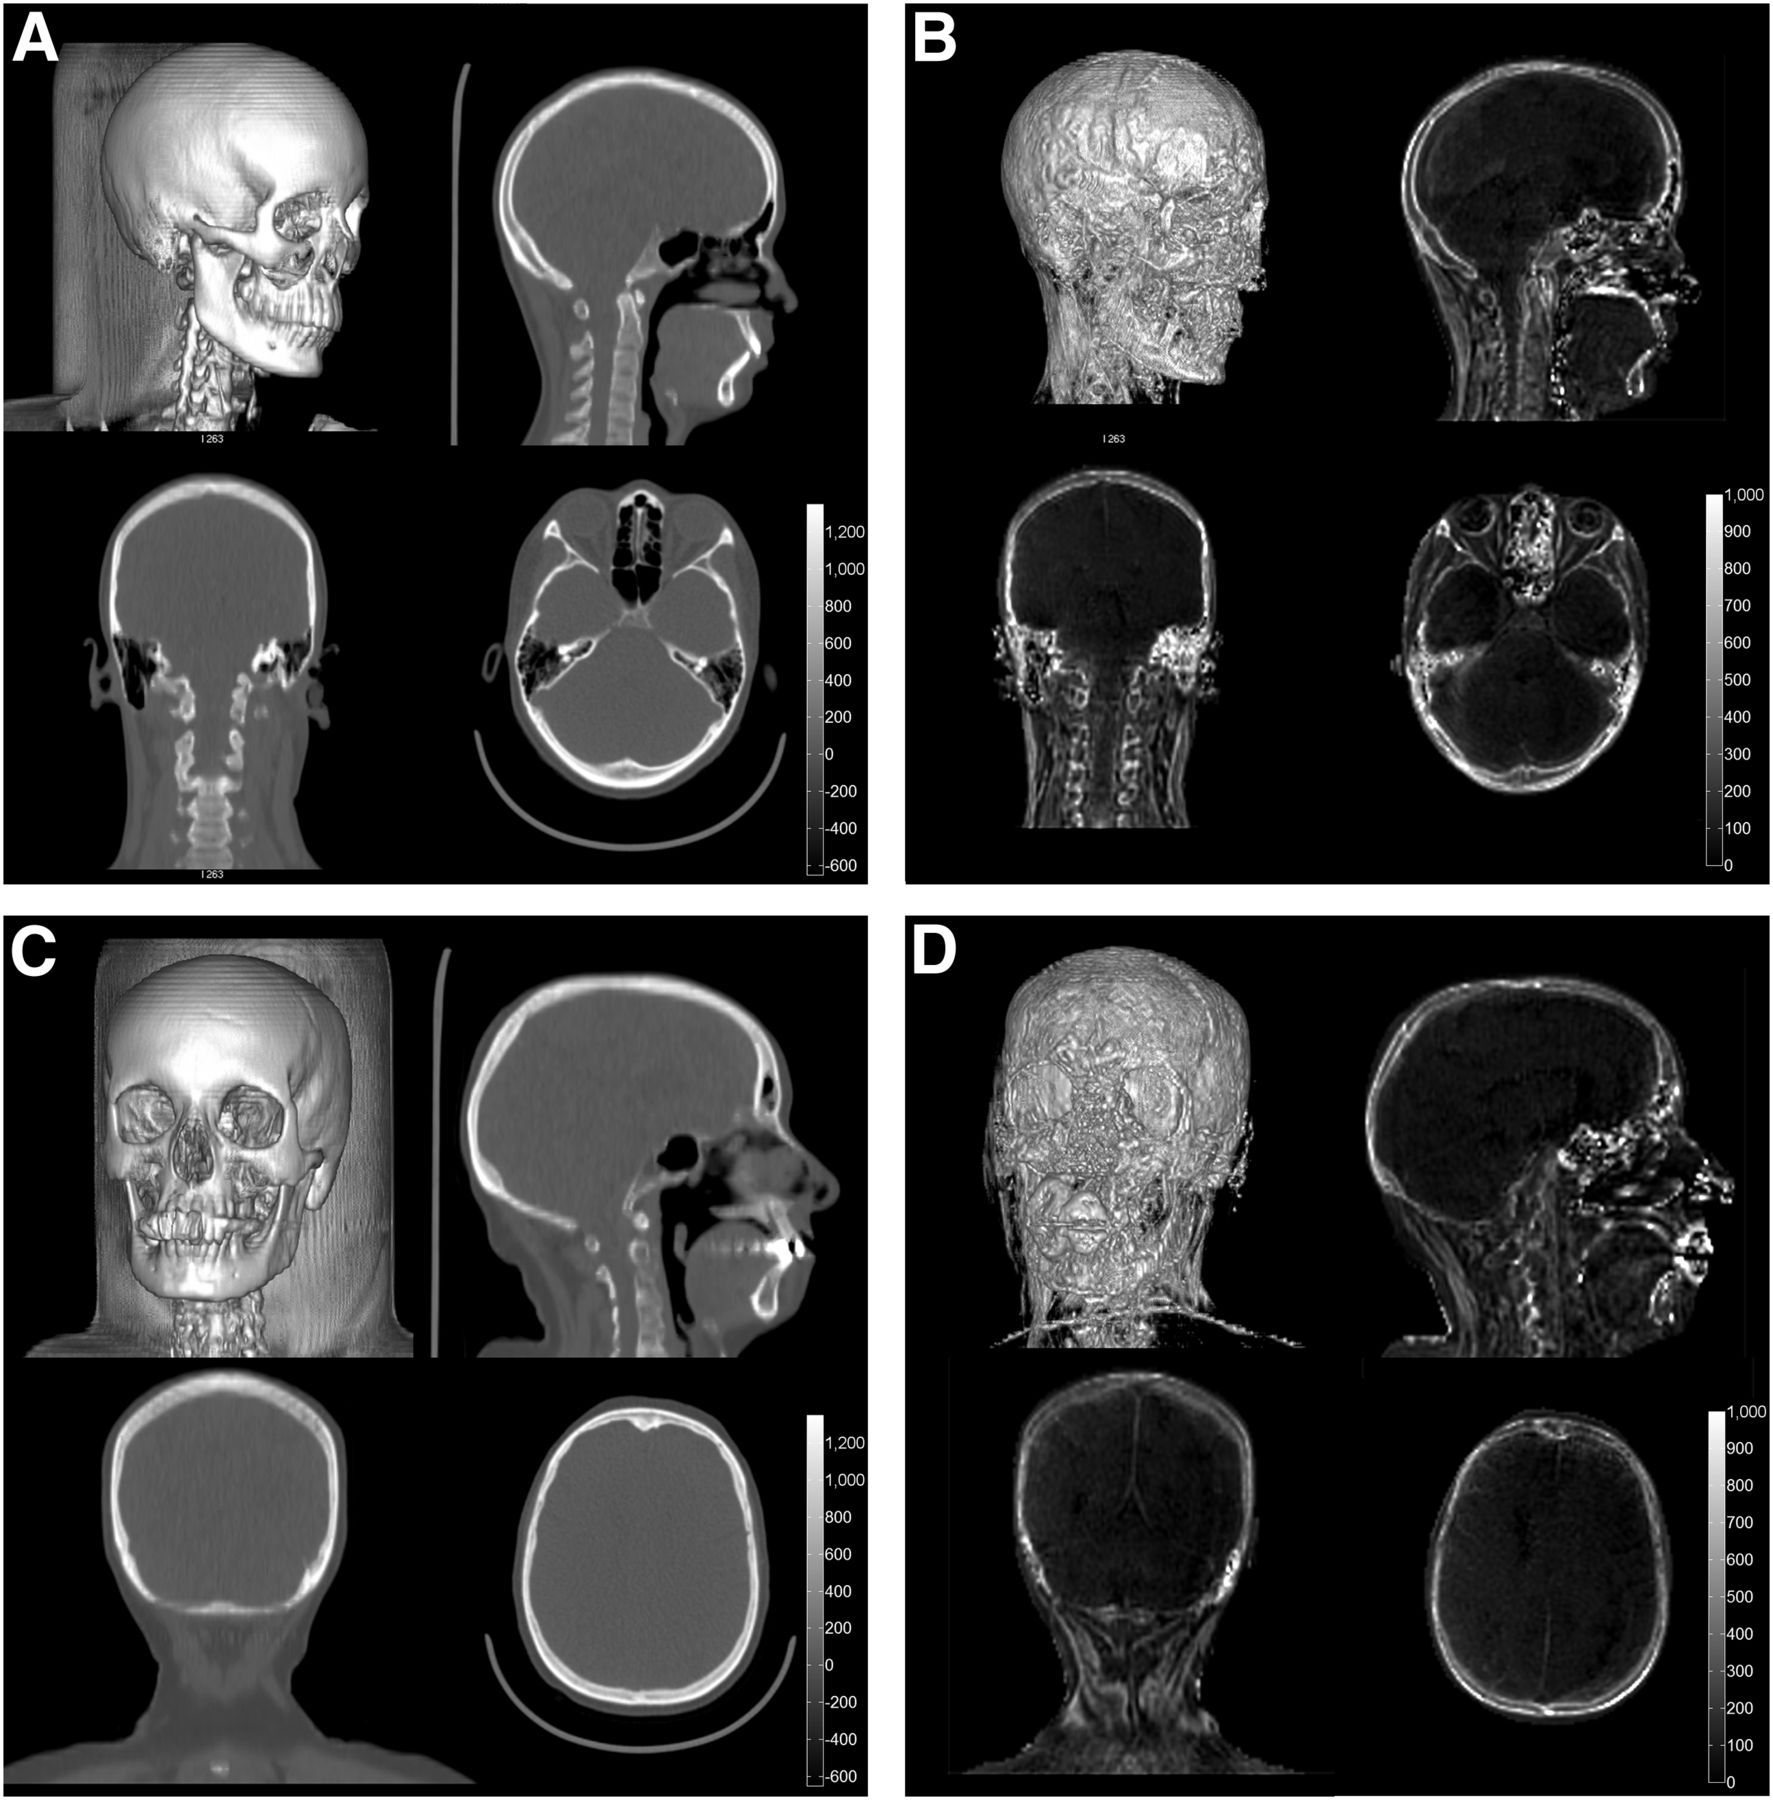
The results of the review performed by the radiologist are summarized in Table 1. The values associated with each structure represent the maximum values observed for these structures in the R2 maps. Eliminating most of these structures by simple thresholding is not possible in practice, considering that typical threshold values to create a bone mask are around 500 s−1. Figure 3 illustrates the bone masks that would be obtained by thresholding the R2 values with different values.
Maximum-Intensity Values of Different Unwanted Structures in R2 Map of Each Patient

Sagittal and volume-rendered views of bone maps, obtained with threshold values of R2 > 300 (A), 400 (B), and 500 (C). Unwanted structures (e.g., air interfaces in throat, neck musculature) are persistent even for threshold values at which gaps start to appear in bone.
Four examples of joint intensity histograms of CT versus UTE R2 maps are shown in Figure 4. There are 2 main clusters of samples, poorly discerned by the R2, corresponding to the fat and soft-tissue region of the Hounsfield scale. A study of tissue relaxation values at 3 T can be found in a previous publication (27). At higher densities (>100 HU), on the other hand, the R2 values show a reasonable degree of correlation with the CT. Notice also the sample cluster corresponding to air, for which the interface effects previously described have led to a wide range of (incorrect) R2 values.

Joint histograms (log scale intensity) of UTE R2 maps and coregistered CT data of 4 patients.
Figure 5 shows slicewise profiles of the Jaccard distance obtained for all patients. A significant performance degradation can be seen in the maxillary and neck areas (index > 80) in comparison with the superior skull region. This indicates a high dissimilarity for the infraorbital region, whereas the supraorbital region shows low dissimilarity, that is, better bone recognition. The Jaccard distance of the segmented skull mask, measured as a whole, was on average 66% ± 7%, ranging from 50% in the best case to 79% in the worst.

Slicewise profiles of Jaccard distance between MR- and CT-based bone masks. Red graph indicates average distance over all patients.
Table 2 summarizes the results obtained with the Jaccard distance, reflecting the morphologic similarity of the bone masks obtained with CT and UTE MR in the different anatomic regions depicted in Figure 1.
Regional Analysis of Jaccard Distance Between CT-Based and UTE-Based Bone Masks
DISCUSSION
The results of this study show that dual-echo UTE sequences can be used to estimate the R2 properties of tissue, which in turn can be used to generate maps of cortical bone. This confirms previous results found in the literature, extending those studies to a large sample of clinical patients for whom CT data acquired during the same scanning session are available as a current clinical standard of reference for attenuation correction. This is, to the best of our knowledge, the first study validating UTE bone imaging versus CT in a large population of clinical patients.
Joint histogram analysis of the obtained R2 maps versus coregistered CT data reveals a nonfunctional intensity relation. Consequently, even though R2 maps do indeed contain valuable information about the distribution of high-density tissue, it is not possible to use R2 as a direct, one-to-one estimator of the attenuation properties of tissue. The main problem resides in the wide range of R2 values obtained for tissue samples between −100 and +100 HU—values at which most biologic tissue is found (e.g., −80 HU for fat, 10–20 HU for protein-rich body fluids, and 30–70 HU for soft tissue without contrast medium). To prevent these samples from being included in the bone mask, high threshold values have to be used on the R2 (e.g., ≥500 s−1), causing a significant number of samples above +100 HU to be excluded from the bone mask.
In contrast, as can be seen in Figure 4, the R2 shows a good correlation with CT for samples above +100 HU. This property could potentially be used to provide rough estimates of bone tissue attenuation, provided that anatomic priors or complementary MR sequences were available to exclude lower-density samples. Some examples of such processing are provided in Supplemental Figure 1 (supplemental materials are available at http://jnm.snmjournals.org). In this case, the available CT data have been used to mask out all tissue below +100 HU. In clinical practice, a similar effect could be achieved by means of an additional MR sequence (e.g., a fast T1-weighted Dixon acquisition).
This would be especially interesting in the particular case of PET/MR attenuation correction, because of the wide range of tissue densities currently assigned to the “bone” class and represented with a single attenuation coefficient (anything above 100 HU and up to 3,000 HU). Until then, further study will be required to determine the optimal postprocessing of MR-based bone masks to best approximate the hard tissue distributions found in the head and neck (e.g., sinogram-space optimization).
From the morphologic point of view, UTE-based bone masks have been shown to match well their CT counterparts. In particular, the neurocranium is accurately represented, including the differentiation of cortical and cancellous layers and the pneumatization. Cancellous bone is often left out during the thresholding of the R2 maps, as well as some parts at the top of the skull, due to partial-volume effects caused by the slightly worse resolution in the superior–inferior direction. The latter would not be expected to have a noticeable impact on the quality of reconstructed PET images if the mask were used for attenuation correction, because the affected region is not intersected by any relevant lines of response (assuming the geometry of a typical brain scan).
The quality of the mask overlap decreases markedly in the nasal, maxillary, and vertebral areas. This decrease in quality can be attributed to field inhomogeneities such as those caused by the air–tissue interface in the sinuses (the bony walls of the ethmoid and sphenoid cells are thin and do not justify the high R2 values in that region). Quality is further decreased by metal artifacts due to dental prostheses and to nonrigid motion between the CT and the MR scans; for example, we have noticed a tendency of many patients to relax their jaw during longer scans, and therefore the local anatomic position changes noticeably between the 2 imaging procedures. However, such problems cannot be excluded in clinical routine PET/MR imaging, particularly with the lengthy imaging protocols currently used. This issue indicates a need for carefully designed, succinct PET/MR imaging protocols for technical and diagnostic evaluation in clinical routine.
Although air interfaces within the body can probably be corrected by preprocessing, and misregistration issues are a limitation of our measurement methodology rather than of UTE bone maps, dental artifacts remain a challenging problem to which no satisfactory solution is yet available. Specialized multispectral MR sequences for imaging near metal (28,29) are an interesting possibility but require long acquisition times and are therefore difficult to integrate within the PET/MR acquisition workflow.
Another interesting finding is the presence of unwanted structures in the bone maps, corresponding either to artifacts of the acquisition method or to actual tissues, other than bone, that share the low R2 property (such as cartilage, tendons, and ligaments). It is unknown at this point to what extent these structures would affect the quantitation of PET uptake (the object of our next study), but it is certainly worth raising the awareness of those groups planning to use UTE sequences for bone attenuation correction.
CONCLUSION
In this work, we have analyzed the performance of UTE MR imaging for the depiction of bones in the head and neck area, using a set of 20 clinical patients imaged using a PET/CT–MR trimodality system.
Our results confirm that UTE R2 maps do indeed contain the required information for the detection of cortical bone, which could be used for PET attenuation correction in the head. However, they also reveal the presence of several unwanted structures and artifacts that—if left uncorrected—would degrade the accuracy of the reconstructed PET images. The obtained bone masks show good overlap with the corresponding CT data, in the case of the skull itself, with markedly decreased performance in the base of the skull and in the neck.
From the point of view of unsegmented intensity correlation, UTE R2 maps displayed a nonfunctional relation with CT data, preventing their direct use as estimators of tissue attenuation. Further processing may enable exploitation of the promising correlation properties found for higher-density tissues.
DISCLOSURE
The costs of publication of this article were defrayed in part by the payment of page charges. Therefore, and solely to indicate this fact, this article is hereby marked “advertisement” in accordance with 18 USC section 1734. No potential conflict of interest relevant to this article was reported.
Footnotes
Published online Mar. 17, 2014.
- © 2014 by the Society of Nuclear Medicine and Molecular Imaging, Inc.
REFERENCES
- Received for publication August 13, 2013.
- Accepted for publication November 11, 2013.


Jump to section
Related Articles
Cited By...
- Clinical Evaluation of Zero-Echo-Time Attenuation Correction for Brain 18F-FDG PET/MRI: Comparison with Atlas Attenuation Correction
- Dixon Sequence with Superimposed Model-Based Bone Compartment Provides Highly Accurate PET/MR Attenuation Correction of the Brain
- Evaluation of Atlas-Based Attenuation Correction for Integrated PET/MR in Human Brain: Application of a Head Atlas and Comparison to True CT-Based Attenuation Correction
- MR-Based Attenuation Correction Using Ultrashort-Echo-Time Pulse Sequences in Dementia Patients
- Clinical Evaluation of Zero-Echo-Time MR Imaging for the Segmentation of the Skull
- Hybrid PET/MR Imaging: An Algorithm to Reduce Metal Artifacts from Dental Implants in Dixon-Based Attenuation Map Generation Using a Multiacquisition Variable-Resonance Image Combination Sequence