


Abstract
It is currently difficult to determine the molecular and cellular basis for radioscintigraphic signals obtained during macroscopic in vivo imaging. The field is in need of technology that helps bridge the macroscopic and microscopic regimes. To solve this problem, we developed a fiducial marker (FM) simultaneously compatible with 2-color near-infrared (NIR) fluorescence (700 and 800 nm), autoradiography, and conventional hematoxylin–eosin (HE) histology. Methods: The FM was constructed from an optimized concentration of commercially available human serum albumin, 700- and 800-nm NIR fluorophores, 99mTc-pertechnetate, dimethyl sulfoxide, and glutaraldehyde. Lymphangioleiomyomatosis cells coexpressing the sodium iodide symporter and green fluorescent protein were labeled with 700-nm fluorophore and 99mTc-pertechnatate and then administered intratracheally into CD-1 mice. After in vivo SPECT imaging and ex vivo SPECT and NIR fluorescence imaging of the lungs, 30-μm frozen sections were prepared and processed for 800-nm NIR fluorophore costaining, autoradiography, and HE staining on the same slide using the FMs to coregister all datasets. Results: Optimized FMs, composed of 100 μM unlabeled human serum albumin, 1 μM NIR fluorescent human serum albumin, 15% dimethyl sulfoxide, and 3% glutaraldehyde in phosphate-buffered saline (pH 7.4), were prepared within 15 min, displayed homogeneity and stability, and were visible by all imaging modalities, including HE staining. Using these FMs, tissue displaying high signal by SPECT could be dissected and analyzed on the same slide and at the microscopic level for 700-nm NIR fluorescence, 800-nm NIR fluorescence, autoradiography, and HE histopathologic staining. Conclusion: When multimodal FMs are combined with a new technique for simultaneous same-slide NIR fluorescence imaging, autoradiography, and HE staining, macroscopic in vivo images can now be studied unambiguously at the microscopic level.
- molecular and cellular basis of signal
- multimodality imaging
- fiducial marker
- autoradiography
- NIR fluorescence
- HE staining
The development of new clinical radiotracers for SPECT and PET is of critical importance (1,2). However, validating that the signal obtained during in vivo radioscintigraphic imaging is emanating from the target of interest can be a challenge (3–5). Particularly difficult is the validation of signals at the cellular or molecular level.
Clinically, histopathologic staining with hematoxylin–eosin (HE) is the gold standard for identification of specific cells and tissues (6); however, ambiguity is common. To ensure proper identification, one or more immunomarkers are typically used, and precipitating pigments are used in conjunction with HE to label cells of interest (3,7). The problem with conventional immunohistochemistry, however, is that the HE image itself is masked by the precipitating pigments (8). To solve this problem, our group has previously developed a technology to perform 2 independent wavelengths of near-infrared (NIR) fluorescence immunostaining on the same specimen and the same slide as conventional HE (Gibbs et al., unpublished data, September 2014). Thus, the unadulterated HE can be used in conjunction with immunomarkers to unambiguously identify cells or molecules of interest.
What is needed in the field of nuclear medicine is the ability to correlate radioscintigraphic signals measured using macroscopic in vivo imaging techniques with validation performed at the single-cell level. But few such techniques exist. For this reason, we focused the present study on developing an optimized fiducial marker (FM) that permits acquisition and coregistration of HE, NIR fluorescence, and autoradiography datasets on the same specimen and on same slide. We hypothesized that such a technology would enable unambiguous validation of macroscopic nuclear images at the microscopic level.
MATERIALS AND METHODS
Preparation of HSA700 and HSA800
Cy5.5 N-hydroxysuccinimide (NHS) ester was purchased from GE Healthcare, and ZW800-1 was synthesized as previously reported (9,10). They were diluted to 10 mM in dimethyl sulfoxide and stored at −80°C under reduced-light conditions. Human serum albumin (HSA) and glutaraldehyde were purchased from Sigma and Electron Microscopy Sciences, respectively. 99mTc-pertechnatate was purchased from Cardinal Health. The red blood cell labeling kit (UltraTag) was purchased from Covidien. Rabbit polyclonal anti–green fluorescent protein (GFP) antibody was purchased from Abcam. Magnesium chloride and trypsin-Versene were purchased from Fisher Scientific and Cambrex, respectively. HSA suspended in phosphate-buffered saline (PBS), pH 7.8, was first purified using gel filtration chromatography with a Bio-Gel P-6 desalting column to remove small molecules that interfere with covalent conjugation by NHS esters. Two equivalents of Cy5.5 NHS ester or ZW800-1 NHS ester were added to the purified HSA in PBS, pH 7.8, and incubated for 3 h to form a stable amide linkage. HSA700 and HSA800 were purified using gel filtration chromatography as above, and the labeling ratio was calculated from the ratio of extinction coefficients between the HSA (ε280 nm = 32,900 M−1cm−1) and the NIR fluorophore (Cy5.5, ε700 nm = 250,000 M−1cm−1; ZW800-1, ε770 nm = 249,000 M−1cm−1). The final NIR fluorophore labeling ratios for HSA700 and HSA800 were 0.95 and 0.96, respectively. All steps were performed under reduced-light conditions. The optical spectra of HSA700 and HSA800 were obtained with an ultraviolet–visible and fluorescence spectrophotometer (Varian). Final products were stored as 0.2 mM stock solutions in PBS, pH 7.4, at 4°C.
Optimization of the Multimodality Fiducial Marker
Unlabeled HSA, HSA700, HSA800, 99mTc-pertechnatate, dimethyl sulfoxide, and glutaraldehyde concentrations were varied systematically, and the homogeneity and stability of conjugation to an amine-coated Superfrost Plus (VWR) microscope slide were measured. Reagents were gently stirred together in a vortex mixer at room temperature (RT), and 0.2 μL of the solution was spotted by hand onto the glass slide, which contained tissue or did not, depending on the experiment. The FM was then incubated for 15 min at RT, washed with distilled water, and dried for 15 min at RT. Tissue samples were circled with a liquid blocker (PAP pen; Sigma) to protect from washing procedures. The glass slide was exposed to a phosphor imaging screen overnight at −20°C. In the following step, the slide was moved to RT and the protective film placed on the FM or the tissue sample removed gently to reduce potential tissue damage. The phosphor imaging screen was read using a Typhoon 9400 system (GE Healthcare). The pixel size and depth were set to 25 μm and 16 bits, respectively. The phosphor imaging screen was erased for a minimum of 2 h before the next experiment and was confirmed to be back to baseline. HSA700 and HSA800 were imaged on a TE 300 microscope system (Nikon) equipped with mercury and xenon excitation sources (Chiu Technical Corp.) and an Orca-ER 12-bit camera (Hamamatsu). To obtain fluorescence images of HSA700, the xenon light source was passed through a 650/45-nm band-pass excitation filter and a 700/35-nm band-pass emission filter (Chroma Technology). To obtain fluorescence images of HSA800, the xenon light source was passed through a 750/50-nm band-pass excitation filter and an 810/40-nm band-pass emission filter (Chroma Technology). Slides were then HE-stained using a standard clinical protocol. The signal intensity, homogeneity, and shape of all obtained fluorescence images were compared before and after HE staining.
Labeling and Imaging of Lymphangioleiomyomatosis cells
Lymphangioleiomyomatosis 621-327 cells (11) were cultured in a 50/50 mixture of Dulbecco modified Eagle medium/F12 (Invitrogen) supplemented with epidermal growth factor (10 ng/mL; Sigma-Aldrich), hydrocortisone (200 nM; Sigma-Aldrich), insulin (25 μg/mL; Sigma-Aldrich), sodium selenite (50 nM; Sigma-Aldrich), transferrin (10 μg/mL; Sigma-Aldrich), ferrous sulfate (1.6 μM; Sigma-Aldrich), and fetal bovine serum (15%, Gemini). The cells were grown at approximately 70% confluence on a 10-cm-diameter tissue culture plate and washed once with PBS containing 1 mM MgCl2. The cells were labeled with 2 μM Cy5.5 NHS ester in 10 mL of PBS/MgCl2 for 30 min at 37°C and washed 3 times, and 10% of the components of the UltraTag red blood cell labeling kit were added. Dose escalation studies confirmed that 2 μM or lower of NHS ester treatment of the cell surface had no impact on cell viability for up to 24 h. The cells were mixed by gently inverting the components of the red blood cell kit for 10 min at 37°C, and then 37 MBq (1 mCi) of 99mTc-pertechnetate were added to the plate. After gentle rocking for 2 h at 37°C, the cells were washed once with buffer and trypsinized by adding 2 mL of trypsin-Versene (Sigma-Aldrich). The cells labeled with Cy5.5 and 99mTc were then washed 3 times by centrifuging at 2,000 rpm for 5 min. The supernatant was discarded carefully so as not to disturb the cell pellet. The radiolabeling efficiency was over 80%. The cells were resuspended in 200 μL of PBS/MgCl2 and loaded on the microscope glass slide, which was fixed with 2% formaldehyde for autoradiography scanning. Autoradiography was performed using the same parameters as described above. The signal of GFP was then imaged using a fluorescence microscope equipped with a 480/40-nm band-pass excitation filter and a 535/50-nm band-pass emission filter.
Immunofluorescence Staining
ZW800-1–conjugated donkey antirabbit secondary antibody was prepared as follows: 400 μL of donkey antibody (stock concentration, 1.2 mg/mL) was buffer-exchanged with PBS using spin columns (Vivaspin 500, 10-kDa molecular weight cutoff; GE Healthcare) to eliminate any sodium azide that might be present in the stock solution. The buffer exchange was performed using centrifugation at 8,000 rpm 5 times, 3 min each. The antibody solution was adjusted to pH 8, and 5–25 equivalents of ZW800-1 NHS ester were added. After a 3-h reaction at RT, the NIR–antibody conjugate was purified using gel filtration chromatography as described above. Purified fractions were collected and concentrated to a 50-μL volume by centrifugation at 10,000 rpm for 3 min. The labeling ratio, calculated from the ratio of extinction coefficients for the antibody (ε280 nm = 150,000 M−1cm−1) and ZW800-1 (ε770 nm = 249,000 M−1cm−1), was 1.5. PBS containing 2.5% goat serum was added to the slide and incubated for 1 h at RT to block nonspecific protein binding sites. Then, the antirabbit polyclonal anti-GFP antibody (1:100 dilution in PBS + 0.1% bovine serum albumin + 0.1% polysorbate 20) was added and incubated overnight at RT. After washing 3 times with PBS containing 0.5% polysorbate 20 (PBS/T), 5 μM ZW800-1 conjugated secondary antibody was added and incubated for 2 h at RT. After incubation, the lymphangioleiomyomatosis cells were washed with PBS/T 3 times, 5 min each time. Lymphangioleiomyomatosis cells were then fixed in 2% paraformaldehyde in PBS for 15 min at RT and then stained with HE. After HE staining, color imaging and 800-nm anti-GFP immunofluorescence imaging were performed.
In Vivo and Ex Vivo Imaging
Animals used in this study were housed in a facility certified by the Association for Assessment and Accreditation of Laboratory Animal Care and staffed by full-time veterinarians. Animal studies were performed under the supervision of the institutional animal care and utilization committee of Beth Israel Deaconess Medical Center in accordance with approved institutional protocol 155-2008. CD-1 mice of either sex, 8–10 wk old, were purchased from Charles River Laboratories. The mice were anesthetized intraperitoneally with ketamine (100 mg/kg) and xylazine (10 mg/kg) (Webster Veterinary). Eighteen-gauge gavage tubing (Fine Science Tool) was placed in the trachea, and 1 × 10⁷ lymphangioleiomyomatosis cells labeled with Cy5.5 (∼10 nmol) and 99mTc (∼30 MBq; 0.8 mCi) in 150 μL of PBS/MgCl2 were administered intratracheally. After 15 min, the mice underwent euthanasia, and a thoracotomy was performed to enucleate the lung tissues.
SPECT and CT images were acquired using a NanoSPECT/CT scanner (Bioscan, Inc.) equipped with 4 NaI(Tl) detectors. For SPECT imaging, 9-pinhole apertures with a diameter of 1.4 mm were used on each detector. The energy window was set at 140 keV ± 20%. SPECT imaging was performed at 24 projections per rotation and 300 s per projection. The projected data were reconstructed using HiSPECT software (Scivis) and a dedicated ordered-subsets expectation maximization algorithm using multiplexed multipinhole SPECT technology. Voxel size and gaussian filter size (full width at half maximum) were set at 0.3 and 1.9 mm, respectively. The iterative update number (subset × iteration) was 27. CT was performed at 45 kVp, 177 μA, and 240 projections per rotation using a complementary metal oxide semiconductor detector with a 96-μm pixel size. Projected data were reconstructed by setting the voxel size to 100 μm.
After in vivo SPECT/CT imaging, the lung tissue was excised and imaged ex vivo using the same protocol. We then positioned the tissue under the FLARE imaging system (fluorescence-assisted resection and exploration; Curadel, LLC) for acquisition of 700-nm NIR fluorescence and color images, as described in detail previously (12,13). After imaging the tissue, we placed the extracted lung tissues in 2% paraformaldehyde in PBS for 30 min before mounting them on the Tissue-Tek OCT (Sakura Finetek). The sample was frozen in liquid nitrogen and cryosectioned into 30-μm-thick sections for fluorescence imaging, autoradiography, and HE staining. A thickness of 30 μm was chosen because the autoradiography signal was otherwise limiting. Three FMs were placed around the tissue. After autoradiography scanning and HE staining, anti-GFP antibody staining was performed using the optimized protocol as described above. The dual-channel NIR fluorescence and color images were obtained using a 55i fluorescence microscope (Nikon) equipped with an encoded motorized stage (Prior Scientific). To obtain the 700-nm fluorescence image, the xenon lamp was passed through a 650/45-nm band-pass excitation filter, a 680-nm low-pass dichroic filter, and a 710/50-nm band-pass emission filter. For 800-nm fluorescence imaging, the xenon lamp was passed through a 750/50-nm band-pass excitation filter, a 810-nm low-pass dichroic filter, and an 824/47-nm band-pass emission filter. The dual NIR fluorescence and autoradiography images were then merged with the HE histology image using the 3 prepositioned FMs, and the weighted center of mass was calculated by ImageJ software, version 1.45q.
RESULTS
Optimization of the FM
The chemical structures and optical spectra of HSA700 and HSA800 are shown in Figure 1. Since the half-life of 99mTc is relatively short (6 h) and a stable chemical reaction is required, we used a simple and facile cross-linking reaction to conjugate albumin to the glass slide while simultaneously trapping 99mTc-pertechnetate in the protein mesh. The type of slide most commonly used in clinical histopathology laboratories is the “plus” slide. The primary amines conjugated to the surface of the plus slide help tissue adhere and also serve as the matrix for FM conjugation.
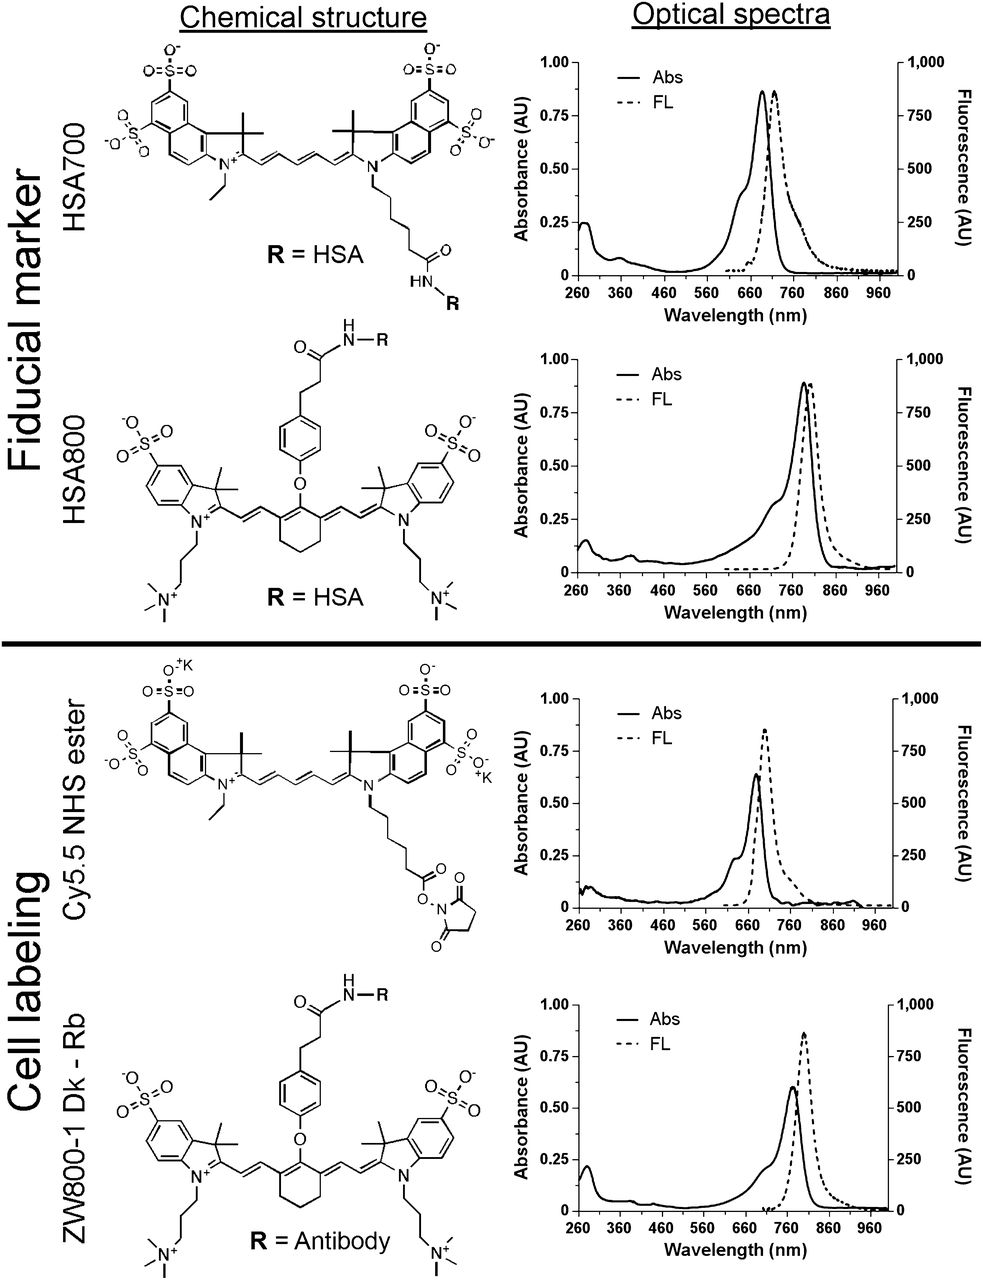
Chemical structure and optical spectra of FMs and cell-labeling reagents. HSA700 and HSA800 for FMs were prepared by conjugating Cy5.5 and ZW800-1, respectively, to purified HSA. Cells were labeled using Cy5.5 NHS ester (700-nm fluorophore) and ZW800-1–conjugated donkey α antirabbit antibody. Shown are chemical structures (left) and optical spectra (right). Abs = absorbance; AU = arbitrary unit; FL = fluorescence.
Preparing FMs that were perfectly homogeneous, however, proved to be a challenge. 99mTc-pertechnetate (0.37 kBq/μL [0.01 μCi/μL]), unlabeled HSA (100 μM), HSA700 (1 μM), and HSA800 (1 μM) were fixed in PBS, pH 7.4, at several different concentrations of glutaraldehyde (1%, 3%, and 5%) and with different concentrations of dimethyl sulfoxide (0%, 5%, 10%, and 15%) for 15 min at RT. The NIR fluorescence signal of HSA700 and HSA800 was imaged before and after HE staining to ensure that the FM was stable. Under all conditions tested, the signal intensity and shape of FMs were not altered significantly by HE staining, and the FM was visible by bright-field microscopy (Fig. 2). However, the homogeneity of the FMs was improved by increasing the concentrations of glutaraldehyde and dimethyl sulfoxide. Optimized conditions for FM production were found to be 100 μM unlabeled HSA, 1 μM HSA700, 1 μM HSA800, 0.37 kBq (0.01 μCi) of 99mTc pertechnetate per microliter, 3% glutaraldehyde, and 15% dimethyl sulfoxide in PBS (pH 7.4) for 15 min at RT.
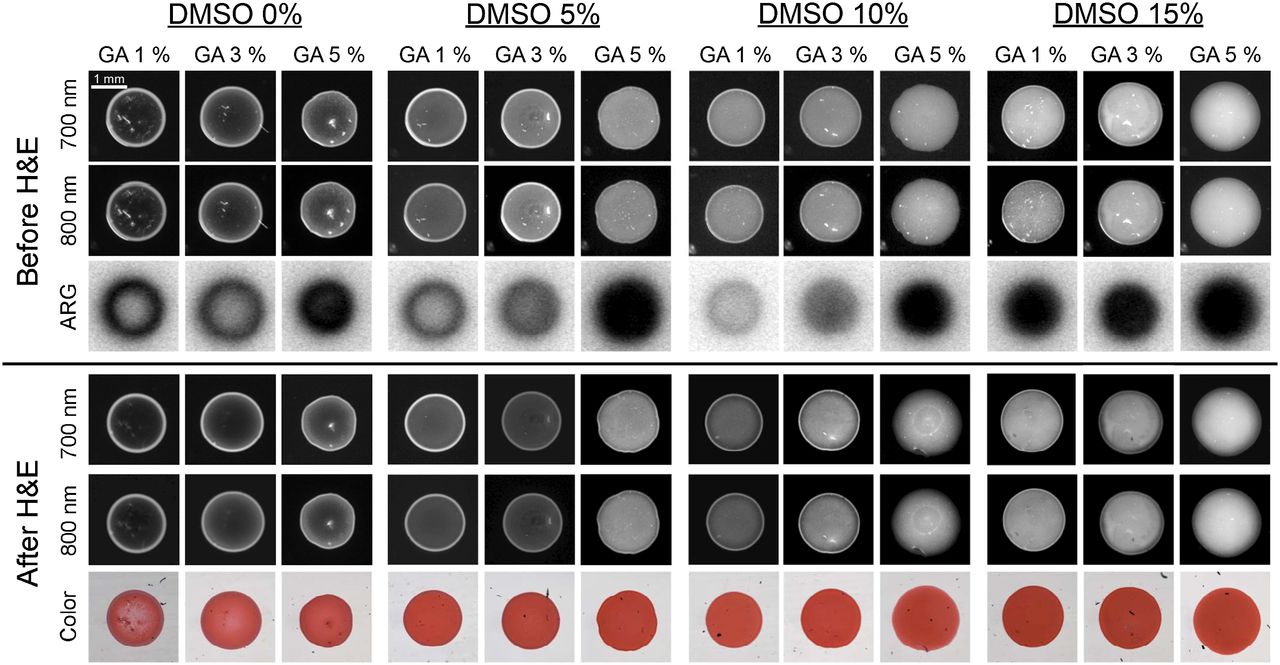
Optimization of FMs. Unlabeled HSA (100 μM), HSA700 (1 μM), HSA800 (1 μM), and 99mTc-pertechnetate (0.37 kBq [0.01 μCi]/μL) in PBS, pH 7.4, were fixed while concentrations of glutaraldehyde and dimethyl sulfoxide were systematically varied as shown. NIR fluorescence signal intensity was measured before (top) and after (bottom) HE staining. Autoradiography was measured before HE staining only. All NIR fluorescence images have identical exposure times and normalizations. Data are representative of 3 independent experiments. ARG = autoradiography; DMSO = dimethyl sulfoxide; GA = glutaraldehyde.
Cell Labeling and Imaging
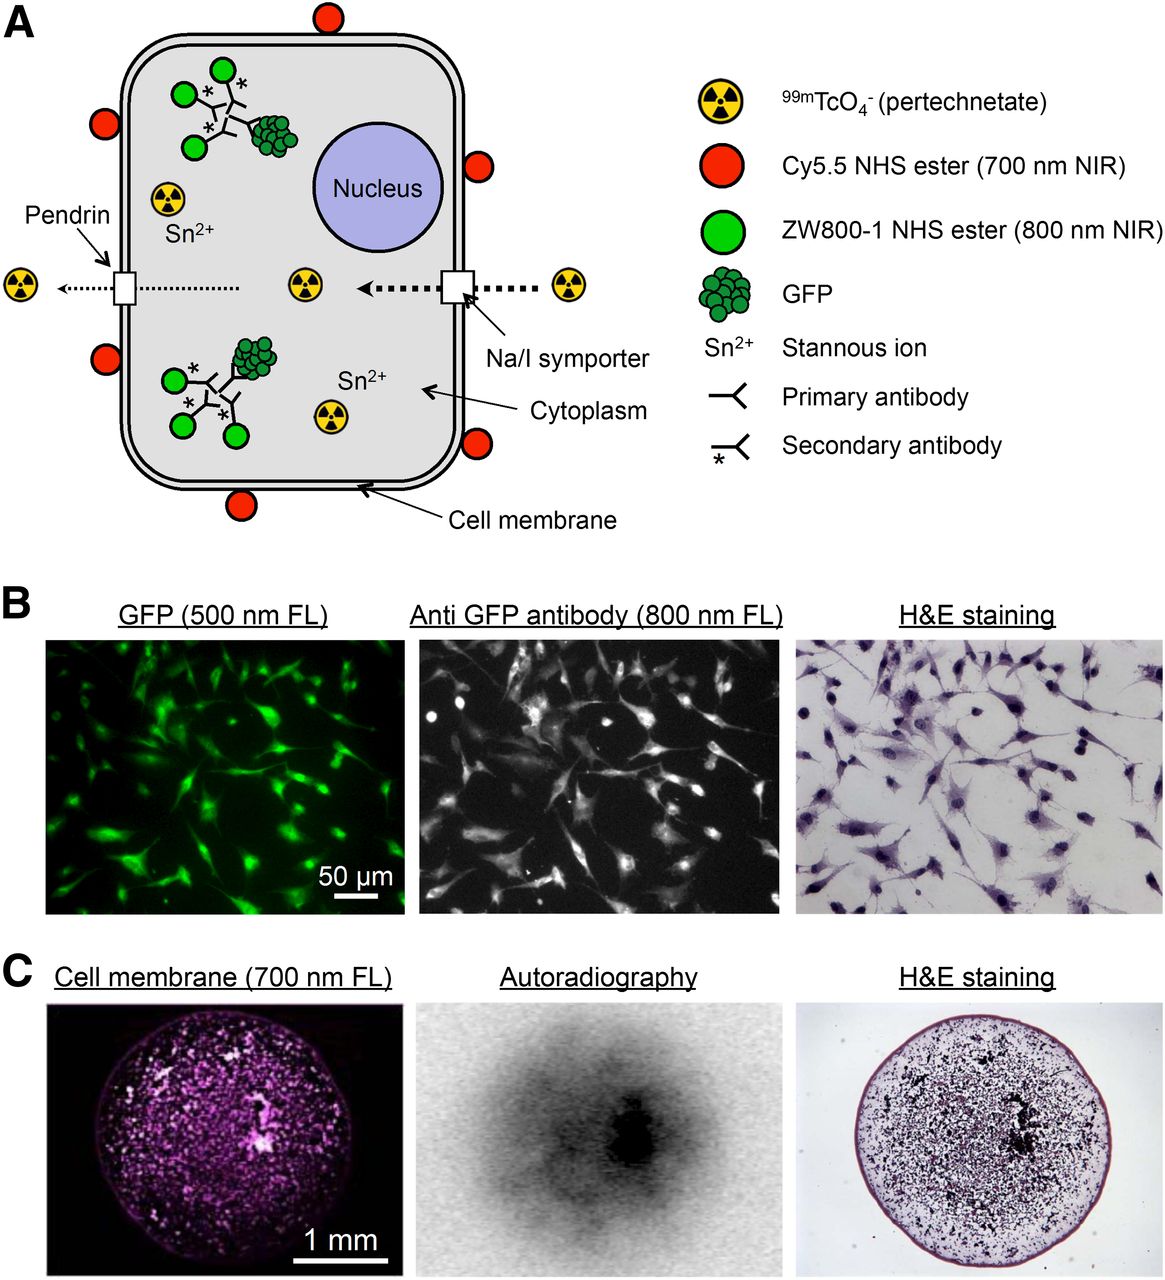
To create single cells that were NIR-fluorescent at 700 and 800 nm, as well as radioactive, lymphangioleiomyomatosis cells stably coexpressing sodium iodide symporter and GFP were incubated with 99mTc-pertechnetate and 700-nm Cy5.5 NHS (Fig. 3A). After fixation, GFP was detected using an unlabeled primary antibody and an 800-nm NIR fluorescent secondary antibody (Fig. 3B). Although expression of sodium iodide symporter alone is sufficient to accumulate 99mTc-pertechnetate in a cell (14,15), we found that incubation with Sn2+, which diffuses across the cell membrane, accumulates intracellularly, and reduces Tc7+, helped to retain the radioisotope.

Multimodality labeling of single cells. (A) Summary of various NIR fluorescent and radioactive molecules used to label lymphangioleiomyomatosis cells. Cy5.5 NHS ester (700-nm NIR) was conjugated to cell membrane. ZW800-1 (800-nm NIR)–conjugated secondary antibody was used for immunofluorescence staining of GFP. 99mTc-pertachnetate was accumulated via sodium iodide symporter, and stannous ion (Sn2+) was used to improve retention of radioisotope in cell. (B) Immunofluorescence staining of GFP. Shown is rabbit polyclonal anti-GFP antibody and ZW800-1 conjugated donkey antirabbit secondary antibody staining of lymphangioleiomyomatosis cells expressing GFP. The 500-nm fluorescence signal for GFP was imaged before HE staining, and 800-nm fluorescence and color microscopy was performed after HE staining. (C) Multimodality microscopy of lymphangioleiomyomatosis cells. Images are for 4-mm-diameter spot of lymphangioleiomyomatosis cells on glass slide. Note single-cell resolution by NIR fluorescence and HE. FL = fluorescence.
The inherent differences in sensitivity, specificity, and resolution among microscopic NIR fluorescence imaging, autoradiography, and HE staining are shown in Figure 3C. In particular, currently available phosphor imaging cassettes are not designed for high-energy isotopes, resulting in significant blurring of what would otherwise be single-cell resolution of the autoradiography signal.
Microscopic Analysis of Macroscopic Radioscintigraphic Images
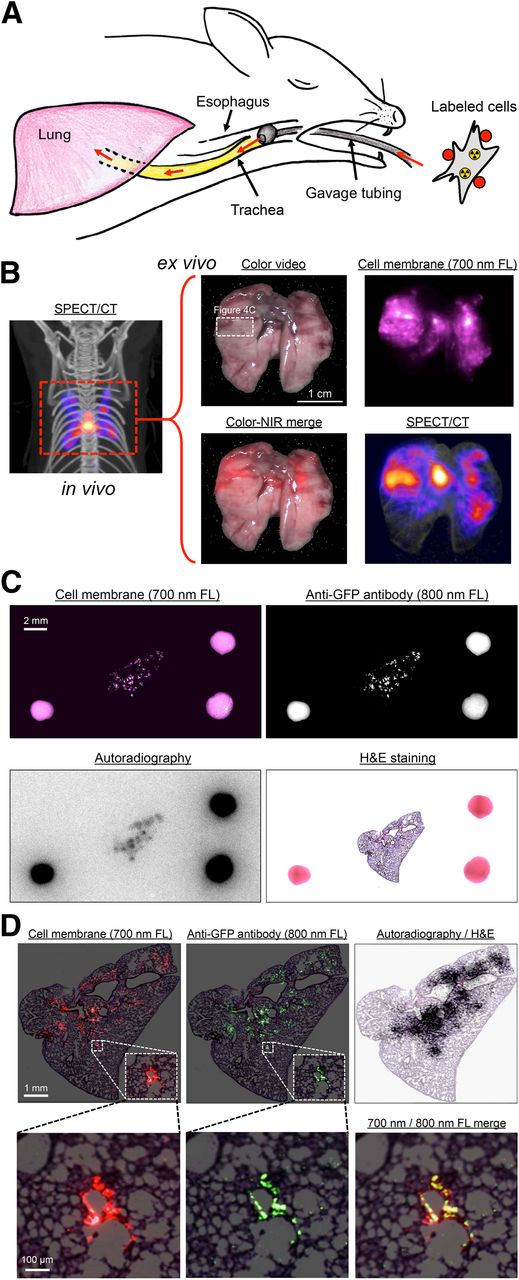
The 700-nm NIR fluorescent and radioactive lymphangioleiomyomatosis cells were administered intratracheally into CD-1 mice (Fig. 4A), and in vivo SPECT/CT imaging was performed (Fig. 4B). After surgical removal of the lung, SPECT/CT, color, and 700-nm fluorescence images were obtained (Fig. 4B) and a portion of lung tissue having both optical and nuclear signal was excised and processed for immunofluorescence using an 800-nm NIR fluorophore-conjugated antibody. As shown in Figure 4C, it was possible to analyze 2 independent channels (700 and 800 nm) of NIR fluorescence, as well as autoradiography, on the same specimen and on the same slide, with all datasets able to be coregistered using the FMs. Both NIR fluorescent and HE optical imaging could be performed with single-cell resolution (Fig. 4D). As might be expected on the basis of the experimental protocol, lymphangioleiomyomatosis cells were found to be distributed peribronchially (Fig. 4D).

In vivo and ex vivo multifunctional imaging. (A) Schematic representation of in vivo mouse model. Labeled lymphangioleiomyomatosis cells (Fig. 3A) were administered intratracheally into CD-1 mice using gavage tubing. (B) In vivo maximal-intensity-projection SPECT/CT image (left) and ex vivo color, 700-nm fluorescence, color-NIR merge (700-nm signal is pseudocolored in red), and maximal-intensity-projection SPECT/CT images (right) of excised lung. Images shown are representative of 3 independent experiments. White rectangle delineates excised tissue sample studied in C. (C) Same-slide 700-nm NIR fluorescence (cell membrane staining), 800-nm NIR fluorescence (anti-GFP staining), autoradiography, and HE staining of lymphangioleiomyomatosis cells in lung tissue of CD-1 mouse. The 2-mm-diameter multimodal FMs visible in each image were used to coregister datasets. (D) Same as C but at higher magnification, with 700-nm NIR fluorescent signal pseudocolored in red, 800-nm NIR fluorescent signal pseudocolored in green, and autoradiography signal superimposed on HE image. FL = fluorescence.
DISCUSSION
This study addressed a fundamental problem in the field of nuclear medicine, the validation of macroscopic radioscintigraphic signals at the microscopic level. Previously, Axente et al. introduced coregistration between autoradiography and microscopic images (e.g., images of cell proliferation and HE) acquired from consecutive tissue sections using the deformable registration method (16). However, it has been a challenge to validate the radioscintigraphic signal and microscopic images on the same slide.
Having already optimized 2 channels of NIR fluorescence microscopy with HE staining on the same slide (Gibbs et al., unpublished data, September 2014), we assumed that adding the autoradiography dataset would be straightforward. On the contrary, coregistration of datasets between optical and nuclear imaging was found to be a major issue because autoradiography lacks identifiable landmarks and was acquired the night before the optical images. Even when a dual functional diagnostic agent (i.e., SPECT/NIR fluorescent probe) has been used for surgical navigation of resecting sentinel lymph nodes, a similar problem has been reported (17,18). To circumvent this issue, we have described a simple, inexpensive FM that can be applied to a standard plus slide and permits rotation, translation, and morphing of datasets as needed among bright-field microscopy, NIR fluorescence immunomicroscopy, and autoradiography. This FM can be created with commercially available reagents in only 15 min, which is an important point when considering the short half-life of many SPECT and PET radiotracers.
The biologic example we have shown in this study, namely the tracking of lymphangioleiomyomatosis cells after administration into the airspaces of the lung, actually has important implications. Our group recently described a new animal model of lymphangioleiomyomatosis and the related disease tuberous sclerosis complex that recapitulates the homing of lymphangioleiomyomatosis/tuberous sclerosis complex cells to virtually every lymph node basin in the body (11). However, it is extremely difficult to study the mechanism of cellular translocation and lymph node homing because the process involves single cells. Armed with the technology described in this paper, it should now be possible to track cells using in vivo imaging methods and to analyze the source of measured signals at the microscopic level. This same strategy could be used to study similar processes, such as the early steps of cancer metastasis.
Nevertheless, our study also had limitations. Currently available phosphor imaging systems are not designed for high-energy γ radioisotopes, and significant degradation of resolution occurs (e.g., Fig. 4C). Estimates of full-width-at-half-maximum resolution for 99mTc and 18F are 350 and 460 μm, respectively (19). Fortunately, recent innovations in “γ microscopes” and other high-resolution techniques (20–22) suggest that a revolution in autoradiography is imminent, and our FMs will likely prove useful in validating this new technology. Improved resolution and quantitative information can also be achieved using a β imager (e.g., the BetaImager [Biospace Lab]) by replacing 99mTc in our example with a β-emitting radionuclide (e.g., 3H and 14C), provided that its chemical form is trapped as well as 99mTc.
The ultimate use of the FMs we describe is to bridge the microscopic–macroscopic divide. As autoradiography technology evolves to a higher resolution, one can envision the day when a specimen is imaged in vivo using SPECT or PET and then resected and processed onto slides as we describe. NIR fluorescence could be used either to validate the source of the radioactive signal (using specific antibodies, for example) or to identify NIR fluorophore–labeled cells or tissues. Provided that the spacing and rotation between the sections are known, the high-resolution autoradiography images could then be assembled into a 3-dimensional dataset and coregistered with the in vivo image as has been shown previously (23). Someday, one might even have to blur the autoradiography dataset to qualitatively match the in vivo dataset. That day, in fact, would signal that the microscopic–macroscopic divide has finally been conquered.
CONCLUSION
We have developed a specialized FM and processing techniques that permit same-slide autoradiography, 700-nm and 800-nm NIR fluorescence, and HE histopathologic analysis at the single-cell level. FM marker preparation takes only 15 min using readily available reagents. Using this technology, macroscopic nuclear images can be validated at the microscopic level.
DISCLOSURE
The costs of publication of this article were defrayed in part by the payment of page charges. Therefore, and solely to indicate this fact, this article is hereby marked “advertisement” in accordance with 18 USC section 1734. Dr. Frangioni is currently CEO of Curadel, LLC, a for-profit company that has licensed FLARE technology from Beth Israel Deaconess Medical Center. This study was supported by grants from the National Institutes of Health (NCI grant R01-CA-134493, NIBIB grant R01-EB-010022, and NIBIB grant R01-EB-011523) and by a grant from the Tuberous Sclerosis Alliance. The views expressed are solely those of the authors and do not necessarily reflect those of the National Institutes of Health. No other potential conflict of interest relevant to this article was reported.
Acknowledgments
We thank David Burrington, Jr., for editing and Eugenia Trabucchi for administrative assistance.
Footnotes
Published online Oct. 16, 2014.
- © 2014 by the Society of Nuclear Medicine and Molecular Imaging, Inc.
REFERENCES
- Received for publication April 14, 2014.
- Accepted for publication September 5, 2014.


Jump to section
Related Articles
Cited By...
- No citing articles found.