
Main menu

  • Home
  • Content
    • Current
    • Ahead of print
    • Past Issues
    • JNM Supplement
    • SNMMI Annual Meeting Abstracts
    • Continuing Education
    • JNM Podcasts
  • Subscriptions
    • Subscribers
    • Institutional and Non-member
    • Rates
    • Journal Claims
    • Corporate & Special Sales
  • Authors
    • Submit to JNM
    • Information for Authors
    • Assignment of Copyright
    • AQARA requirements
  • Info
    • Reviewers
    • Permissions
    • Advertisers
  • About
    • About Us
    • Editorial Board
    • Contact Information
  • More
    • Alerts
    • Feedback
    • Help
    • SNMMI Journals
  • SNMMI
    • JNM
    • JNMT
    • SNMMI Journals
    • SNMMI

User menu

  • Subscribe
  • My alerts
  • Log in
  • Log out
  • My Cart

Search

  • Advanced search
Journal of Nuclear Medicine
  • SNMMI
    • JNM
    • JNMT
    • SNMMI Journals
    • SNMMI
  • Subscribe
  • My alerts
  • Log in
  • Log out
  • My Cart
Journal of Nuclear Medicine

Advanced Search

  • Home
  • Content
    • Current
    • Ahead of print
    • Past Issues
    • JNM Supplement
    • SNMMI Annual Meeting Abstracts
    • Continuing Education
    • JNM Podcasts
  • Subscriptions
    • Subscribers
    • Institutional and Non-member
    • Rates
    • Journal Claims
    • Corporate & Special Sales
  • Authors
    • Submit to JNM
    • Information for Authors
    • Assignment of Copyright
    • AQARA requirements
  • Info
    • Reviewers
    • Permissions
    • Advertisers
  • About
    • About Us
    • Editorial Board
    • Contact Information
  • More
    • Alerts
    • Feedback
    • Help
    • SNMMI Journals
  • View or Listen to JNM Podcast
  • Visit JNM on Facebook
  • Join JNM on LinkedIn
  • Follow JNM on Twitter
  • Subscribe to our RSS feeds
Research ArticleClinical Investigations

Metabolic Networks Underlying Cognitive Reserve in Prodromal Alzheimer Disease: A European Alzheimer Disease Consortium Project

Silvia Morbelli, Robert Perneczky, Alexander Drzezga, Giovanni B. Frisoni, Anna Caroli, Bart N.M. van Berckel, Rik Ossenkoppele, Eric Guedj, Mira Didic, Andrea Brugnolo, Mehrdad Naseri, Gianmario Sambuceti, Marco Pagani and Flavio Nobili
Journal of Nuclear Medicine June 2013, 54 (6) 894-902; DOI: https://doi.org/10.2967/jnumed.112.113928
Silvia Morbelli
1Nuclear Medicine, Department of Internal Medicine, IRCCS AOU San Martino–IST, University of Genoa, Genoa, Italy
  • Find this author on Google Scholar
  • Find this author on PubMed
  • Search for this author on this site
Robert Perneczky
2Department of Psychiatry and Psychotherapy, Technische Universität, Munich, Germany
3Neuroepidemiology and Ageing Research Unit, School of Public Health, Faculty of Medicine, Imperial College of Science, Technology, and Medicine, London, United Kingdom
  • Find this author on Google Scholar
  • Find this author on PubMed
  • Search for this author on this site
Alexander Drzezga
4Department of Nuclear Medicine, Technische Universität, Munich, Germany
5Department of Nuclear Medicine, University of Cologne, Cologne, Germany
  • Find this author on Google Scholar
  • Find this author on PubMed
  • Search for this author on this site
Giovanni B. Frisoni
6LENITEM Laboratory of Epidemiology and Neuroimaging-IRCCS S. Giovanni di Dio-FBF, Brescia, Italy
  • Find this author on Google Scholar
  • Find this author on PubMed
  • Search for this author on this site
Anna Caroli
6LENITEM Laboratory of Epidemiology and Neuroimaging-IRCCS S. Giovanni di Dio-FBF, Brescia, Italy
7Medical Imaging Unit, Biomedical Engineering Department, Mario Negri Institute, Bergamo, Italy
  • Find this author on Google Scholar
  • Find this author on PubMed
  • Search for this author on this site
Bart N.M. van Berckel
8Department of Nuclear Medicine & PET Research, VU University Medical Center, Amsterdam, The Netherlands
  • Find this author on Google Scholar
  • Find this author on PubMed
  • Search for this author on this site
Rik Ossenkoppele
8Department of Nuclear Medicine & PET Research, VU University Medical Center, Amsterdam, The Netherlands
  • Find this author on Google Scholar
  • Find this author on PubMed
  • Search for this author on this site
Eric Guedj
9Aix-Marseille University, CERIMED and CNRS, Marseille, France
  • Find this author on Google Scholar
  • Find this author on PubMed
  • Search for this author on this site
Mira Didic
10APHM, CHU Timone, Service de Neurologie et Neuropsychologie, Aix-Marseille University, INSERM U 1106, Marseille, France
  • Find this author on Google Scholar
  • Find this author on PubMed
  • Search for this author on this site
Andrea Brugnolo
11Clinical Neurophysiology, Department of Neuroscience, Ophthalmology, and Genetics, IRCCS AOU San Martino–IST, University of Genoa, Genoa, Italy
  • Find this author on Google Scholar
  • Find this author on PubMed
  • Search for this author on this site
Mehrdad Naseri
1Nuclear Medicine, Department of Internal Medicine, IRCCS AOU San Martino–IST, University of Genoa, Genoa, Italy
  • Find this author on Google Scholar
  • Find this author on PubMed
  • Search for this author on this site
Gianmario Sambuceti
1Nuclear Medicine, Department of Internal Medicine, IRCCS AOU San Martino–IST, University of Genoa, Genoa, Italy
  • Find this author on Google Scholar
  • Find this author on PubMed
  • Search for this author on this site
Marco Pagani
12Institute of Cognitive Sciences and Technologies, CNR, Rome, Italy and
13Department of Nuclear Medicine, Karolinska Hospital, Stockholm, Sweden
  • Find this author on Google Scholar
  • Find this author on PubMed
  • Search for this author on this site
Flavio Nobili
11Clinical Neurophysiology, Department of Neuroscience, Ophthalmology, and Genetics, IRCCS AOU San Martino–IST, University of Genoa, Genoa, Italy
  • Find this author on Google Scholar
  • Find this author on PubMed
  • Search for this author on this site
  • Article
  • Figures & Data
  • Supplemental
  • Info & Metrics
  • PDF
Loading

Article Figures & Data

Figures

  • Tables
  • Additional Files
  • FIGURE 1.
    • Download figure
    • Open in new tab
    • Download powerpoint
    FIGURE 1.

    Comparison between LE (A) and HE (B) prodromal AD patients and education-matched controls. Height significance threshold: P < 0.05, corrected for multiple comparisons (false discovery rate), at both peak and cluster levels. Figure displays regions of significant difference, color-graded in terms of z values. Talairach coordinates and further details are provided in Supplemental Table 2.

  • FIGURE 2.
    • Download figure
    • Open in new tab
    • Download powerpoint
    FIGURE 2.

    Comparison between LE and HE prodromal AD patients. Height thresholds: uncorrected P < 0.001 at peak level; P < 0.05 FDR-corrected at cluster level. These 2 clusters were finally saved and used as ROIs, one with ROI depression (A, LE > HE) and another with ROI compensation (B, HE > LE). Talairach coordinates and further details are provided in Supplemental Table 2 and in Table 3.

  • FIGURE 3.
    • Download figure
    • Open in new tab
    • Download powerpoint
    FIGURE 3.

    Voxelwise interregional correlation analysis of ROI depression in LE (A) and HE (B) prodromal AD patients. Talairach coordinates and further details are provided in Table 4.
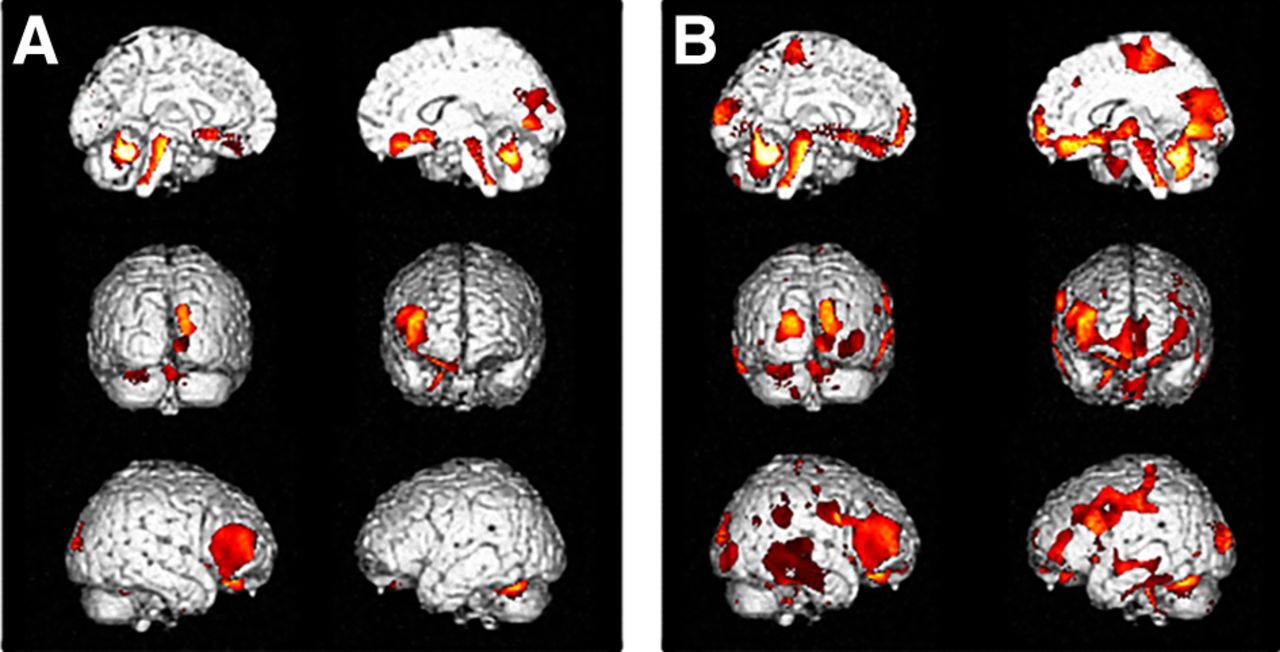
  • FIGURE 4.
    • Download figure
    • Open in new tab
    • Download powerpoint
    FIGURE 4.

    Interregional correlation analysis of ROI compensation in LE (A) and HE (B) prodromal AD patients. Talairach coordinates and further details are provided in Table 5.

  • FIGURE 5.
    • Download figure
    • Open in new tab
    • Download powerpoint
    FIGURE 5.

    Interregional correlation analysis of ROI compensation in LE (A) and HE (B) controls. Other figure details are provided in legend to Figure 2. Talairach coordinates and further details are provided in Supplemental Table 3.
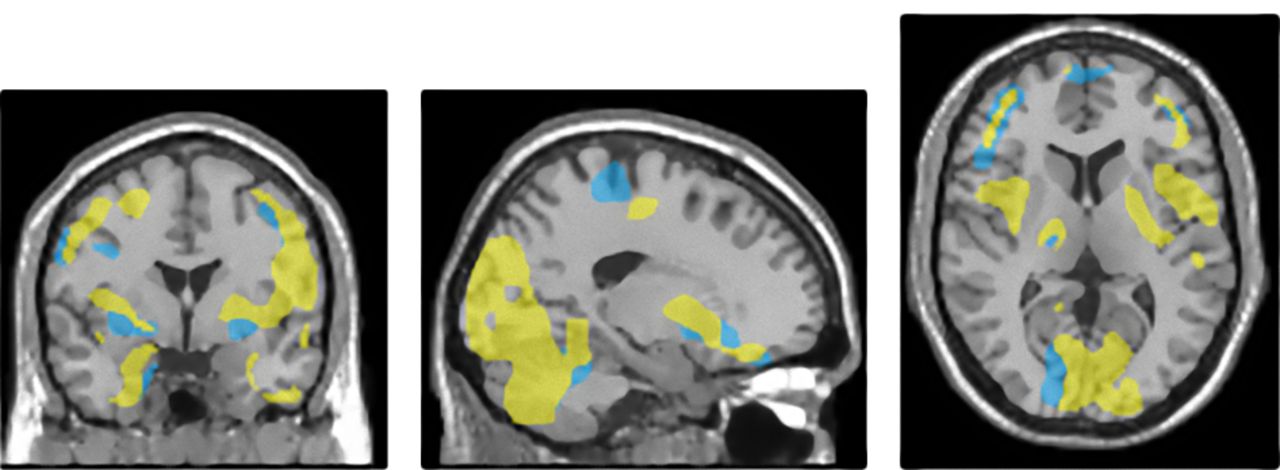
  • FIGURE 6.
    • Download figure
    • Open in new tab
    • Download powerpoint
    FIGURE 6.

    Point-by-point comparison of distribution of results of voxelwise interregional correlation analysis of ROI compensation in HE prodromal AD patient and HE control. Brain regions that significantly correlated with ROI compensation are superimposed on MR scan (yellow in HE prodromal AD patient and blue in HE control).

Tables

  • Figures
  • Additional Files
    • View popup
    TABLE 1

    Patient and Control Characteristics

    CharacteristicHE control (n = 48)LE control (n = 42)HE prodromal AD (n = 28)LE prodromal AD (n = 36)
    Age (y)68.6 ± 6.565.4 ± 5.971.0 ± 8.373.5 ± 8.0
    Sex
     Men25141813
     Women23281023
    Education (y)14.4 ± 2.27.8 ± 1.915.1 ± 2.47.0 ± 1.0
    Follow-up (mo)16.1 ± 18.219.9 ± 17.124.3 ± 18.020.1 ± 14.0
    Baseline MMSE29.4 ± 1.029.1 ± 1.427.2 ± 1.326.9 ± 1.7
    Follow-up MMSE29.1 ± 1.229.0 ± 1.624.1 ± 2.223.9 ± 1.9
    • Data are mean ± SD.

    • View popup
    TABLE 2

    Baseline Neuropsychologic z Scores of Patient Groups

    GroupHE prodromal AD (n = 28)LE prodromal AD (n = 36)P
    Immediate recall−1.83 ± 1.00−1.25 ± 0.99NS
    Delayed recall−2.06 ± 1.07−1.89 ± 0.74NS
    Visuoconstruction−0.53 ± 1.94−0.48 ± 1.76NS
    Verbal fluency−0.16 ± 1.060.47 ± 1.38NS
    Attention−0.51 ± 2.55−0.61 ± 2.01NS
    Executive function−1.35 ± 2.08−1.42 ± 1.10NS
    • NS = not significant.

    • Data are mean ± SD.

    • View popup
    TABLE 3

    Results of 18F-FDG Brain PET Comparison Between HE and LE Prodromal AD Patients, with ROI Compensation

    Peak level
    Cluster levelTalairach coordinates
    AnalysisCluster extentCorrected PCortical regionMaximum z scorexyzCortical regionBA
    LE > HE1,4120.007L occipital4.4−42−74−10Fusiform gyrus19
    L temporal3.69−63−60−2Inferior temporal gyrus37
    L temporal3.25−50−7311Middle temporal gyrus39
    L occipital3.21−46−8110Middle occipital gyrus19
    L occipital3.06−26−841Middle occipital gyrus18
    HE > LE6930.046R frontal3.344835−3Inferior frontal gyrus47
    R frontal3.1550292Inferior frontal gyrus45
    R frontal3.01443820Middle frontal gyrus46
    R frontal2.850328Inferior frontal gyrus46
    R frontal2.77405316Superior frontal gyrus10
    R frontal2.683413−12Inferior frontal gyrus13
    R frontal2.63424916Middle frontal gyrus46
    R frontal2.5309−17Inferior frontal gyrus47
    • P values of <0.001 (uncorrected at voxel level) and <0.05 (FDR-corrected for multiple comparisons at cluster level) were accepted as statistically significant. In cluster level section, reported for each statistically significant cluster are number of voxels, corrected P value, and cortical region where cluster was found. In peak level section, reported for each significant cluster are z score, peak coordinates, corresponding cortical region, and BA.

    • View popup
    TABLE 4

    Results of Interregional Correlation Analysis of ROI Depression in LE and HE Prodromal AD Patients

    Peak level
    Cluster levelTalairach coordinates
    AnalysisCluster extentCorrected PCortical regionMaximum z scorexyzCortical regionBA
    LE7310.045L occipital3.72−48−779Middle occipital gyrus19
    L temporal3.68−57−645Middle temporal gyrus37
    L temporal3.61−42−51−11Fusiform gyrus37
    R occipital3.504−8634Cuneus19
    R occipital3.446−9623Cuneus18
    R occipital3.2220−7433Cuneus7
    HE6780.03L temporal4.32−61−62−5Inferior temporal gyrus37
    L temporal3.88−50−76−3Inferior temporal gyrus19
    L temporal3.64−48−7317Middle temporal gyrus39
    L occipital3.30−44−7626Superior occipital gyrus19
    • P values of <0.001 (uncorrected at voxel level) and <0.05 (FDR-corrected for multiple comparisons at cluster level) were accepted as statistically significant. In cluster level section, reported for each statistically significant cluster are number of voxels, corrected P value, and cortical region where cluster was found. In peak level section, reported for each significant cluster are z score, peak coordinates, corresponding cortical region, and BA.

    • View popup
    TABLE 5

    Results of Interregional Correlation Analysis of ROI Compensation in LE and HE Prodromal AD Patients

    Peak level
    Cluster levelTalairach coordinates
    AnalysisCluster extentCorrected PCortical regionMaximum z scorexyzCortical regionBA
    LE1,2860.026R frontal4.312228−18Middle frontal gyrus11
    R frontal4.233030−15Inferior frontal gyrus47
    R frontal4.121817−11Subcallosal gyrus47
    R frontal4.152286Inferior frontal gyrus45
    R frontal3.97424916Middle frontal gyrus46
    R frontal3.954829−2Inferior frontal gyrus45
    R frontal3.946414Inferior frontal gyrus46
    R frontal3.873831−12Inferior frontal gyrus47
    R limbic3.81834−12Anterior cingulate32
    HE11,3030.0001L frontal17.2−50313Precentral gyrus44
    L occipital16−16−682Lingual gyrus18
    R frontal15.930−1347Middle frontal gyrus6
    R frontal15.636−837Precentral gyrus6
    R frontal14.3221649Superior frontal gyrus8
    L limbic8.84−18−47−4Parahippocampal gyrus19
    L temporal8.22−408−31Superior temporal gyrus38
    L temporal5.61−61−37−8Middle temporal gyrus21
    L temporal5.39−63−24−21Inferior temporal gyrus20
    L parietal5.12−20−4652Precuneus7
    L parietal4.96−18−4736Precuneus31
    R temporal4.9055−21−23Fusiform gyrus20
    R temporal4.8059−11−18Inferior temporal gyrus21
    R frontal4.78105421Superior frontal gyrus9
    R frontal4.4223337Middle frontal gyrus8
    L sublobar3.96−3010−2Claustrum
    R temporal3.784817−13Superior temporal gyrus38
    2,0000.003L cerebellum14.6−36−54−36Cerebellar tonsil
    • P values of <0.001 (uncorrected at voxel level) and <0.05 (FDR-corrected for multiple comparisons at cluster level) were accepted as statistically significant. In cluster level section, reported for each statistically significant cluster are number of voxels, corrected P value, and cortical region where cluster was found. In peak level section, reported for each significant cluster are z score, peak coordinates, corresponding cortical region, and BA.

Additional Files

  • Figures
  • Tables
  • Supplemental Data

    Files in this Data Supplement:

    • Supplemental Data
PreviousNext
Back to top

In this issue

Journal of Nuclear Medicine: 54 (6)
Journal of Nuclear Medicine
Vol. 54, Issue 6
June 1, 2013
  • Table of Contents
  • Table of Contents (PDF)
  • About the Cover
  • Index by author
Print
Download PDF
Article Alerts
Sign In to Email Alerts with your Email Address
Email Article

Thank you for your interest in spreading the word on Journal of Nuclear Medicine.

NOTE: We only request your email address so that the person you are recommending the page to knows that you wanted them to see it, and that it is not junk mail. We do not capture any email address.

Enter multiple addresses on separate lines or separate them with commas.
Metabolic Networks Underlying Cognitive Reserve in Prodromal Alzheimer Disease: A European Alzheimer Disease Consortium Project
(Your Name) has sent you a message from Journal of Nuclear Medicine
(Your Name) thought you would like to see the Journal of Nuclear Medicine web site.
Citation Tools
Metabolic Networks Underlying Cognitive Reserve in Prodromal Alzheimer Disease: A European Alzheimer Disease Consortium Project
Silvia Morbelli, Robert Perneczky, Alexander Drzezga, Giovanni B. Frisoni, Anna Caroli, Bart N.M. van Berckel, Rik Ossenkoppele, Eric Guedj, Mira Didic, Andrea Brugnolo, Mehrdad Naseri, Gianmario Sambuceti, Marco Pagani, Flavio Nobili
Journal of Nuclear Medicine Jun 2013, 54 (6) 894-902; DOI: 10.2967/jnumed.112.113928

Citation Manager Formats

  • BibTeX
  • Bookends
  • EasyBib
  • EndNote (tagged)
  • EndNote 8 (xml)
  • Medlars
  • Mendeley
  • Papers
  • RefWorks Tagged
  • Ref Manager
  • RIS
  • Zotero
Share
Metabolic Networks Underlying Cognitive Reserve in Prodromal Alzheimer Disease: A European Alzheimer Disease Consortium Project
Silvia Morbelli, Robert Perneczky, Alexander Drzezga, Giovanni B. Frisoni, Anna Caroli, Bart N.M. van Berckel, Rik Ossenkoppele, Eric Guedj, Mira Didic, Andrea Brugnolo, Mehrdad Naseri, Gianmario Sambuceti, Marco Pagani, Flavio Nobili
Journal of Nuclear Medicine Jun 2013, 54 (6) 894-902; DOI: 10.2967/jnumed.112.113928
Twitter logo Facebook logo LinkedIn logo Mendeley logo
  • Tweet Widget
  • Facebook Like
  • Google Plus One
Bookmark this article

Jump to section

  • Article
    • Abstract
    • MATERIALS AND METHODS
    • RESULTS
    • DISCUSSION
    • CONCLUSION
    • DISCLOSURE
    • Footnotes
    • REFERENCES
  • Figures & Data
  • Supplemental
  • Info & Metrics
  • PDF

Related Articles

  • This Month in JNM
  • PubMed
  • Google Scholar

Cited By...

  • Enhanced prefrontal nicotinic signaling as evidence of active compensation in Alzheimers disease models
  • Amyloid PET in Dementia Syndromes: A Chinese Multicenter Study
  • Left frontal cortex connectivity underlies cognitive reserve in prodromal Alzheimer disease
  • The impact of bilingualism on brain reserve and metabolic connectivity in Alzheimer's dementia
  • Interaction between years of education and APOE {varepsilon}4 status on frontal and temporal metabolism
  • Brain fluorodeoxyglucose PET in adrenoleukodystrophy
  • Google Scholar

More in this TOC Section

  • Feasibility of Ultra-Low-Activity 18F-FDG PET/CT Imaging Using a Long–Axial-Field-of-View PET/CT System
  • Cardiac Presynaptic Sympathetic Nervous Function Evaluated by Cardiac PET in Patients with Chronotropic Incompetence Without Heart Failure
  • Validation and Evaluation of a Vendor-Provided Head Motion Correction Algorithm on the uMI Panorama PET/CT System
Show more Clinical Investigations

Similar Articles

Keywords

  • Alzheimer’s disease
  • Mild cognitive impairment
  • cognitive reserve
  • Positron Emission Tomography
  • metabolic connectivity
SNMMI

© 2025 SNMMI

Powered by HighWire