
Main menu

  • Home
  • Content
    • Current
    • Ahead of print
    • Past Issues
    • JNM Supplement
    • SNMMI Annual Meeting Abstracts
    • Continuing Education
    • JNM Podcasts
  • Subscriptions
    • Subscribers
    • Institutional and Non-member
    • Rates
    • Journal Claims
    • Corporate & Special Sales
  • Authors
    • Submit to JNM
    • Information for Authors
    • Assignment of Copyright
    • AQARA requirements
  • Info
    • Reviewers
    • Permissions
    • Advertisers
  • About
    • About Us
    • Editorial Board
    • Contact Information
  • More
    • Alerts
    • Feedback
    • Help
    • SNMMI Journals
  • SNMMI
    • JNM
    • JNMT
    • SNMMI Journals
    • SNMMI

User menu

  • Subscribe
  • My alerts
  • Log in
  • My Cart

Search

  • Advanced search
Journal of Nuclear Medicine
  • SNMMI
    • JNM
    • JNMT
    • SNMMI Journals
    • SNMMI
  • Subscribe
  • My alerts
  • Log in
  • My Cart
Journal of Nuclear Medicine

Advanced Search

  • Home
  • Content
    • Current
    • Ahead of print
    • Past Issues
    • JNM Supplement
    • SNMMI Annual Meeting Abstracts
    • Continuing Education
    • JNM Podcasts
  • Subscriptions
    • Subscribers
    • Institutional and Non-member
    • Rates
    • Journal Claims
    • Corporate & Special Sales
  • Authors
    • Submit to JNM
    • Information for Authors
    • Assignment of Copyright
    • AQARA requirements
  • Info
    • Reviewers
    • Permissions
    • Advertisers
  • About
    • About Us
    • Editorial Board
    • Contact Information
  • More
    • Alerts
    • Feedback
    • Help
    • SNMMI Journals
  • View or Listen to JNM Podcast
  • Visit JNM on Facebook
  • Join JNM on LinkedIn
  • Follow JNM on Twitter
  • Subscribe to our RSS feeds
Research ArticleBasic Science Investigations

Brain Glucose Transport and Phosphorylation Under Acute Insulin-Induced Hypoglycemia in Mice: An 18F-FDG PET Study

Malte F. Alf, João M.N. Duarte, Roger Schibli, Rolf Gruetter and Stefanie D. Krämer
Journal of Nuclear Medicine December 2013, 54 (12) 2153-2160; DOI: https://doi.org/10.2967/jnumed.113.122812
Malte F. Alf
1Department of Chemistry and Applied Biosciences, Center for Radiopharmaceutical Sciences of ETH-PSI-USZ, Institute of Pharmaceutical Sciences, ETH Zurich, Zurich, Switzerland
2Laboratory of Functional and Metabolic Imaging, Institute of Physics of Biological Systems, Ecole Polytechnique Fédérale de Lausanne, Lausanne, Switzerland
  • Find this author on Google Scholar
  • Find this author on PubMed
  • Search for this author on this site
João M.N. Duarte
2Laboratory of Functional and Metabolic Imaging, Institute of Physics of Biological Systems, Ecole Polytechnique Fédérale de Lausanne, Lausanne, Switzerland
3Department of Radiology, University of Lausanne, Lausanne, Switzerland; and
  • Find this author on Google Scholar
  • Find this author on PubMed
  • Search for this author on this site
Roger Schibli
1Department of Chemistry and Applied Biosciences, Center for Radiopharmaceutical Sciences of ETH-PSI-USZ, Institute of Pharmaceutical Sciences, ETH Zurich, Zurich, Switzerland
  • Find this author on Google Scholar
  • Find this author on PubMed
  • Search for this author on this site
Rolf Gruetter
2Laboratory of Functional and Metabolic Imaging, Institute of Physics of Biological Systems, Ecole Polytechnique Fédérale de Lausanne, Lausanne, Switzerland
3Department of Radiology, University of Lausanne, Lausanne, Switzerland; and
4Department of Radiology, University of Geneva, Geneva, Switzerland
  • Find this author on Google Scholar
  • Find this author on PubMed
  • Search for this author on this site
Stefanie D. Krämer
1Department of Chemistry and Applied Biosciences, Center for Radiopharmaceutical Sciences of ETH-PSI-USZ, Institute of Pharmaceutical Sciences, ETH Zurich, Zurich, Switzerland
  • Find this author on Google Scholar
  • Find this author on PubMed
  • Search for this author on this site
  • Article
  • Figures & Data
  • Supplemental
  • Info & Metrics
  • PDF
Loading

Article Figures & Data

Figures

  • Tables
  • Additional Files
  • FIGURE 1.
    • Download figure
    • Open in new tab
    • Download powerpoint
    FIGURE 1.

    Brain time–activity curves and arterial input functions in representative normoglycemic mouse (norm, Gp 6.7 mmol/L) and hypoglycemic mouse (hypo, Gp 2.1 mmol/L).

  • FIGURE 2.
    • Download figure
    • Open in new tab
    • Download powerpoint
    FIGURE 2.

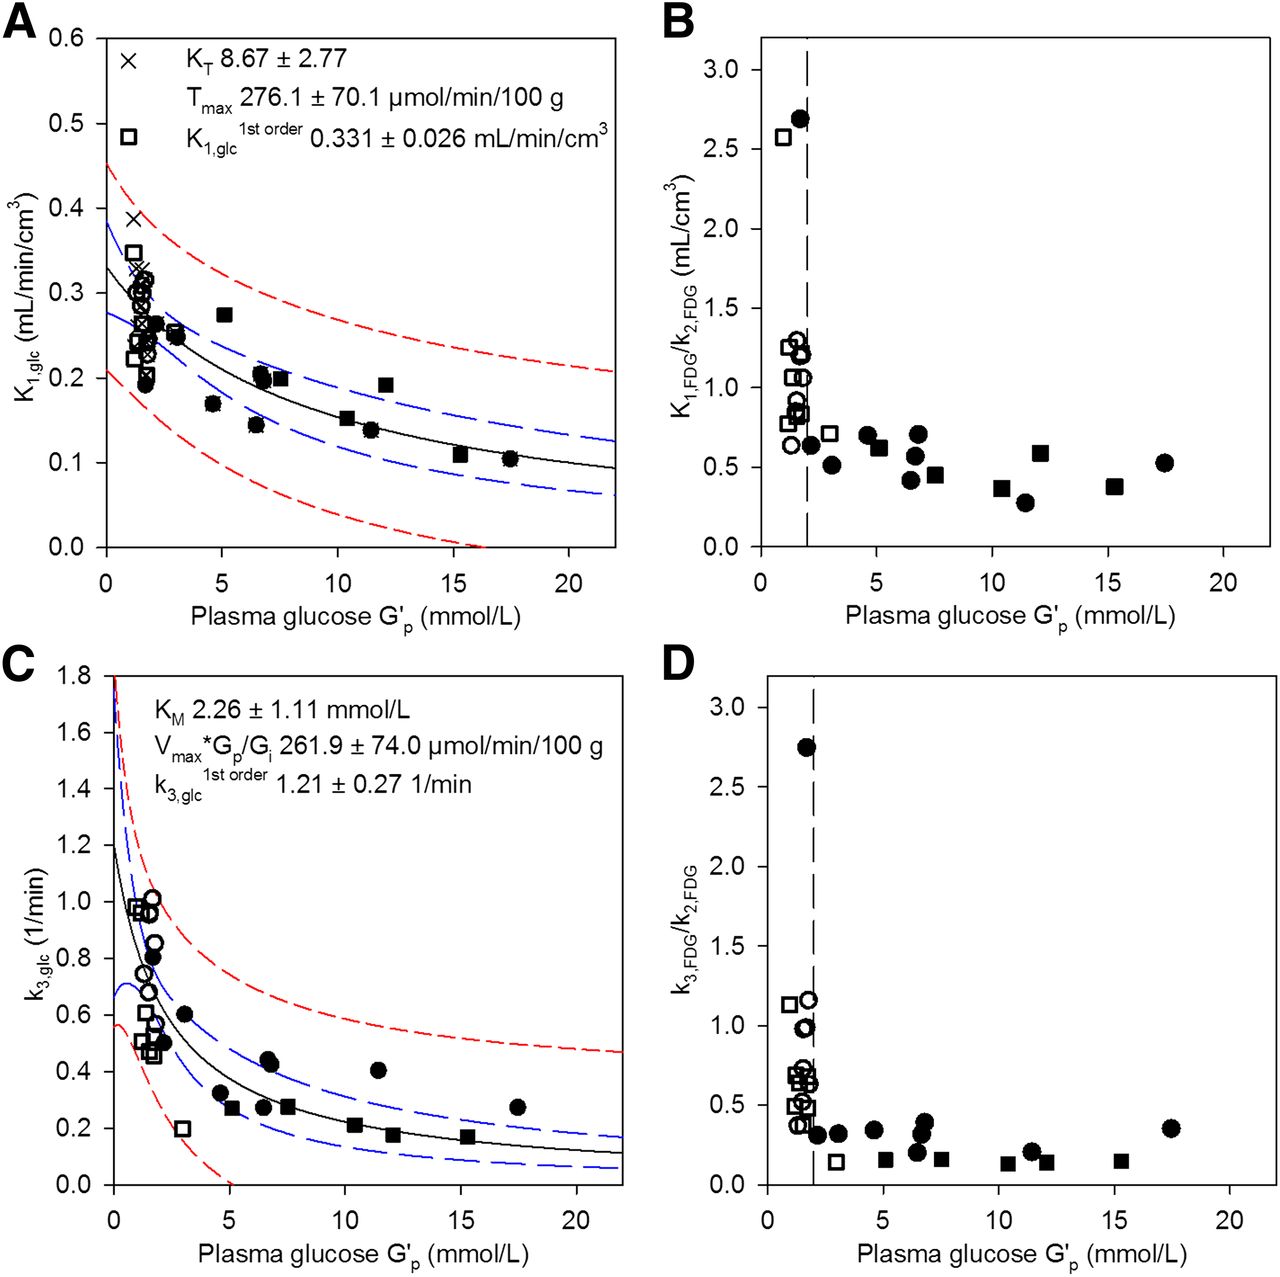
    (A) Glucose clearance K1,glc from plasma to brain increases with decreasing Gp. K1,glc at Gp of less than 2 mmol/L was normalized for CBF. (B) 18F-FDG partitioning at BBB (K1,FDG/k2,FDG) with sharp increase below G′p 2 mmol/L (dashed line). (C) k3,glc sharply increased at G′p of less than 2 mmol/L. (D) Intracellular balance between 18F-FDG phosphorylation and efflux (k3,FDG/k2,FDG). Open symbols = insulin-treated; closed symbols = untreated; squares = 57BL/6 mice; circles = CD1 mice; crosses = not corrected for CBF increase (Supplemental Fig. 3); solid black line = fit with Equation 6 (fit parameters in graph); dashed blue lines = 95% confidence band; dashed red lines = 95% prediction band. R2 = 0.553 (A), 0.616 (C).

  • FIGURE 3.
    • Download figure
    • Open in new tab
    • Download powerpoint
    FIGURE 3.

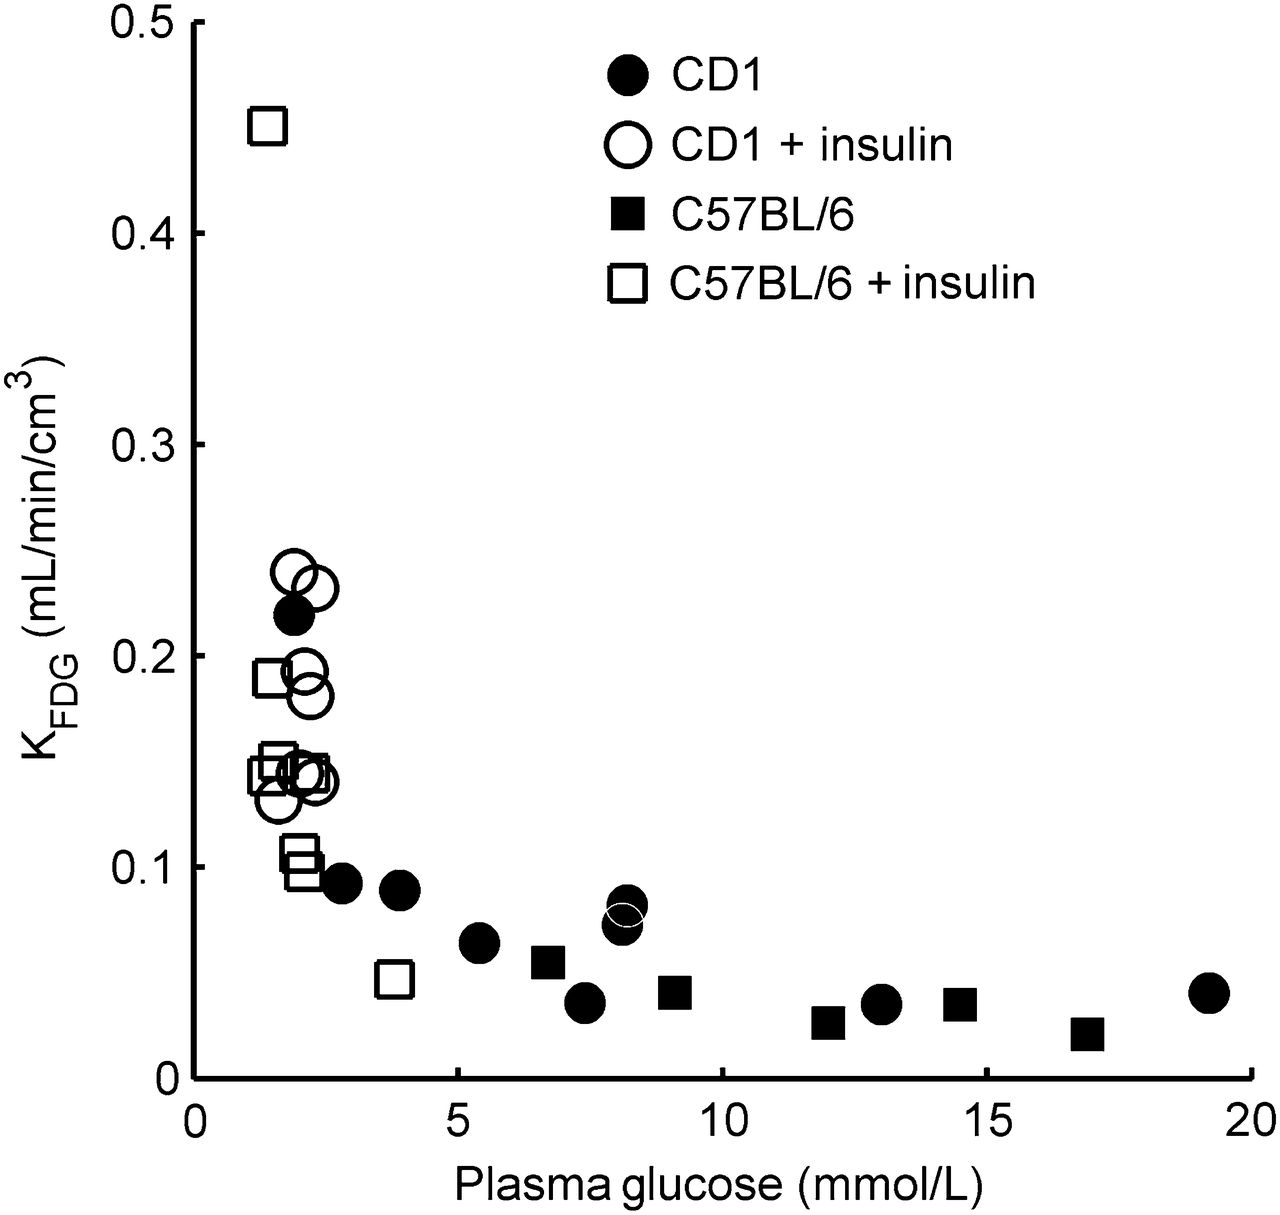
    KFDG shows clear dependence on Gp.
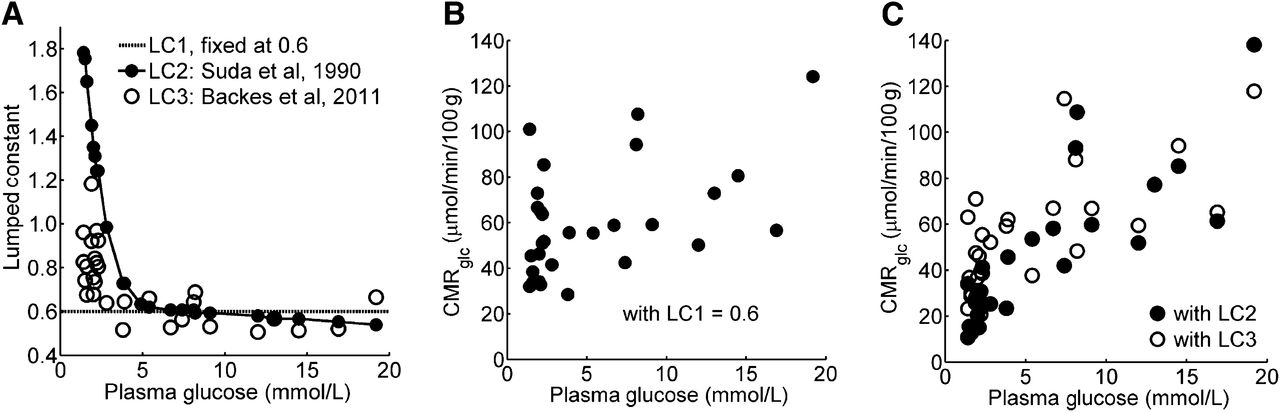
  • FIGURE 4.
    • Download figure
    • Open in new tab
    • Download powerpoint
    FIGURE 4.

    (A) LC determined with different methods: constant value of 0.6 (LC1) (26,27); estimated from rat data (LC2) (13); and estimated from L1, L2, and L3 (LC3) (28). (B) CMRglc estimated with constant LC 0.6. (C) CMRglc dependence on Gp if calculated with Gp-dependent LC (LC2, LC3).

  • FIGURE 5.
    • Download figure
    • Open in new tab
    • Download powerpoint
    FIGURE 5.

    Influence of Gp on K1,glc in cortex (A), striatum (B), cerebellum (C), and hypothalamus (D). Lines as in Figure 2A. Values at Gp of less than 2.0 mmol/L were corrected for expected increase in CBF by 57%. Hippocampus and thalamus, as well as Tglc vs. G′p, are presented in Supplemental Figures 12 and 13. R2 = 0.524 (A), 0.589 (B), 0.399 (C), and 0.289 (D). Solid black line = fit with Equation 6 (fit parameters in graph); dashed blue lines = 95% confidence band; dashed red lines = 95% prediction band.

  • FIGURE 6.
    • Download figure
    • Open in new tab
    • Download powerpoint
    FIGURE 6.

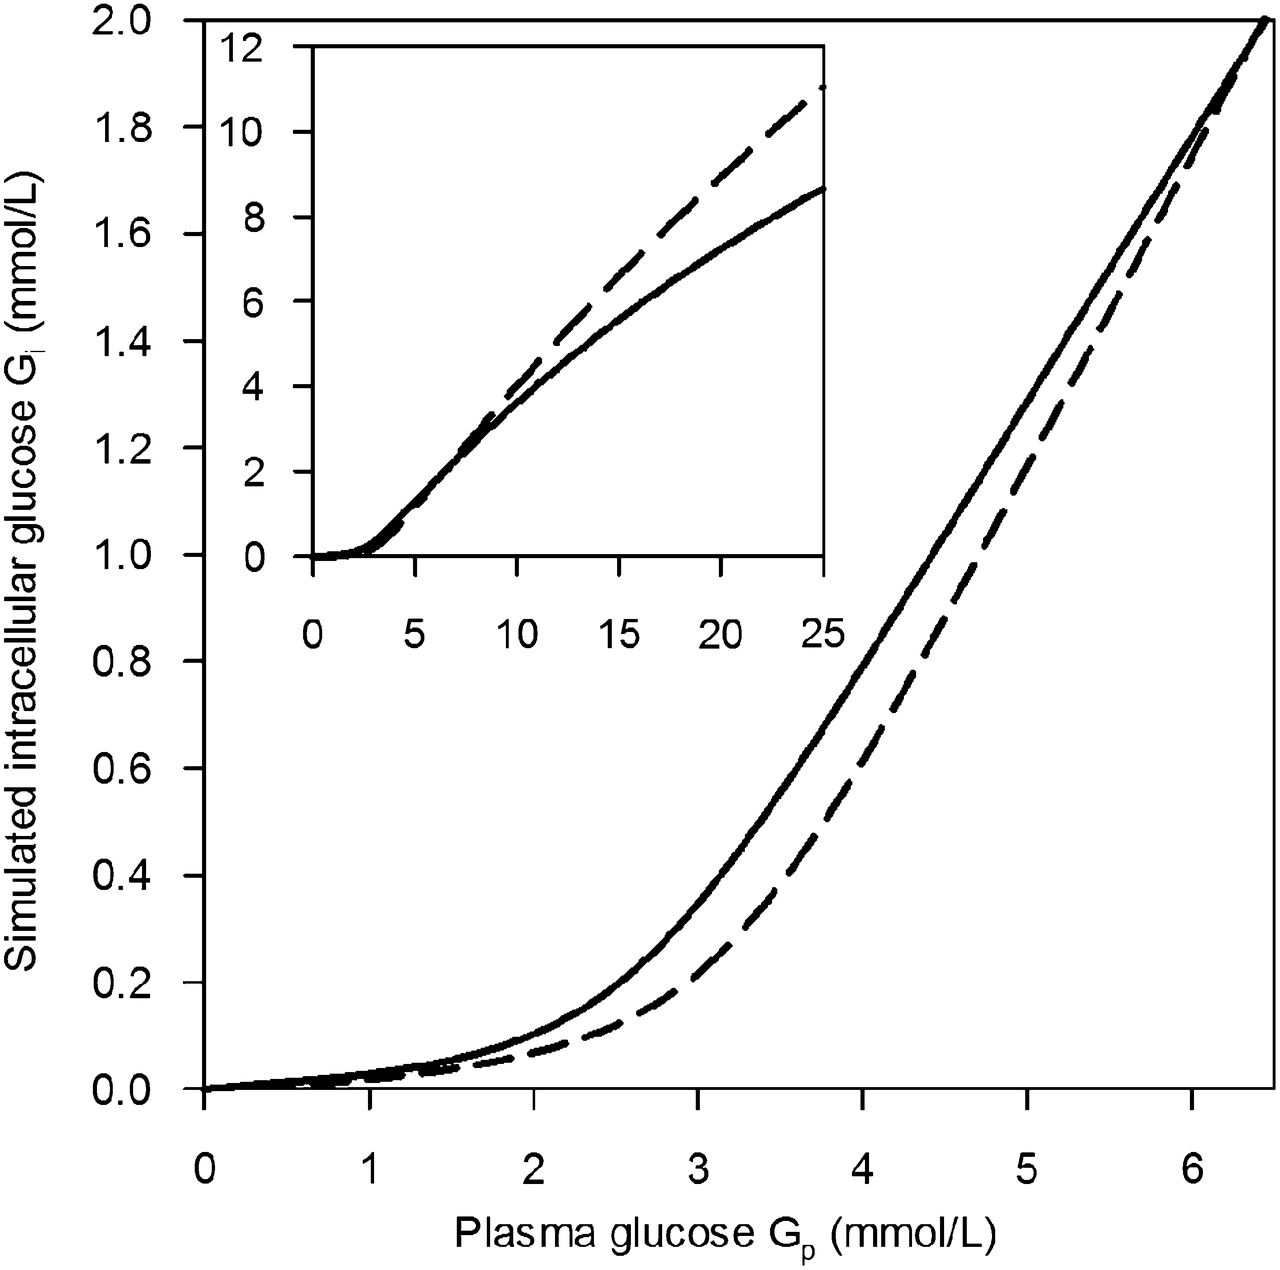
    Intracellular glucose concentrations of cerebrum (solid line) and hypothalamus (dashed line) simulated as functions of Gp from fit parameters for transport and phosphorylation. Inset shows extended Gp range.

Tables

  • Figures
  • Additional Files
    • View popup
    TABLE 1.

    CMRglc (μmol/min/100 g) Grouped by Gp, Estimated with Different LC

    LCCTXSTRHIPTHAHYPCBCER
    LC1 = 0.6 (26)
    Gp > 2.5 mmol/L56 ± 2962 ± 2565 ± 2766 ± 2955 ± 1971 ± 2866 ± 27
    Gp < 2.5 mmol/L48 ± 1656 ± 2054 ± 1755 ± 2243 ± 1655 ± 1655 ± 21
    LC2 (13)
    Gp > 2.5 mmol/L56 ± 3462 ± 3065 ± 3265 ± 3554 ± 2371 ± 3366 ± 32
    Gp < 2.5 mmol/L20 ± 7*23 ± 9*23 ± 9*23 ± 9*18 ± 7*23 ± 9*26 ± 17*
    LC3 (28)
    Gp > 2.5 mmol/L58 ± 2861 ± 2463 ± 2466 ± 2957 ± 2370 ± 3067 ± 23
    Gp < 2.5 mmol/L33 ± 7*37 ± 9*37 ± 9*38 ± 10*30 ± 8*37 ± 9*38 ± 11*
    • ↵* P < 0.003, all t > 3.34 compared with situation with Gp < 2.5 mmol/L.

    • CTX = cortex; STR = striatum; HIP = hippocampus; THA = thalamus; HYP = hypothalamus; CB = cerebellum; CER = cerebrum.

    • View popup
    TABLE 2.

    Post Hoc Tests of Repeated-Measures Variance Analysis

    HYP minus averageCTX minus average
    GpK1,FDGKFDGK1,FDGKFDG
    >2.5 mmol/L−0.017 ± 0.046−0.007 ± 0.008−0.007 ± 0.017−0.009 ± 0.008
    <2.5 mmol/L−0.063 ± 0.060*−0.035 ± 0.015†−0.047 ± 0.067*−0.028 ± 0.015†
    • ↵* P < 0.05.

    • ↵† P < 0.0002.

    • Data are mL/min/cm3. Interaction of region × Gp was further explored with post hoc t tests. Compared with average of other brain structures, hypoglycemia led to significantly smaller increase in K1,FDG and KFDG in hypothalamus (HYP) and cortex (CTX).

Additional Files

  • Figures
  • Tables
  • Supplemental Data

    Files in this Data Supplement:

    • Supplemental Data
PreviousNext
Back to top

In this issue

Journal of Nuclear Medicine: 54 (12)
Journal of Nuclear Medicine
Vol. 54, Issue 12
December 1, 2013
  • Table of Contents
  • Table of Contents (PDF)
  • About the Cover
  • Index by author
Print
Download PDF
Article Alerts
Sign In to Email Alerts with your Email Address
Email Article

Thank you for your interest in spreading the word on Journal of Nuclear Medicine.

NOTE: We only request your email address so that the person you are recommending the page to knows that you wanted them to see it, and that it is not junk mail. We do not capture any email address.

Enter multiple addresses on separate lines or separate them with commas.
Brain Glucose Transport and Phosphorylation Under Acute Insulin-Induced Hypoglycemia in Mice: An 18F-FDG PET Study
(Your Name) has sent you a message from Journal of Nuclear Medicine
(Your Name) thought you would like to see the Journal of Nuclear Medicine web site.
Citation Tools
Brain Glucose Transport and Phosphorylation Under Acute Insulin-Induced Hypoglycemia in Mice: An 18F-FDG PET Study
Malte F. Alf, João M.N. Duarte, Roger Schibli, Rolf Gruetter, Stefanie D. Krämer
Journal of Nuclear Medicine Dec 2013, 54 (12) 2153-2160; DOI: 10.2967/jnumed.113.122812

Citation Manager Formats

  • BibTeX
  • Bookends
  • EasyBib
  • EndNote (tagged)
  • EndNote 8 (xml)
  • Medlars
  • Mendeley
  • Papers
  • RefWorks Tagged
  • Ref Manager
  • RIS
  • Zotero
Share
Brain Glucose Transport and Phosphorylation Under Acute Insulin-Induced Hypoglycemia in Mice: An 18F-FDG PET Study
Malte F. Alf, João M.N. Duarte, Roger Schibli, Rolf Gruetter, Stefanie D. Krämer
Journal of Nuclear Medicine Dec 2013, 54 (12) 2153-2160; DOI: 10.2967/jnumed.113.122812
Twitter logo Facebook logo LinkedIn logo Mendeley logo
  • Tweet Widget
  • Facebook Like
  • Google Plus One
Bookmark this article

Jump to section

  • Article
    • Abstract
    • MATERIALS AND METHODS
    • RESULTS
    • DISCUSSION
    • CONCLUSION
    • DISCLOSURE
    • Acknowledgments
    • Footnotes
    • REFERENCES
  • Figures & Data
  • Supplemental
  • Info & Metrics
  • PDF

Related Articles

  • This Month in JNM
  • PubMed
  • Google Scholar

Cited By...

  • No citing articles found.
  • Google Scholar

More in this TOC Section

  • Tumor Uptake of Anti-CD20 Fabs Depends on Tumor Perfusion
  • How Sensitive Is the Upper Gastrointestinal Tract to 90Y Radioembolization? A Histologic and Dosimetric Analysis in a Porcine Model
  • 11C-Methionine PET of Myocardial Inflammation in a Rat Model of Experimental Autoimmune Myocarditis
Show more Basic Science Investigations

Similar Articles

Keywords

  • brain glucose metabolism
  • hypoglycemia
  • Michaelis–Menten kinetics
  • positron-emission tomography
SNMMI

© 2025 SNMMI

Powered by HighWire