


Abstract
Spinocerebellar ataxia type 17 (SCA17) is a rare autosomal dominantly inherited neurodegenerative disorder presenting with a variable phenotype including ataxia, dystonia, chorea, and parkinsonism, as well as cognitive impairment. We evaluated morphologic and functional imaging characteristics to elucidate evidence of neurodegeneration in SCA17, even in the presymptomatic stage of the disease. Methods: Nine individuals of 3 large SCA17 pedigrees, including 4 presymptomatic mutation carriers, underwent cranial 3-dimensional MRI volumetry, as well as multitracer PET with 18F-FDG, 11C-d-threo-methylphenidate, and 11C-raclopride. Healthy subjects showing no signs of a neurologic or psychiatric disease served as controls. Results: MRI volumetry revealed atrophy of the cerebellum and caudate nucleus in manifesting patients (P = 0.04 and 0.05, respectively) and in presymptomatic mutation carriers (P = 0.04 and 0.01, respectively). PET demonstrated decreased glucose metabolism in the striatum, as well as in the cuneus, cingulum, and parietal lobe, in all SCA17 patients and presymptomatic mutation carriers. In addition, PET was closely correlated with motor performance as assessed by the Scale for the Assessment and Rating of Ataxia (P = 0.037) and Unified Parkinson Disease Rating Scale (P = 0.05) and with cognitive function as assessed by the Mini-Mental Status Examination (P = 0.037). Furthermore, 11C-raclopride PET showed impairment of the postsynaptic dopaminergic compartment of the putamen and caudate nucleus not only in manifest SCA17 patients (P = 0.04 and 0.008, respectively) but also in yet-unaffected mutation carriers (P = 0.05 and 0.05, respectively). The degree of postsynaptic dopaminergic dysfunction was associated with impairment of motor performance. In contrast, significant presynaptic dopaminergic deficits assessed with 11C-d-threo-methylphenidate PET were not detected. Conclusion: MRI volumetry, as well as 11C-raclopride and 18F-FDG PET, reveal neuronal dysfunction and neurodegeneration even in the presymptomatic stage and may serve as markers for disease activity in upcoming interventional trials on SCA17.
Spinocerebellar ataxia type 17 (SCA17) is a rare autosomal dominantly inherited ataxia caused by the expansion of a CAG trinucleotide repeat from normally 25–41 CAG motifs to 42 or more CAG motifs in the TBP gene coding for the general transcription initiation factor tumor-associated transplantation antigen–binding protein (1,2).
Clinically, SCA17 is characterized by cerebellar, extrapyramidal, neuropsychiatric, and cognitive impairment presenting with a huge phenotypic variability even within families (3–7). Whereas in some patients the disease starts with gait difficulties due to ataxia, in other patients disorientation, dementia, or psychosis mark the onset of disease (3). Extrapyramidal symptoms include dystonia, chorea, and rarely parkinsonism (7,8).
Consistent with this broad phenotypical spectrum, morphologic in vivo imaging shows a multisystemic pattern of atrophy including the gray matter of cerebellar, occipitoparietal, and basal ganglia structures in terms of motor dysfunction, as well as frontal, temporal, and limbic components as correlates for neuropsychiatric and cognitive impairment (9). Accordingly, autopsy studies have revealed not only cerebellar degeneration but also cell loss and gliosis of the basal ganglia and cortex (1,3,10,11). Degeneration of the substantia nigra is much milder in SCA17 than in other SCA subtypes, especially SCA2 and SCA3 (3,12).
Monogenetic diseases such as SCA17 offer the chance to identify individuals at risk by genetic tests in the presymptomatic state. This ability may be a major advantage when new therapeutic approaches become available that, when administered early, modify disease progression and the onset of symptoms. In this setting, sensitive and specific markers proving the onset of the neurodegenerative process and measuring disease progression are crucial prerequisites to evaluate putative therapeutic effects. Such markers should reflect major pathologic features, be easily detectable, and allow for a serial examination in an individual. Neuroimaging modalities such as MRI and PET are potential tools for repetitive analyses of the brain in vivo and may reveal morphologic and functional characteristics reflecting ongoing neurodegeneration.
To analyze the multisystemic neurodegenerative processes underlying ataxia, extrapyramidal symptoms, and cognitive decline and to search for progression markers in SCA17, we performed a multimodal imaging approach including 3-dimensional MRI for volumetry calculation and PET of glucose metabolism and of the pre- and postsynaptic dopaminergic system. To elucidate the onset of neuronal dysfunction and neurodegeneration, we included presymptomatic mutation carriers in addition to patients with manifest SCA17.
MATERIALS AND METHODS
Nine individuals of 3 large unrelated SCA17 pedigrees from Northern Germany were included in this study. Five individuals presented with manifest symptoms of SCA17, and 4 individuals carried mutations but were clinically presymptomatic (Table 1).
Clinical and Genetic Findings in Patients with Manifest SCA17 and Presymptomatic Mutation Carriers
The severity of ataxia was assessed using the Scale for the Assessment and Rating of Ataxia (SARA) (13). Extrapyramidal symptoms were rated by the motor part of the Unified Parkinson Disease Rating Scale (UPDRS III) (14). Dystonia and chorea were assessed qualitatively by a movement disorders specialist. Manifest dementia was tested by the Mini-Mental Status Examination (MMSE) (15).
Four individuals were categorized as presymptomatic mutation carriers because of abnormal gene tests but lacked SCA17-related complaints in a structured interview and had normal values on SARA (≤1.5 points), UPDRS III (≤3 points), and MMSE (>26 points).
Age- and sex-matched healthy individuals served as controls for 11C-d-threo-methylphenidate (11C-dMP), 11C-raclopride, and 18F-FDG PET. Healthy controls for MRI analysis were matched for sex but were older than the SCA17 cohort (Table 2).
MRI Volumetry in SCA17
All study participants gave their written informed consent. The study was approved by the Ethics Committee of the Faculty of Medicine at the University of Tübingen.
MRI and PET data acquisition and analysis were performed with masking of the mutational status.
MRI
For MRI volumetry, a sagittally oriented 3-dimensional T1-weighted magnetization-prepared rapid gradient echo sequence was acquired (repetition time, 1,300 ms; echo time, 2,74 ms; inversion time, 660 ms; Sonata [Siemens]) with a matrix size of 256 × 256, yielding isotropic voxels of 1 × 1 × 1 mm. Cerebral volumetry was applied according to a validated protocol applying presegmentation based on predefined anatomic landmarks and automated region-growing segmentation (16–18).
PET Acquisition, Image Reconstruction, and Normalization
The patient’s head was fixed in an elastic mold with adhesive tape. For 11C-dMP and 11C-raclopride PET, 3 fiducial markers were attached to the skull to support correction of head movements. After intravenous bolus injection (12 s) of 700 MBq of 11C-dMP or 700 MBq of 11C-raclopride, dynamic data were acquired 0–60 min after injection in 2-dimensional mode with a full-ring PET scanner (Advance; GE Healthcare). For 18F-FDG PET, patients lay at rest in a dark and quiet room with eyes closed from 10 min before until 20 min after intravenous injection of 370 MBq of 18F-FDG. Starting 40 min after 18F-FDG injection, 3 datasets were acquired (4 min each). At the end of each scan (11C-dMP, 11C-raclopride, or 18F-FDG), a transmission scan with 500,000 kilocounts was performed for attenuation correction.
All images were reconstructed with filtered backprojection (128 × 128 pixels corresponding to 30 × 30 cm, Hanning filter with 4.6-mm cutoff). The statistical parametric mapping (SPM) software package SPM2 (Wellcome Trust Centre for Neuroimaging) was used for realignment and spatial normalization by comparing summation images 0–5 min after injection (11C-dMP and 11C-raclopride) or 40–52 min after injection (18F-FDG) with the standard SPM perfusion template.
Region-of-Interest (ROI) Analysis
For ROI analysis, a locally established set of 3-dimensional ROIs (dorsal putamen, 2 × 0.67 mL; caudate, 2 × 0.40 mL; occipital cortex as reference region) was applied to each frame after spatial normalization. Using early (11C-dMP and 11C-raclopride) and late summation images (11C-dMP, 11C-raclopride, and 18F-FDG) on which ROI outlines were projected, we carefully checked the position of each ROI and, optionally, adjusted it manually (shifted by 1 or 2 pixels in each dimension). To quantify specific binding of 11C-dMP and 11C-raclopride in the striatum, we derived time–activity curves from the ROI. Nondisplaceable binding potential (19) was quantified using Logan graphical analysis (11C-dMP; regression interval, 18–60 min; reference tissue, occipital cortex, clearance rate constant (k2′) = 0.05 min−1 (20)) and the simplified reference tissue model (11C-raclopride) (21).
For quantification of 18F-FDG uptake, the average radioactivity concentration in the ROI was divided by the average uptake in the cortex derived from a large 3-dimensional ROI locally established at the PET center. This ROI encompasses virtually all cortical gray matter and was derived from normalized and averaged 18F-FDG scans, on which isocontours at 65% of maximum uptake were generated. Cerebellum and subcortical regions were excluded manually.
Voxelwise Statistical Analysis of 18F-FDG PET
For voxelwise statistical analysis of 18F-FDG PET with SPM2, normalized 18F-FDG PET images were summed over time to obtain the radioactivity distribution 40–52 min after injection and smoothed (12-mm gaussian kernel). We initially calculated a voxelwise test between symptomatic SCA17 and age-matched controls using a voxel-level threshold of P < 0.001 (T = 3.93). All clusters with PFDR < 0.05 were considered significant. To depict a quantitative color scale (difference in 18F-FDG uptake) rather than a statistical measure and to improve spatial resolution, we combined SPM’s t-map and contrast image using the SPM toolbox Masked Contrast Images (22).
To obtain a single metabolic index from each PET scan to quantify the overall degree of disease-related metabolic deterioration, we used a concept known as metabolic ratio (23,24). Here, we generated the mask of affected regions by combining all clusters of significant hypometabolism detected with SPM. The average uptake in this mask was divided by the average uptake in remaining cortical gray matter (large cortical ROI, excluding SPM clusters).
Statistics
Because of the small numbers of subjects, nonparametric testing was performed. To compare PET and MRI data from symptomatic and asymptomatic SCA17 mutation carriers with those from the respective controls, the Mann–Whitney U test was used. Because the controls for MRI analysis were older than the SCA17 patients and the presymptomatic mutation carriers, the analysis of MRI data was corrected for age.
To evaluate relationships between clinical and imaging variables, we used regression analysis according to Spearman.
RESULTS
Clinical Findings
In symptomatic patients, SARA ranged from 1.5 to 25 and UPDRS III ranged from 3 to 34. One patient (Symp-2) had dystonia of the upper limbs and myoclonus of the feet on the right side as the only significant findings. No patient presented with rigidity, tremor, or akinesia. Cognitive testing revealed dementia in 4 of 5 patients. Table 1 shows details. Close correlations with disease duration were observed for SARA (Spearman ρ (rs) = 0.900; P < 0.02), UPDRS III (rs = 0.821; P = 0.04), and MMSE (rs = −0.900; P < 0.02).
In presymptomatic carriers, SARA was 1.5 or less, UPDRS III was 3 or less, and cognitive test results were normal.
MRI Volumetry
Decreased volume of the caudate nucleus was evident in SCA17 patients and in presymptomatic mutation carriers and showed a close correlation with disease duration in patients (rs = −1.00; P = 0.001). Additionally, the cerebellum showed reduced volume not only in manifest patients (total cerebellum, left hemisphere, and vermis) but even in presymptomatic mutation carriers (left hemisphere) (Table 2). The degree of volume reduction correlated with disease duration in affected patients (rs = −1.00; P = 0.001).
No manifest atrophy was found in SCA17 concerning the frontal, temporal, parietal, or occipital lobes (Table 2).
PET
11C-dMP PET
Dopamine transporter levels (11C-dMP binding potential) of the caudate nucleus and putamen were reduced in SCA17 patients (caudate, P = 0.06; putamen, P = 0.29) and presymptomatic mutation carriers (caudate, P = 0.09; putamen, P = 0.14), compared with the respective controls, but the differences lacked significance (Table 3).
PET Results
11C-Raclopride PET
Both the caudate nucleus and the putamen showed distinctly reduced D2 receptor levels (11C-raclopride binding potential) in manifest patients (caudate, P = 0.008; putamen, P = 0.04) and presymptomatic mutation carriers (caudate, P = 0.05; putamen, P = 0.05), compared with the respective controls (Fig. 1; Table 3). Among the 5 patients with manifest SCA17, D2 levels correlated negatively with disease duration (caudate, rs = −0.90, P = 0.02) and were associated with motor performance as assessed by UPDRS III and SARA (Fig. 1).
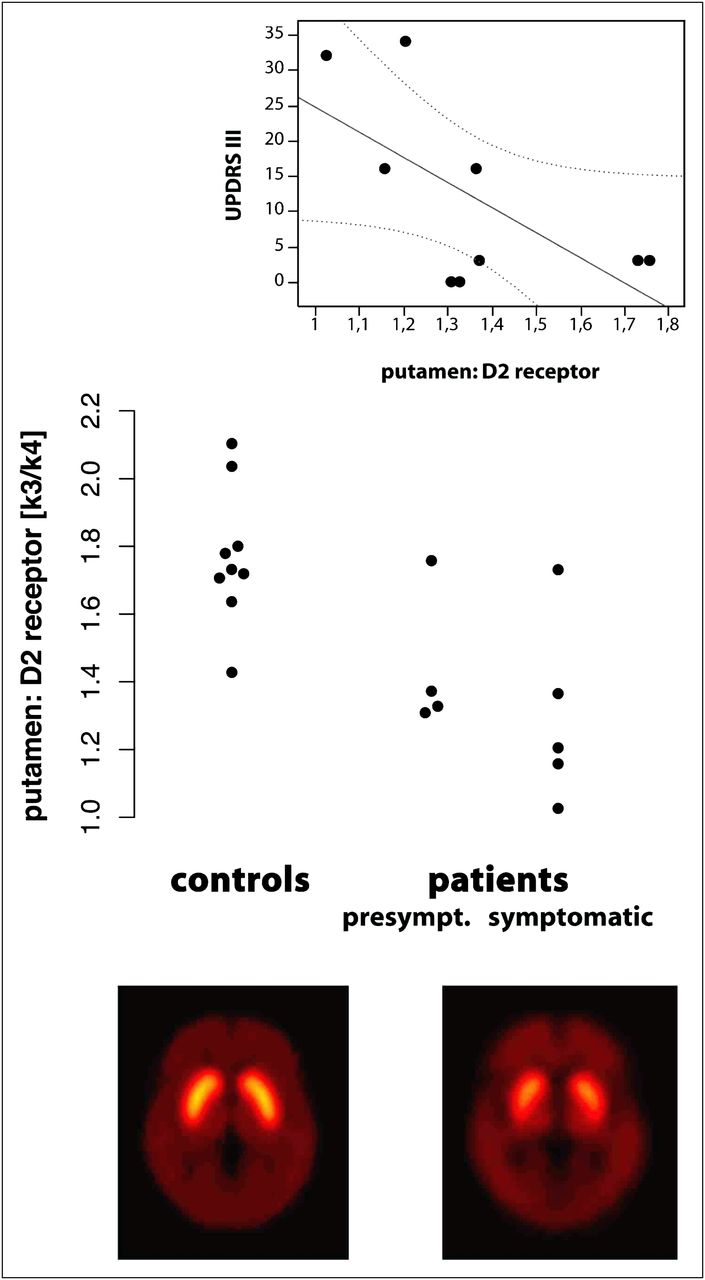
11C-raclopride PET in SCA17 and matched controls. (Bottom) Reduced dopamine D2 receptor levels in putamen and caudate of symptomatic SCA17 patients (voxelwise group mean of 11C-raclopride binding potential). (Middle) Three of 4 presymptomatic SCA17 patients already show reduced D2 levels. (Top) D2 levels in putamen correlate with motor disability assessed by UPDRS III (r = −0.74; P = 0.02).
18F-FDG PET
ROI analysis showed reduced glucose metabolism (18F-FDG uptake) in the caudate nucleus and putamen of manifest SCA17 patients (caudate, P = 0.009; putamen, P = 0.08,) and in presymptomatic mutation carriers (caudate, P = 0.08; putamen, P = 0.02), compared with the respective controls (Table 3).
SPM analysis revealed additional reductions in glucose metabolism in the cuneate and precuneate region and adjacent parts of the cingulum, as well as in the parietal cortex (Fig. 2). On inspection of the individual and group mean images, we concluded that a slightly broadened interhemispheric cleft contributed to the apparent hypometabolism in the cuneate and precuneate region. Because SPM analysis was initially restricted to the group of symptomatic patients, we were able to calculate an a priori statistical analysis to investigate whether these changes were already present in presymptomatic individuals. Indeed, presymptomatic carriers showed a significantly reduced metabolic index as compared with controls (1.00 vs. 1.06, P = 0.04; Table 3). Because all symptomatic patients received the same weight in the initial SPM analysis, it was possible to use the metabolic index for an unbiased correlation analysis, which revealed a correlation between the metabolic index in symptomatic patients and MMSE (rs = 0.90, P = 0.037), SARA (rs = −0.90, P = 0.037), and UPDRS III (rs = −0.87, P = 0.05).
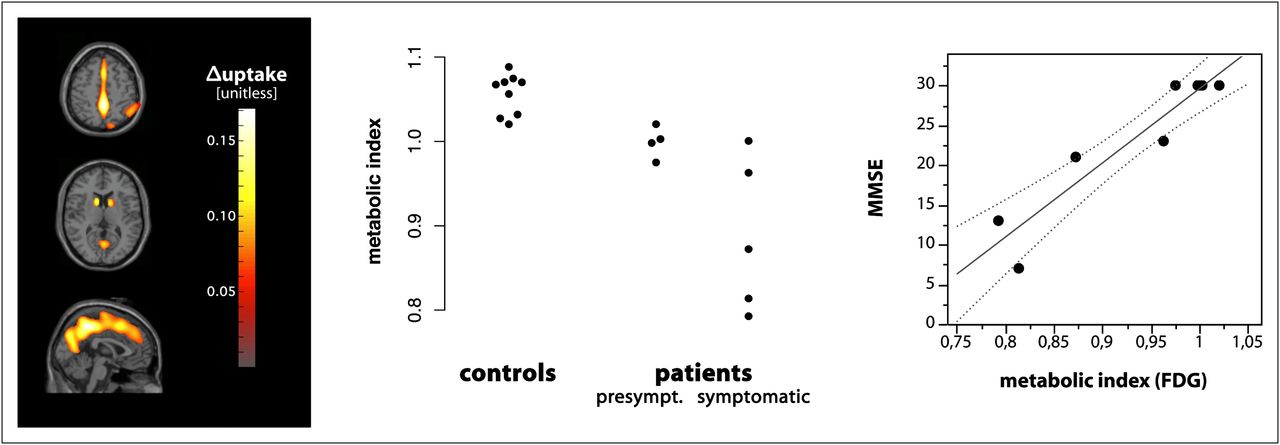
18F-FDG PET in SCA17 and matched controls. (Left) Reduced glucose metabolism in symptomatic SCA17 patients compared with controls (Pvoxel < 0.001; PFDR < 0.05). (Middle) Cerebral glucose metabolism is already reduced in presymptomatic stages of SCA17. (Right) Correlation of cerebral glucose metabolism and cognitive function assessed by MMSE (in symptomatic patients: r = 0.90; P < 0.037).
DISCUSSION
In a combined functional and morphologic imaging approach, we found a multisystemic pattern of neuronal dysfunction and degeneration including not only the cerebellum but also the striatum in SCA17 patients and even in yet-presymptomatic mutation carriers. Explorative voxelwise analysis of 18F-FDG PET revealed further cortical regions with reduced glucose metabolism. Because these neuronal alterations correlated closely with disease severity in affected patients and were also recognized in presymptomatic mutation carriers, they might serve as potential evidence for ongoing disease activity even in a preclinical stage of the disease.
Moreover, these imaging findings might help to explain the heterogeneous phenotype in SCA17. In 12 SCA17 patients, a large MRI study reported a similar pattern of neurodegeneration that could be associated with clinical characteristics. Motor dysfunction was related to atrophy of the cerebellum and basal ganglia, whereas structural changes of the frontal, temporal, and limbic compartments were associated with neuropsychiatric and cognitive impairment (9). In a follow-up investigation after 18 months, the authors showed a progression of clinical symptoms, especially motor dysfunction paralleled by a progressive atrophy of the respective brain regions as indicated in the baseline examination (25). These findings support our hypothesis that in vivo imaging might help to monitor disease activity and progression of neurodegeneration.
The clinical phenotype in SCA17 often resembles features of Huntington disease. Interestingly, the degree of motor and cognitive decline was highly associated in our sample, as is also observed in Huntington disease. In both diseases, neurodegeneration involves striatal and cortical structures. Functional imaging with 11C-raclopride PET revealed reduced postsynaptic dopaminergic levels even in preclinical stages of Huntington disease and is regarded as the most sensitive indicator of early neuronal impairment (26,27). Similarly, 11C-raclopride PET and 18F-FDG PET present as interesting markers of disease activity in our cohort of manifest patients and yet-unaffected SCA17 mutation carriers. To our knowledge, the postsynaptic dopaminergic system has not been investigated systematically in SCA17 so far. Functional imaging studies in SCA17 have been restricted to only a few patients who underwent either dopamine transporter SPECT or 18F-fluorodopa PET and showed presynaptic dopaminergic dysfunction (28–31). The fact that none of our patients presented with parkinsonian features is in agreement with other SCA17 cohorts, in which clinical signs of parkinsonism were rare as well (3–6). This finding may be surprising with regard to the marked abnormalities of the pre- and postsynaptic dopaminergic system. However, it fits well with observations in SCA2, in which presynaptic dopaminergic dysfunction is not restricted to patients manifesting with parkinsonism but is also present in patients showing no extrapyramidal symptoms (32). Moreover, the observed pattern of dopaminergic dysfunction in SCA17 differs from that in neurodegenerative diseases with predominant parkinsonism, such as typical or atypical parkinsonian syndromes in which parkinsonian motor features occur at a given critical level of presynaptic degeneration whereas postsynaptic findings vary and predict response to treatment rather than the severity of parkinsonism itself (33–35). In our SCA17 cohort, we found distinct postsynaptic dopaminergic dysfunction and less presynaptic impairment. Further, striatal degeneration assessed with 18F-FDG PET and MRI was more pronounced in the caudate nucleus than in the putamen. Consistently, substantia nigra showed only moderate degeneration in SCA17 (1,3,10,11). However, the moderate extent of nigrostriatal dopaminergic degeneration in our SCA17 sample may not be the only explanation for the lack of parkinsonian features. In SCA2 and SCA3, only a minority of patients develop parkinsonism, although degeneration of the substantia nigra is severe in these SCA subtypes (36–38). The pathophysiologic background of this paradox remains to be elucidated.
Although this is the largest imaging study combining functional and morphologic methods in SCA17 so far, the small number of patients and presymptomatic individuals raises limitations in data interpretation. We tried to overcome this shortcoming, first, by performing statistical analysis nonparametrically and, second, by performing MRI volumetry on a single-subject basis instead of executing automated group comparisons using voxel-based morphometry analysis. We think that the findings in this study are further supported by the fact that although we used different control groups for each imaging method, the pattern of neuronal dysfunction and degeneration in our SCA17 subjects was consistent for each imaging modality. However, we regard our data primarily as an important basis for further studies and suggest that findings reported here need to be validated in larger cohorts. Another limitation is the lack of a more detailed neuropsychological assessment—a lack that should be addressed in future studies to improve the understanding of SCA17-associated dementia.
We did not correct the PET data for atrophy because our focus was on evaluating potential robust markers of neurodegeneration rather that on absolutely quantifying metabolic activity per cubic centimeter of gray matter. As a result, we cannot determine to what extent the observed hypometabolism actually exceeds the level that can be expected from atrophy. Still, our results do reflect the level of cortical neurodegeneration or dysfunction. The only region where atrophy might have caused misleading results is gray matter adjacent to the interhemispheric cleft. On careful inspection of the individual and group mean images, we concluded that, indeed, patients showed not only lower gray matter uptake of 18F-FDG in the respective regions but also a slightly broader interhemispheric space, at least in the area of the cuneus and precuneus. Thus, here, the SPM cluster reflects a combination of both effects. Separating both effects within voxel-based analysis is a nontrivial task and would certainly require a larger sample size.
Although this study presents cross-sectional data, morphologic changes and functional impairment of the cerebellum and striatum were robust findings not only in manifest patients but also in presymptomatic mutation carriers and therefore might serve as potential evidence for disease activity and progression. So far, only hereditary diseases such as SCA17 allow the identification and analysis of at-risk subjects in a presymptomatic stage of the disease. Subjects need to be followed longitudinally to evaluate MRI volumetry and11C-raclopride and 18F-FDG PET as surrogate markers of disease progression and to determine the optimal time for treatment with potential disease-modifying agents.
CONCLUSION
MRI volumetry, as well as 11C-raclopride and 18F-FDG PET, reveal neuronal dysfunction and neurodegeneration even in the presymptomatic stage and may serve as markers for disease activity in upcoming interventional trials on SCA17.
DISCLOSURE STATEMENT
The costs of publication of this article were defrayed in part by the payment of page charges. Therefore, and solely to indicate this fact, this article is hereby marked “advertisement” in accordance with 18 USC section 1734.
Acknowledgments
We thank the patients who participated in this study, and we acknowledge the excellent technical assistance of Holger Putzhammer in the acquisition of MR images and of Nadja Buckmüller in PET tracer synthesis. This study was supported in full by a grant from the Deutsche Forschungsgemeinschaft (SCHO754/3-1) and in part by additional grants from Deutsche Forschungsgemeinschaft (RE-1472/6-2, MA 1096/5-1, MA 1096/8-1, SCHO754/3-1, SCHO754/4-1, SCHO754/5-1, and GRK diemOsiris), the Robert-Bosch-Foundation (“Forschungskolleg Geriatrie”), the HSP-Selbsthilfegruppe Deutschland eV, and the Volkswagen Foundation (I/80711). No other potential conflict of interest relevant to this article was reported.
Footnotes
Published online May 31, 2012.
↵* Contributed equally to this work.
- © 2012 by the Society of Nuclear Medicine, Inc.
REFERENCES
- Received for publication December 6, 2011.
- Accepted for publication February 21, 2012.


Jump to section
Related Articles
Cited By...
- Rapid Onset of Motor Deficits in a Mouse Model of Spinocerebellar Ataxia Type 6 Precedes Late Cerebellar Degeneration
- The preclinical stage of spinocerebellar ataxias
- A Novel Transgenic Rat Model for Spinocerebellar Ataxia Type 17 Recapitulates Neuropathological Changes and Supplies In Vivo Imaging Biomarkers