
Main menu

  • Home
  • Content
    • Current
    • Ahead of print
    • Past Issues
    • JNM Supplement
    • SNMMI Annual Meeting Abstracts
    • Continuing Education
    • JNM Podcasts
  • Subscriptions
    • Subscribers
    • Institutional and Non-member
    • Rates
    • Journal Claims
    • Corporate & Special Sales
  • Authors
    • Submit to JNM
    • Information for Authors
    • Assignment of Copyright
    • AQARA requirements
  • Info
    • Reviewers
    • Permissions
    • Advertisers
  • About
    • About Us
    • Editorial Board
    • Contact Information
  • More
    • Alerts
    • Feedback
    • Help
    • SNMMI Journals
  • SNMMI
    • JNM
    • JNMT
    • SNMMI Journals
    • SNMMI

User menu

  • Subscribe
  • My alerts
  • Log in
  • My Cart

Search

  • Advanced search
Journal of Nuclear Medicine
  • SNMMI
    • JNM
    • JNMT
    • SNMMI Journals
    • SNMMI
  • Subscribe
  • My alerts
  • Log in
  • My Cart
Journal of Nuclear Medicine

Advanced Search

  • Home
  • Content
    • Current
    • Ahead of print
    • Past Issues
    • JNM Supplement
    • SNMMI Annual Meeting Abstracts
    • Continuing Education
    • JNM Podcasts
  • Subscriptions
    • Subscribers
    • Institutional and Non-member
    • Rates
    • Journal Claims
    • Corporate & Special Sales
  • Authors
    • Submit to JNM
    • Information for Authors
    • Assignment of Copyright
    • AQARA requirements
  • Info
    • Reviewers
    • Permissions
    • Advertisers
  • About
    • About Us
    • Editorial Board
    • Contact Information
  • More
    • Alerts
    • Feedback
    • Help
    • SNMMI Journals
  • View or Listen to JNM Podcast
  • Visit JNM on Facebook
  • Join JNM on LinkedIn
  • Follow JNM on Twitter
  • Subscribe to our RSS feeds
Research ArticleBasic Science Investigations

Comparative Evaluation of 18F-Labeled Glutamic Acid and Glutamine as Tumor Metabolic Imaging Agents

Karl Ploessl, Limin Wang, Brian P. Lieberman, Wenchao Qu and Hank F. Kung
Journal of Nuclear Medicine October 2012, 53 (10) 1616-1624; DOI: https://doi.org/10.2967/jnumed.111.101279
Karl Ploessl
1Department of Radiology, University of Pennsylvania, Philadelphia, Pennsylvania; and
  • Find this author on Google Scholar
  • Find this author on PubMed
  • Search for this author on this site
Limin Wang
1Department of Radiology, University of Pennsylvania, Philadelphia, Pennsylvania; and
  • Find this author on Google Scholar
  • Find this author on PubMed
  • Search for this author on this site
Brian P. Lieberman
1Department of Radiology, University of Pennsylvania, Philadelphia, Pennsylvania; and
  • Find this author on Google Scholar
  • Find this author on PubMed
  • Search for this author on this site
Wenchao Qu
1Department of Radiology, University of Pennsylvania, Philadelphia, Pennsylvania; and
  • Find this author on Google Scholar
  • Find this author on PubMed
  • Search for this author on this site
Hank F. Kung
1Department of Radiology, University of Pennsylvania, Philadelphia, Pennsylvania; and
2Department of Pharmacology, University of Pennsylvania, Philadelphia, Pennsylvania
  • Find this author on Google Scholar
  • Find this author on PubMed
  • Search for this author on this site
  • Article
  • Figures & Data
  • Info & Metrics
  • PDF
Loading

Article Figures & Data

Figures

  • Tables
  • SCHEME 1.
    • Download figure
    • Open in new tab
    • Download powerpoint
    SCHEME 1.

    Radiosynthesis and identification of 18F-(2S,4R)4F-GLN and 18F-(2S,4R)4F-GLU. HPLC = high-performance liquid chromatography; TFA = trifluoroacetic acid; UV = ultraviolet.
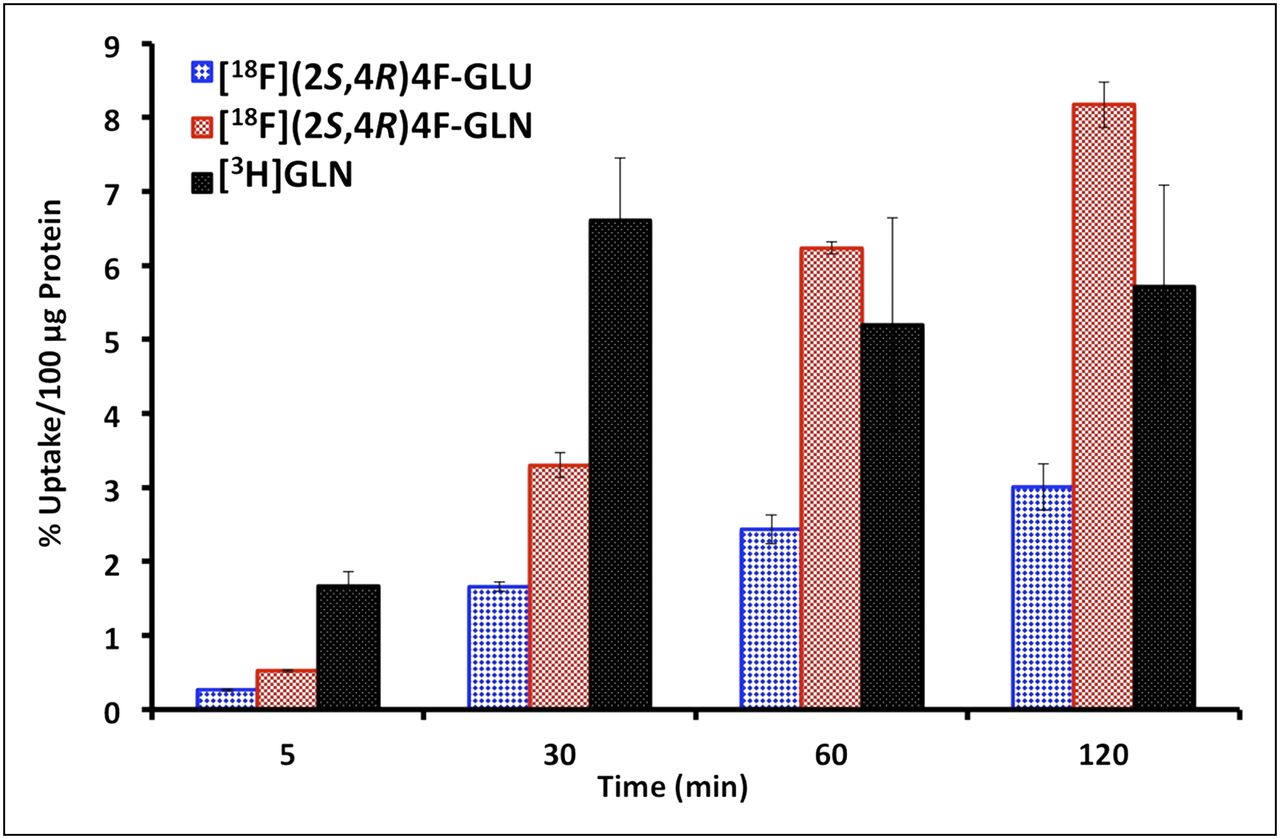
  • FIGURE 1.
    • Download figure
    • Open in new tab
    • Download powerpoint
    FIGURE 1.

    Time-dependent uptake of 18F-(2S,4R)4F-GLU, 18F-(2S,4R)4F-GLN, and 3H-GLN in PBS in 9L cells. Data are expressed as percentage of uptake in 100 μg of protein (mean ± SD, n = 3) (1-way ANOVA for cell uptake studies in 9L cells: 5 min, P < 0.001; 30 min, P < 0.001; 60 min, P = 0.004; 120 min, P = 0.001). GLN = glutamine; GLU = glutamic acid.
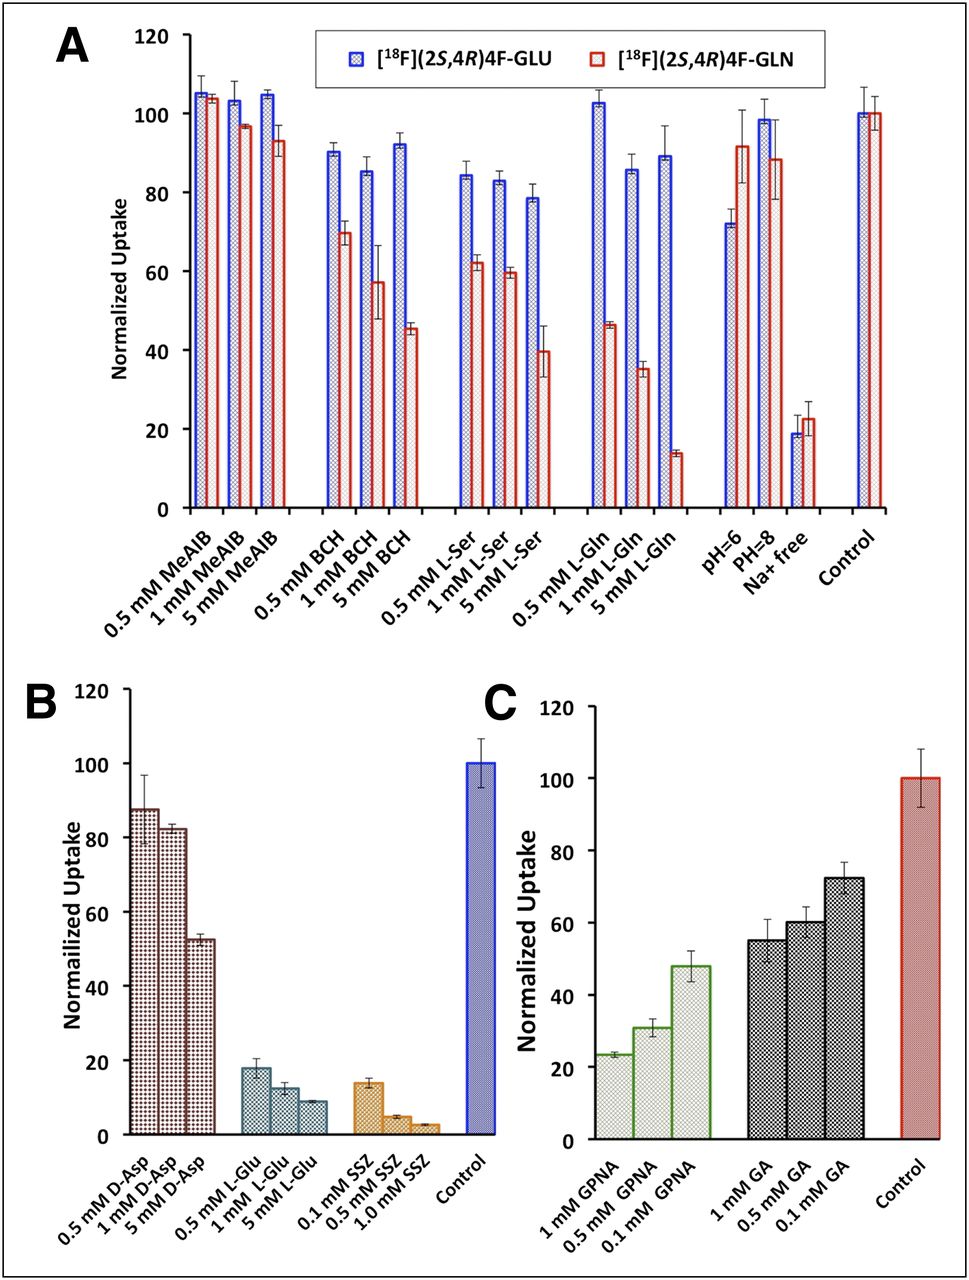
  • FIGURE 2.
    • Download figure
    • Open in new tab
    • Download powerpoint
    FIGURE 2.

    (A) Uptake of 18F-(2S,4R)4F-GLN and 18F-(2S,4R)4F-GLU in 9L cells in presence of inhibitors for systems A, ASC, L, and N and in medium free of Na+ or at various pH levels. (B) Uptake of 18F-(2S,4R)4F-GLU in presence of inhibitors for Xc− (SLC7A11) and XAG− (SLC1A1). (C) Uptake of 18F-(2S,4R)4F-GLN in presence of inhibitors for ASCT2 (SLC1A5). Uptake values are normalized to uptake of tracers in PBS in absence of inhibitors. Data are normalized uptake values (mean ± SD, n = 3). GLN = glutamine; GLU = glutamic acid.
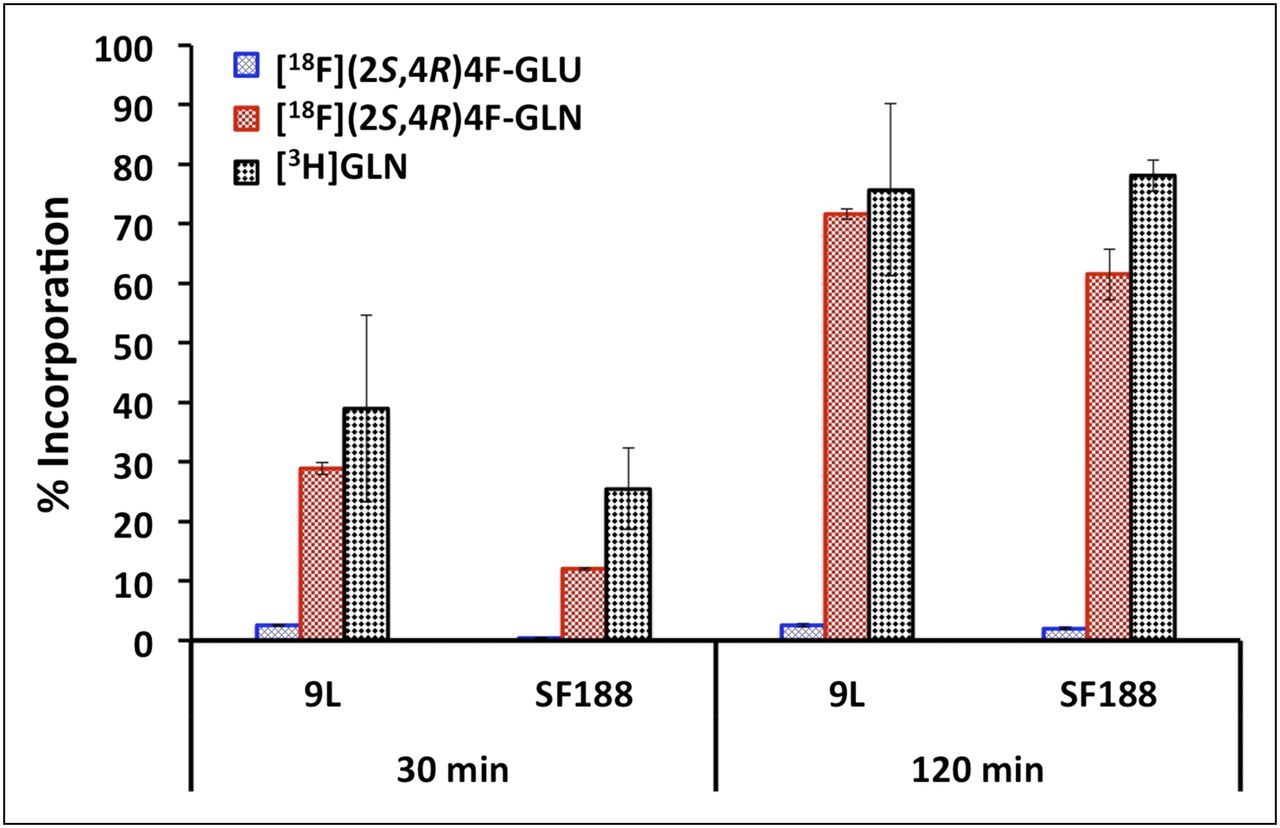
  • FIGURE 3.
    • Download figure
    • Open in new tab
    • Download powerpoint
    FIGURE 3.

    Protein incorporation of 18F-(2S,4R)4F-GLN and 18F-(2S,4R)4F-GLU in 9L and SF188 tumor cell lines. 3H-GLN was used as reference ligand. Only glutamine 3H-GLN and derivative 18F-(2S,4R)4F-GLN showed significant cellular incorporation; corresponding glutamic acid derivative displayed low cell trapping. Data are percentage of TCA-insoluble fraction (% incorporation) (mean ± SD, n = 3–6) (1-way ANOVA for protein incorporation: in 9L cells, P = 0.007 [30 min], P < 0.001 [120 min]; in SF188 cells, P = 0.001 [30 min], P < 0.001 [120 min]). BCH = 2-aminobicyclo[2.2.1]heptane-2-carboxylic acid; D-Asp = d-aspartic acid; GA = l-γ-glutamyl-anilide; GLN = glutamine; GLU = glutamic acid; GPNA = l-γ-glutamyl-p-nitroanilide; L-Ser = l-serine; MeAIB = [N-methyl]-α-methylaminoisobutyric acid; SSZ = sulfasalazine.
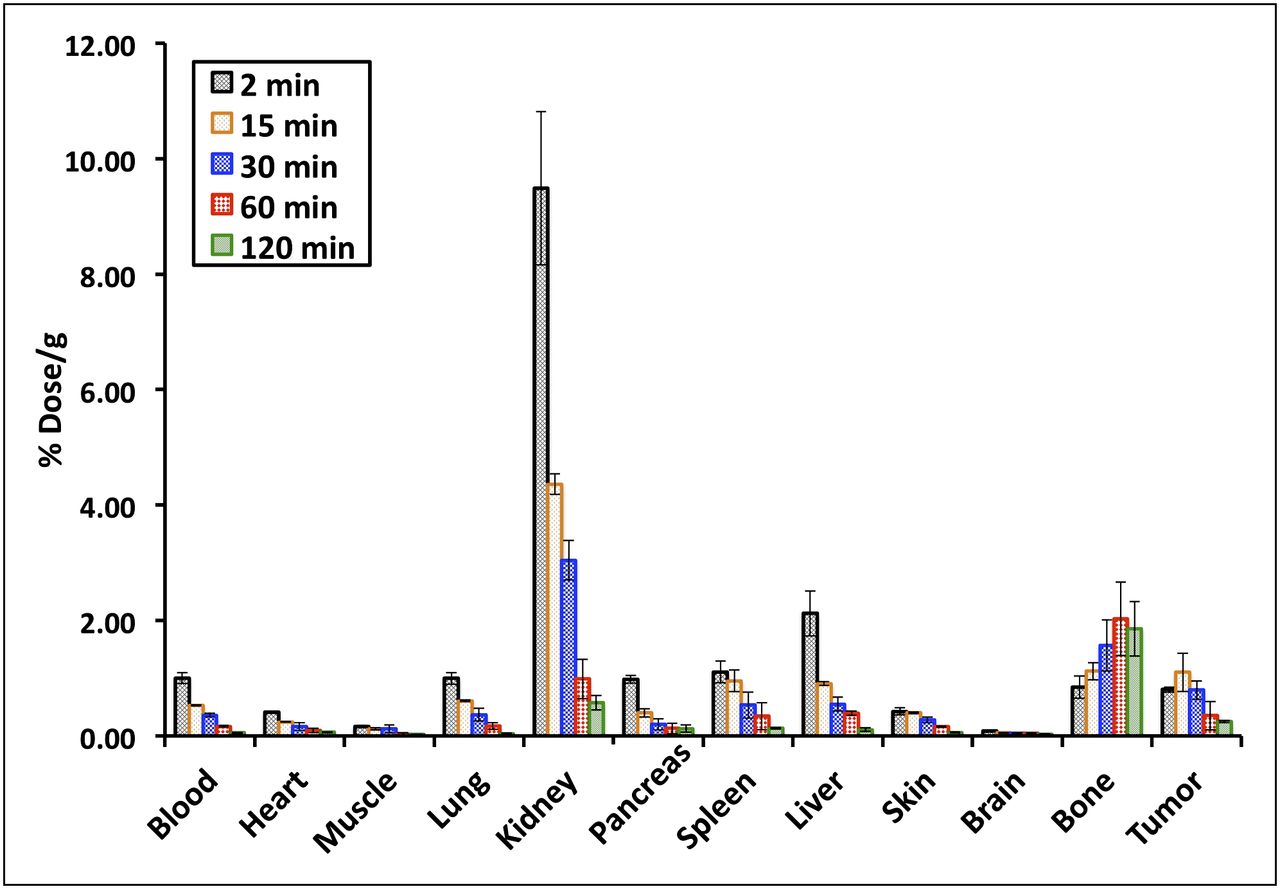
  • FIGURE 4.
    • Download figure
    • Open in new tab
    • Download powerpoint
    FIGURE 4.

    In vivo biodistribution study of 18F-(2S,4R)4F-GLU in rats bearing 9L xenografts. Data are percentage initial dose per gram, mean ± SD (n = 3).

  • FIGURE 5.
    • Download figure
    • Open in new tab
    • Download powerpoint
    FIGURE 5.

    Summed 120-min small-animal PET images of 18F-(2S,4R)4F-GLU (A) and 18F-(2S,4R)4F-GLN (B) in rats bearing 9L tumor model. Data represent summed 2-h scan from transverse, coronal, and sagittal views (left to right). Arrows indicate location of 9L tumors.

  • FIGURE 6.
    • Download figure
    • Open in new tab
    • Download powerpoint
    FIGURE 6.

    (A) Time–activity curve of 18F-(2S,4R)4F-GLU in rats bearing 9L xenograft. (B) Time–activity curve of 18F-(2S,4R)4F-GLN in rats bearing 9L xenograft. Glutamine derivative displays prolonged tumor retention, whereas glutamic acid derivative shows faster washout. (C) Comparison of tumor-to-muscle ratio of 18F-(2S,4R)4F-GLU and 18F-(2S,4R)4F-GLN.

Tables

  • Figures
    • View popup
    TABLE 1

    Ratios of 18F-(2S,4R)4F-GLN* Uptake to 18F-(2S,4R)4F-GLU Uptake in Different Tumor Cell Lines

    Time (min)9LSF188PC-3
    51.52 ± 0.262.90 ± 0.855.56 ± 1.62
    301.85 ± 0.352.57 ± 0.605.31 ± 1.60
    602.59 ± 1.051.78 ± 0.514.23 ± 1.26
    1202.78 ± 1.021.47 ± 0.384.22 ± 0.55
    • ↵* Data were first published by Lieberman et al. (24).

    • View popup
    TABLE 2

    Biodistribution Studies of 18F-(2S,4R)4F-GLN and 18F-(2S,4R)4F-GLU in Rats Bearing 9L Tumor After Intravenous Injection

    30 min60 min
    Organ18F-(2S,4R)4F-GLU18F-(2S,4R)4F-GLN*18F-(2S,4R)4F-GLU18F-(2S,4R)4F-GLN*
    Blood0.36 ± 0.030.43 ± 0.010.17 ± 0.020.32 ± 0.02
    Heart0.16 ± 0.070.36 ± 0.020.09 ± 0.040.35 ± 0.01
    Muscle0.12 ± 0.070.37 ± 0.020.03 ± 0.020.38 ± 0.03
    Lung0.37 ± 0.340.64 ± 0.020.17 ± 0.060.41 ± 0.04
    Kidney3.04 ± 0.021.02 ± 0.120.99 ± 0.340.76 ± 0.18
    Pancreas0.20 ± 0.102.14 ± 0.270.13 ± 0.091.36 ± 0.16
    Spleen0.53 ± 0.220.76 ± 0.050.34 ± 0.230.53 ± 0.04
    Liver0.55 ± 0.120.98 ± 0.150.39 ± 0.040.66 ± 0.13
    Skin0.28 ± 0.050.42 ± 0.110.16 ± 0.010.29 ± 0.04
    Brain0.05 ± 0.010.11 ± 0.010.05 ± 0.000.13 ± 0.00
    Bone1.57 ± 0.440.78 ± 0.132.03 ± 0.641.03 ± 0.38
    9L tumor0.79 ± 0.161.03 ± 0.140.35 ± 0.250.76 ± 0.21
    Tumor/blood2.18 ± 0.472.40 ± 0.332.11 ± 1.522.38 ± 0.67
    Tumor/muscle6.36 ± 3.922.78 ± 0.4111.2 ± 10.92.00 ± 0.57
    Tumor/brain17.6 ± 5.029.36 ± 1.537.13 ± 5.095.85 ± 1.61
    • ↵* Data were first published by Lieberman et al. (24).

    • Data are average percentage dose per gram, mean ± SD (n = 3 to 6).

PreviousNext
Back to top

In this issue

Journal of Nuclear Medicine: 53 (10)
Journal of Nuclear Medicine
Vol. 53, Issue 10
October 1, 2012
  • Table of Contents
  • Table of Contents (PDF)
  • About the Cover
  • Index by author
Print
Download PDF
Article Alerts
Sign In to Email Alerts with your Email Address
Email Article

Thank you for your interest in spreading the word on Journal of Nuclear Medicine.

NOTE: We only request your email address so that the person you are recommending the page to knows that you wanted them to see it, and that it is not junk mail. We do not capture any email address.

Enter multiple addresses on separate lines or separate them with commas.
Comparative Evaluation of 18F-Labeled Glutamic Acid and Glutamine as Tumor Metabolic Imaging Agents
(Your Name) has sent you a message from Journal of Nuclear Medicine
(Your Name) thought you would like to see the Journal of Nuclear Medicine web site.
Citation Tools
Comparative Evaluation of 18F-Labeled Glutamic Acid and Glutamine as Tumor Metabolic Imaging Agents
Karl Ploessl, Limin Wang, Brian P. Lieberman, Wenchao Qu, Hank F. Kung
Journal of Nuclear Medicine Oct 2012, 53 (10) 1616-1624; DOI: 10.2967/jnumed.111.101279

Citation Manager Formats

  • BibTeX
  • Bookends
  • EasyBib
  • EndNote (tagged)
  • EndNote 8 (xml)
  • Medlars
  • Mendeley
  • Papers
  • RefWorks Tagged
  • Ref Manager
  • RIS
  • Zotero
Share
Comparative Evaluation of 18F-Labeled Glutamic Acid and Glutamine as Tumor Metabolic Imaging Agents
Karl Ploessl, Limin Wang, Brian P. Lieberman, Wenchao Qu, Hank F. Kung
Journal of Nuclear Medicine Oct 2012, 53 (10) 1616-1624; DOI: 10.2967/jnumed.111.101279
Twitter logo Facebook logo LinkedIn logo Mendeley logo
  • Tweet Widget
  • Facebook Like
  • Google Plus One
Bookmark this article

Jump to section

  • Article
    • Abstract
    • MATERIALS AND METHODS
    • RESULTS
    • DISCUSSION
    • CONCLUSION
    • DISCLOSURE STATEMENT
    • Acknowledgments
    • Footnotes
    • REFERENCES
  • Figures & Data
  • Info & Metrics
  • PDF

Related Articles

  • This Month in JNM
  • PubMed
  • Google Scholar

Cited By...

  • 18F-Fluciclovine PET Imaging of Glutaminase Inhibition in Breast Cancer Models
  • First-in-Human PET Imaging and Estimated Radiation Dosimetry of L-[5-11C]-Glutamine in Patients with Metastatic Colorectal Cancer
  • Metabolic Phenotypes, Dependencies, and Adaptation in Lung Cancer
  • Preclinical Applications of Multi-Platform Imaging in Animal Models of Cancer
  • Pharmacokinetic Assessment of 18F-(2S,4R)-4-Fluoroglutamine in Patients with Cancer
  • Glutamate-Weighted Chemical Exchange Saturation Transfer Magnetic Resonance Imaging Detects Glutaminase Inhibition in a Mouse Model of Triple-Negative Breast Cancer
  • Cancer cell metabolism: the essential role of the nonessential amino acid, glutamine
  • Metabolic Imaging of Glutamine in Cancer
  • [18F](2S,4R)4-Fluoroglutamine PET Detects Glutamine Pool Size Changes in Triple-Negative Breast Cancer in Response to Glutaminase Inhibition
  • Glutamine-based PET imaging facilitates enhanced metabolic evaluation of gliomas in vivo
  • Functional Imaging of Oxidative Stress with a Novel PET Imaging Agent, 18F-5-Fluoro-L-Aminosuberic Acid
  • Google Scholar

More in this TOC Section

  • Tumor Uptake of Anti-CD20 Fabs Depends on Tumor Perfusion
  • How Sensitive Is the Upper Gastrointestinal Tract to 90Y Radioembolization? A Histologic and Dosimetric Analysis in a Porcine Model
  • 11C-Methionine PET of Myocardial Inflammation in a Rat Model of Experimental Autoimmune Myocarditis
Show more Basic Science Investigations

Similar Articles

Keywords

  • 18F
  • PET
  • tumor imaging
  • glutamine
  • glutamic acid/glutamate
SNMMI

© 2025 SNMMI

Powered by HighWire