


Abstract
Assessment of striatal dopamine receptor availability with 18F-desmethoxyfallypride PET is of high diagnostic utility in parkinsonism. The present study was undertaken to define the optimal clinical scan protocol with regard to quantification accuracy and scan time. Methods: Fourteen patients with parkinsonian syndromes underwent 18F-desmethoxyfallypride PET over 90 min. Volume-of-interest analyses were performed after spatial normalization, with the right and left caudate nuclei and putamina as target regions and the cerebellum as reference region. The estimate of target region binding potential (relative to nondisplaceable radioligand in tissue) (BPND) provided by the 2-step simplified reference tissue model (SRTM2) served as the reference standard. Additional analyses included the multilinear reference tissue model 2 (MRTM2), noninvasive graphical analyses, and single-scan analyses (peak-equilibrium analysis at 35–65 min [PEA]; pseudoequilibrium analysis at 60–90 min [PsEA]). Results: SRTM2 and MRTM2 yielded virtually identical results (mean BPND difference = 0.1% ± 0.5%, r2 = 1.0). Noninvasive graphical analyses with and without inclusion of the k2′ term were affected by a small BPND bias (2.5% ± 3.6% and −5.0% ± 6.7%, respectively), although correlations with SRTM2 were still excellent (r2 = 1.0 and 0.98, respectively). In turn, single-scan analyses suffered from limited precision (PEA, mean BPND bias = 0.7% ± 13.0%, r2 = 0.90) or a considerable positive bias (PsEA, 19.2% ± 7.1%, r2 = 0.98). Shortening scan time to 70 and 60 min resulted in an acceptable average BPND change (<5% decline) for SRTM2/MRTM2 and graphical analysis with inclusion of the k2′ term, respectively. Conclusion: Kinetic reference tissue model analyses of 18F-desmethoxyfallypride PET data offer the least biased results at a well-tolerable scan duration and should thus be pursued whenever possible. Single-scan analyses may be pragmatic alternatives that, however, suffer from a relevant positive bias (PsEA) or limited precision (PEA).
Differentiation between idiopathic Parkinson disease and atypical parkinsonian syndromes is of paramount prognostic and therapeutic importance. Because the diagnostic accuracy of the clinical diagnosis is limited, SPECT or PET quantification of striatal dopamine D2/D3 receptor availability is of high diagnostic utility and, thus, recommended by international guidelines (1). Commonly used radiotracers include 123I-iodobenzamide and 11C-raclopride for SPECT and PET, respectively. However, the diagnostic accuracy of D2/D3 receptor SPECT has been challenged by a metaanalysis (2). Furthermore, studies have demonstrated a high accuracy of 11C-raclopride PET (3,4), but the availability of 11C-raclopride is limited by the short physical half-life of 11C (20 min), necessitating on-site radiochemical synthesis. 18F-desmethoxyfallypride (5) has emerged as a promising new PET ligand with better imaging characteristics than 123I-iodobenzamide and a relatively long physical half-life (109 min), allowing for tracer shipment to PET sites without a cyclotron. Moreover, recent studies found that 18F-desmethoxyfallypride PET had a high to very high accuracy for differentiating between Parkinson disease and atypical parkinsonian syndromes (6,7).
As a prerequisite for clinical implementation of 18F-desmethoxyfallypride PET, imaging protocols need to be defined that represent a reasonable compromise between patient comfort, technical complexity, and validity of the outcome parameter (binding potential relative to nondisplaceable radioligand in tissue [BPND], as an estimate of D2/D3 receptor availability) (8). Consequently, most valid but also invasive and technically demanding pharmacokinetic analyses relying on arterial blood sampling are not suited for clinical routine. In the case of 18F-desmethoxyfallypride PET, kinetic reference tissue models have been proposed as valid noninvasive alternative methods to invasive analyses (9,10). However, overall scanning time may be unfavorably long for use in patients. As a further simplification, initial clinical studies (6,7) used a single-scan analysis during the putative time of pseudoequilibrium (or secular equilibrium; 60–90 min after injection), when the ratio of 18F-desmethoxyfallypride concentrations in the target region and the reference region becomes constant (approximation of the distribution volume ratio). However, BPND estimates (= distribution volume ratio − 1) derived by such a pseudoequilibrium analysis (PsEA) may show a relevant positive bias (11,12). Alternatively, a single PET scan at the time of peak equilibrium (or transient equilibrium; that is, time of maximum specific binding) can also provide fairly accurate BPND estimates (12,13). Both this peak equilibrium analysis (PEA) (9) and PsEA (10) were demonstrated to provide estimates of BPND that correlate well with kinetic analyses in the case of 18F-desmethoxyfallypride. However, a comprehensive, direct comparison of noninvasive analysis methods in a representative patient sample is still missing.
To define the optimal imaging protocol for clinical routine, the present study compared several noninvasive reference tissue analyses. In addition, we also defined the minimum scanning time needed for kinetic analyses. Unlike earlier studies on young healthy volunteers (9,10), we intentionally included a representative sample of elderly patients with parkinsonism.
MATERIALS AND METHODS
Subjects
All procedures were approved by the local ethics committee. Fourteen consecutive patients (mean age ± SD, 67.8 ± 7.3 y; 6 with Parkinson disease, 6 with atypical parkinsonian syndromes, and 2 with nonneurodegenerative parkinsonism) with a mean disease duration of 2.8 ± 1.5 y referred for 18F-desmethoxyfallypride PET between February and August 2011 were recruited after giving written informed consent. Neurologist experts made the final diagnoses on the basis of a comprehensive neurologic examination, clinical follow-up, and MRI and 18F-FDG PET findings. Two of the Parkinson disease patients were finally diagnosed as having Parkinson disease with dementia. In the group with atypical parkinsonian syndromes, the final diagnoses were as follows: progressive supranuclear palsy in 3, multiple system atrophy in 2 (1 each with prominent parkinsonism and cerebellar symptoms), and corticobasal degeneration in 1. One of the patients with nonneurodegenerative parkinsonism had normal-pressure hydrocephalus; the most likely diagnosis in the other was Wernicke encephalopathy.
PET Data Acquisition and Analysis
18F-desmethoxyfallypride radiochemical synthesis was performed as previously described (9) (precursor provided by ABX GmbH) with minor modifications. Radiochemical purity was greater than 95%, and the specific activity was greater than 148 GBq/μmol in each patient.
After a 5-min 68Ge/68Ga transmission scan, a dynamic emission scan in 2-dimensional mode was acquired over 90 min (29 frames, 10- to 300-s frame duration) after a bolus injection of 257 ± 29 MBq of 18F-desmethoxyfallypride (ECAT EXACT 922/47 scanner; Siemens). Datasets were reconstructed by filtered backprojection (Shepp filter, 5 mm in full width at half maximum) with a voxel size of 2.24 × 2.24 × 3.375 mm. The patient’s head was gently restrained with elastic tape. Its position was continuously carefully monitored (using the scanner laser beams and reference skin marks) and, if necessary, manually corrected. In addition, automated motion correction using the mutual information algorithm was performed on 5 patients (14). This and all subsequent data analyses were done using the PMOD software package (version 3.2, PMOD Technologies Ltd.). Each subject’s 18F-desmethoxyfallypride dataset was spatially normalized by fitting the initial 6-min summed PET image to the PET template in Montreal Neurologic Institute space and applying the normalization parameters to all individual frames (voxel size after normalization, 2.0 × 2.0 × 2.0 mm) (15). Decay-corrected, regional time–activity curves were then extracted using a volume-of-interest template. The template included left and right caudate nuclei (4.2 and 4.4 mL) and putamina (7.4 and 7.9 mL) (D2/D3 receptor–rich target regions) and the cerebellum (147 mL) (reference region devoid of specific D2/D3 receptor binding). The localization of each volume of interest was carefully checked and manually adjusted if necessary. To explore the minimum scan time needed for kinetic analyses, time–activity curves were reduced in 10-min (2-frame) steps from 90 to 40 min of total scan time.
Quantification of Striatal D2/D3 Receptor Availability
The following reference tissue analyses were used to assess the D2/D3 receptor availability in striatal target regions (cerebellum as reference region input). More detailed descriptions have been previously published (12,16).
Two-Step Simplified Reference Tissue Model (SRTM2)
The SRTM2 (17) served as the reference standard based on earlier 18F-desmethoxyfallypride PET studies (9,10). Gründer et al. (9) demonstrated a high correlation (r = 0.924) between estimates of regional BPND provided by the simplified reference tissue model (SRTM) (18) and the gold standard 2-tissue-compartment model (2TCM). Furthermore, average regional BPND values given by SRTM on one hand and by 2TCM or invasive graphical analysis on the other hand showed a high correspondence (9). The SRTM2 takes advantage of the fact that k2′ (i.e., the efflux rate constant of 18F-desmethoxyfallypride from the cerebellum) should be equal for all regional analyses in the same subject. After fixing k2′ to the individual value, only 2 parameters remain to be fitted by SRTM2 (i.e., BPND and the ratio of ligand delivery to the target and the reference region [R1]). For implementation of SRTM2, the individual k2′ value was estimated in each subject by a simultaneous SRTM fit with coupled k2′ including all target regions.
Multilinear Reference Tissue Model 2 (MRTM2)
As with SRTM2, the number of parameters of the MRTM2 (19) is reduced to 2 (BPND and R1) by fixing k2′ to the individual k2′ value. For optimal comparability, we used the k2′ estimate from the coupled SRTM fit.
Logan Noninvasive Graphical Analysis (NIGA)
The NIGA (20) operational equation requests that k2′ is provided in advance. Logan et al. (20) suggested using a population mean k2′ value estimated by invasive analyses. However, because such an estimate is not available from the literature and we wanted optimal comparability, we again used the individual k2′ value given by the coupled SRTM fit. Distribution volume ratio is given by the slope of the linear part of the NIGA plot (BPND = distribution volume ratio − 1).
Simplified NIGA
The k2′-containing term of the NIGA equation may also be omitted, if a ligand reaches near-pseudoequilibrium conditions during the scan (20) as is the case for 18F-desmethoxyfallypride.
PsEA
Regional distribution volume ratio was approximated by the ratio of 18F-desmethoxyfallypride concentration in the target region to 18F-desmethoxyfallypride concentration in the reference region at 60–90 min after injection (6,7,10).
PEA
Regional distribution volume ratio was calculated as the ratio of 18F-desmethoxyfallypride concentration in the target region to 18F-desmethoxyfallypride concentration in the reference region at 35–65 min.
Statistics
All results are expressed as mean ± SD. Different analyses were compared by calculating the mean value of the BPND difference expressed as percentage (ΔBPND) and the mean of the absolute value of the percentage difference (|ΔBPND|). In addition, we performed linear regression analyses and calculated the coefficient of variation (expressed as percentage; %COV) of the error of each analysis in comparison with the reference standard (SRTM2) by dividing the root mean squared error of the linear regression model by the mean estimate of the respective analysis. Differences between analyses were checked for statistical significance using a paired Student t test, considering a P value of less than 0.05 significant. The change of specific binding curves (18F-desmethoxyfallypride concentration in target region – 18F-desmethoxyfallypride concentration in cerebellum) and uptake ratio curves (18F-desmethoxyfallypride concentration in target region/18F-desmethoxyfallypride concentration in cerebellum) over time was calculated as the slopes of these curves relative to the mean value of specific binding and uptake ratio, respectively, for the selected time period (expressed in %/h). Difference from zero was explored using a 1-sample t test
RESULTS
Quantification of Striatal D2/D3 Receptor Availability
SRTM analyses with coupled k2′ gave reasonable fits to the time–activity curves of all patients as judged by visual inspection. Plots of residuals revealed no systematic trends. The mean estimate of k2′ was 0.074 ± 0.026 min−1. SRTM2 and MRTM2 (t* = 0 min; i.e., all data points included) using the individual k2′ estimates from the preceding coupled SRTM analyses also fitted the time–activity curves well. Both analyses gave virtually identical results without a significant difference (ΔBPND = 0.1% ± 0.5%, |ΔBPND| = 0.3% ± 0.4%; paired t test, P = 0.79). They showed an excellent linear correlation (r2 = 1.00), with the %COV of the error of MRTM2 (compared with SRTM2) being small (0.37%; Table 1). Mean BPND values were 0.91 ± 0.33 in the caudate nucleus and 1.50 ± 0.35 in the putamen.
Summary of Comparisons of Different Analyses with SRTM2
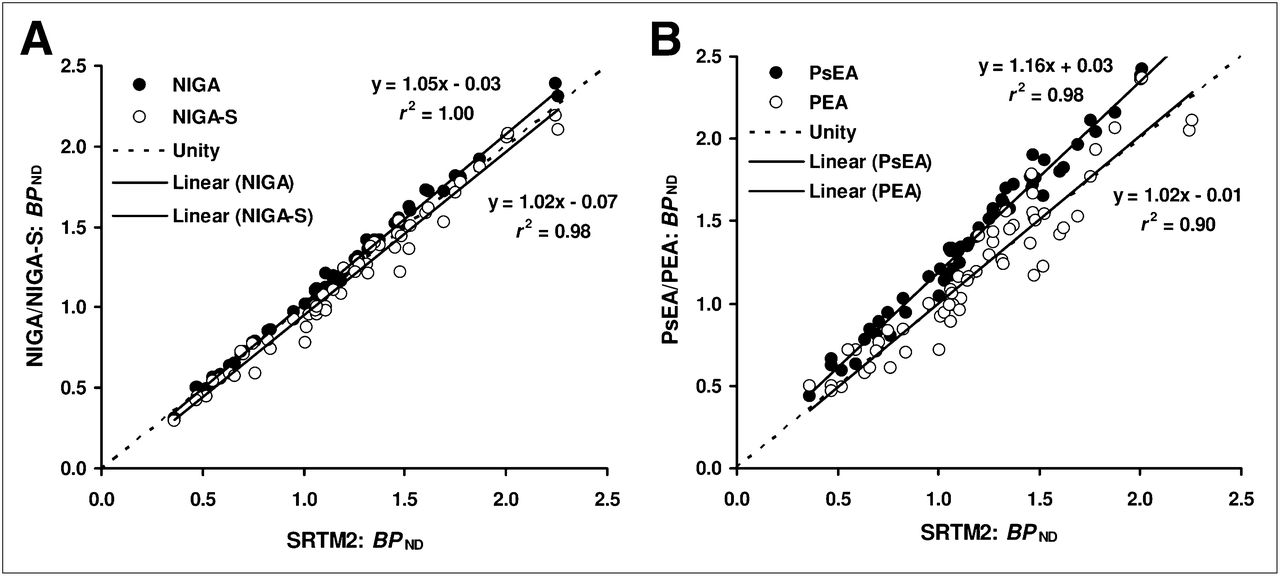
NIGA analyses were performed with a uniform start time (t*) of 17 min (including fifteen 5-min frames). This t* value (as for simplified NIGA) was empirically selected by a preceding analysis of several datasets with low, average, and high D2/D3 receptor availability (as given by SRTM2). In subsequent analyses of all datasets, its appropriateness was confirmed by careful visual inspection of the residuals. Compared with SRTM2, NIGA showed a small, albeit significant, positive bias (ΔBPND = 2.5% ± 3.6%, |ΔBPND| = 3.5% ± 2.6%, P < 0.0001). However, the correlation between the 2 methods was excellent (r2 = 1.00; Fig. 1), the %COV of the error of NIGA being only 2.43% (Table 1). In contrast, linearization of the simplified NIGA plot (i.e., after omitting the k2′ term) occurred considerably later (t* = 40 min; 10 frames included) and led to significantly lower estimates of BPND than did SRTM2 (ΔBPND = −5.0% ± 6.7%, |ΔBPND| = 6.3% ± 5.5%, P < 0.0001; r2 = 0.98; Fig. 1) or NIGA (P < 0.0001). The %COV of the error of simplified NIGA was 6.25% (Table 1).

Regression analyses. BPND estimate provided by SRTM2 served as reference standard (x-axis). Shown are linear regression analyses of BPND estimates yielded by NIGA and simplified NIGA (NIGA-S) (A) and PsEA and PEA (B) (y-axis) against SRTM2.
Figure 2A depicts group-averaged time–activity curves of the caudate nucleus, putamen, and cerebellum of all patients. The peak of specific binding as given by the group-averaged specific binding curves (Fig. 2B) occurred at about 42.5 and 57.5 min after injection in the putamen and caudate nucleus, respectively. Average peak times assessed from noisier individual-difference time–activity curves were 50.5 ± 16.9 min and 56.8 ± 17.5 min, respectively. Thus, we chose a time span of 35–65 min for PEA. The mean changes in individual specific binding curves during this period were 3% ± 32%/h and −2% ± 20%/h for the caudate nucleus and putamen, respectively (not significantly different from zero, 1-sample t test). Compared with SRTM2, BPND estimates given by PEA showed no significant bias (ΔBPND = 0.7% ± 13.0%; P = 0.85). However, variability was high (|ΔBPND| = 10.0% ± 8.2%) and the correlation between SRTM2 and PEA somewhat weaker although still very high (r2 = 0.90; Fig. 1). Consequently, PEA showed the highest %COV of the error compared with SRTM2 for all analyses included (12.62%; Table 1).
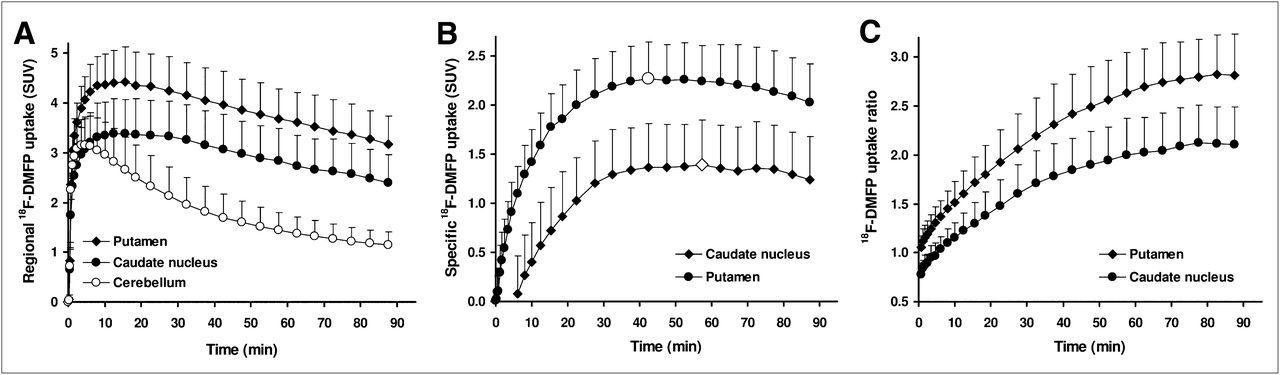
Regional time–activity (A), specific binding (B), and uptake ratio (C) curves. Plotted are mean values (whiskers indicate SD) of all patients. Data are given as standardized uptake values (SUVs; i.e., regional 18F-desmethoxyfallypride (DMFP) uptake normalized by injected dose and body weight). Regional specific binding and uptake ratio curves were calculated using cerebellum as reference region. Time points of peak specific binding are marked by enlarged white symbols.
Figure 2C depicts the group-averaged uptake ratio curves, illustrating near-constant uptake ratios during the final 15–20 min of the 90-min scan (i.e., pseudoequilibration). However, in the 60- to 90-min period selected for PsEA (6,7,10), the mean changes in individual uptake ratio curves were significantly larger than zero (P < 0.005; 11% ± 18%/h and 11% ± 13%/h for the caudate nucleus and putamen, respectively). BPND estimates gained by PsEA were significantly positively biased compared with SRTM2 (P < 0.0001; ΔBPND = |ΔBPND| = 19.0% ± 7.1%) and PEA (P < 0.0001). However, the correlation with SRTM2 was excellent (r2 = 0.98; Fig. 1), and the %COV of the error compared with SRTM2 was low (5.10%; Table 1).
Minimum Scan Time Needed for Kinetic Analyses
Shortening the total scan time resulted in a progressively increasing k2′ estimate given by coupled SRTM analyses compared with the 90-min value (80, 70, 60, 50, and 40 min: 0.075 ± 0.027 [+1.5% ± 3.3%], 0.078 ± 0.026 [+6.0% ± 3.5%], 0.081 ± 0.026 [+10.4% ± 4.6%], 0.086 ± 0.027 [+16.9% ± 6.7%], and 0.093 ± 0.029 [+27.4% ± 16.2%] min−1, respectively). In turn, BPND estimates decreased with progressively shorter scan times (Fig. 3). Again, SRTM2 and MRTM2 yielded virtually identical results, with the mean BPND deviation not exceeding −5% (threshold deemed acceptable) for a total scan duration of 70 min (−3.7% ± 3.8% and −4.1% ± 2.5% for caudate nucleus and putamen, respectively; Fig. 3A). The decrease in BPND associated with shorter scan times was slightly less pronounced for NIGA and still in an acceptable range for a scan time of only 60 min (t* = 17 min, 9 frames included; −2.7% ± 8.6% and −4.8% ± 3.5%, respectively; Fig. 3B). Using a scan time of 70 min resulted in a borderline BPND change for simplified NIGA (t* = 40 min, only 6 frames included; −6.4% ± 5.6% and −4.6% ± 2.7%, respectively; Fig. 3C).

Effect of scan time. Bar diagrams illustrate change of BPND induced by progressive shortening of scan duration for SRTM2 (A), NIGA (B), and simplified NIGA (NIGAS) (C) (scan time was reduced only to minimum of 60 min because start time of linearization was set to 40 min). Given are mean values of all patients (whiskers indicate SD).
DISCUSSION
The present study was undertaken to define the optimal 18F-desmethoxyfallypride PET protocol for clinical routine with regard to quantification accuracy and scan time. In the case of 18F-desmethoxyfallypride PET, reference tissue analyses using the cerebellum as a reference region devoid of specific D2/D3 receptor binding can be used as attractive alternatives to invasive and complex pharmacokinetic analyses relying on arterial blood sampling (9,10). Such reference tissue analyses can broadly be divided into kinetic analyses on one hand (SRTM2, MRTM2, NIGA, and simplified NIGA among others) and so-called single-scan analyses (PsEA and PEA) on the other hand. Both types of analyses offer specific advantages and disadvantages in terms of patient comfort, complexity, and validity of the outcome parameter. In principle, they may all provide valid and well-comparable results if underlying assumptions and prerequisites are met (e.g., regarding study timing, model assumption, and scan duration).
By virtue of their accounting for possible nonspecific influences of tracer delivery to and washout from the brain, kinetic reference tissue analyses can provide highly accurate BPND estimates. Because they avoid error-prone plasma and metabolite analyses, they may also be superior to invasive analyses in terms of precision and thus diagnostic accuracy. Based on earlier studies (9,10), we selected the SRTM2 as the reference standard for the present study. We showed that SRTM2 and MRTM2 (with t* = 0) yield virtually identical results, an observation that agrees with studies on other ligands (12,16,19). Accurate estimation of k2′ is of crucial importance for the implementation of these models. To this end, we used a simultaneous SRTM fit with coupled k2′ including all target regions (21). Of note, the resulting k2′ corresponds excellently to the individual mean k2′ estimate provided by the 3-parameter MRTM (mean difference, −1.1% ± 1.4%, r2 = 0.99), also agreeing with earlier studies (12,16,19). For optimal comparability, we thus used the k2′ estimate from the coupled SRTM also for MRTM2 analyses and NIGA. The latter was additionally motivated by the fact that no population mean k2′ estimate (ideally determined by gold standard invasive analyses) is available from the literature for 18F-desmethoxyfallypride. In contrast to SRTM and simplified NIGA, MRTM2 and NIGA have not previously been used for analyzing 18F-desmethoxyfallypride data. Unlike MRTM2, NIGA was associated with a small, albeit statistically significant, positive bias compared with SRTM2 (ΔBPND = 2.5% ± 3.6%). Among other reasons (including selection of t* in NIGA), this may be due to a violation of the underlying 1-tissue-compartment model (1TCM) assumption of the SRTM. Although Gründer et al. (9) demonstrated that 1TCM and 2TCM analyses gave virtually identical results in striatal target regions, only 1TCM results were reported for the cerebellum. Of note, however, the mean estimate of the total volume of distribution (VT) of the cerebellum gained by invasive graphical analysis was slightly higher than the VT by 1TCM analysis (3.29 vs. 3.11; Table 1 of Gründer et al.). This difference could be due to non-1TCM kinetics in the cerebellum, which may lead to a slight over- and underestimation of the true k2′ and BPND, respectively (16). In contrast, simplified NIGA (i.e., ignoring the k2′ term) was associated with a small negative bias compared with SRTM2 (ΔBPND = −5.0% ± 6.7%), an observation that agrees well with the results of Gründer et al. This is most likely caused by the slow asymptotic, yet not perfect, linearization of the simplified NIGA plot (although we used a relatively late t* of 40 min, compared with the t* of 30 min used by Siessmeier et al. (10)) and the well-known noise-associated negative bias of the graphical analysis (22). More detailed invasive analyses with arterial blood sampling would be needed to unravel these discrepancies. However, the deviation of NIGA and simplified NIGA from SRTM2 probably has only a minor diagnostic impact because they showed an excellent linear correlation with SRTM2 (r2 ≥ 0.98) and a small %COV of the error compared with SRTM2 (2.43% and 6.25%, respectively). In terms of suitability for clinical application, NIGA is superior to simplified NIGA because NIGA allows for a shorter scan time. The scan time–dependent change of BPND was still below 5% for a scan time of only 60 min with NIGA, whereas it exceeded this threshold for a 70-min scan time with simplified NIGA (Fig. 3).
In contrast to the excellent accuracy and precision of the aforementioned kinetic analyses, the single-scan analyses suffered either from a relative low accuracy (PsEA: ΔBPND = 19.0% ± 7.1%, although precision was high: r2 = 0.98 and %COV of the error = 5.10%, compared with SRTM2) or precision (PEA: r2 = 0.90 and %COV of the error = 12.62%, although accuracy was high with ΔBPND = 0.7% ± 13.0%, not different from zero). These findings are not unexpected, because it is well known that PsEA is associated with a positive bias (11,12), whereas PEA can yield accurate BPND estimates if timing is correct (12,13). The latter was ensured in the present study by selecting the time of PEA post hoc using the dynamic data. Consequently, mean changes of specific binding curves were not different from zero. However, interindividual variability was high (3% ± 32%/h and −2% ± 20%/h in the caudate nucleus and putamen, respectively), ultimately translating into high variability of BPND and, thus, low precision of PEA. In turn, the significant increase of the uptake ratio curves (11% ± 18%/h and 11% ± 13%/h, respectively) suggests that true pseudoequilibrium may be attained somewhat later than 60–90 min. However, this is likely of little practical relevance given the high precision and the close-to-equilibrium uptake ratio at 60–90 min already. The major drawback of the single-scan analyses is that the time of peak equilibrium and pseudoequilibrium and the magnitude of inherent bias of PsEA are dependent on nonspecific factors such as cerebral blood flow and peripheral tracer clearance, as well as on receptor availability itself (11–13). Therefore, accurate study timing and possible BPND bias can hardly be predicted in a heterogeneous population of patients in whom underlying diseases and treatments may affect all aforementioned factors to a variable extent. This underlines the superiority of kinetic reference tissue analyses in situations in which one aims to assess subtle longitudinal changes (e.g., therapy trials). Nevertheless, it has to be emphasized that single-scan analyses may enable highly accurate diagnostic decisions between Parkinson disease and atypical parkinsonian syndromes in clinical routine as demonstrated by earlier studies (6,7). Given the high correlation of the single-scan analyses with SRTM2 and the overall small-to-moderate %COV of the error of PsEA and PEA, it is questionable whether the kinetic analyses will perform better in separating patients with atypical parkinsonian syndromes from those with Parkinson disease. Because the patient groups of the present study were small and heterogeneous, we did not pursue a comparison of the diagnostic accuracy of the included methods. However, further prospective studies are clearly warranted.
Compared with kinetic analyses relying on dynamic scanning over a prolonged time, PsEA and PEA offer the advantage of being applicable to only a single static PET scan. However, the dynamic scan of 60–70 min needed for SRTM2, MRTM2, and NIGA is well tolerated by most patients and causes little additional discomfort compared with a waiting period of 60 min plus a 30-min scan. Furthermore, compared with kinetic analyses, PsEA and PEA involve the simple determination of a target–to–reference-region uptake ratio, which is clearly less complex and time-consuming than kinetic analyses. However, several user-friendly software packages such as the one used in the present study have been proposed that allow for highly standardized volume-of-interest analyses, time–activity curve generation, and kinetic analyses. Once a workflow is established, kinetic analyses can be accomplished by a trained user within 10–15 min. Finally, though not addressed in the present study, kinetic analyses such as SRTM2 and MRTM2 also provide an estimate of relative ligand delivery (R1) that is proportional to relative cerebral blood flow and may thus serve as a diagnostically useful marker of regional neuronal activity and neurodegeneration (23,24).
CONCLUSION
Kinetic reference tissue model analyses of 18F-desmethoxyfallypride PET data offer the least-biased results at a well-tolerable scan duration and should thus be pursued whenever possible. Single-scan analyses may be a pragmatic alternative that, however, suffers from a relevant positive bias (PsEA) or limited precision (PEA).
DISCLOSURE STATEMENT
The costs of publication of this article were defrayed in part by the payment of page charges. Therefore, and solely to indicate this fact, this article is hereby marked “advertisement” in accordance with 18 USC section 1734.
Acknowledgments
We thank Werner Vach, head of the Department of Clinical Epidemiology, Institute of Medical Biometry and Medical Informatics, University of Freiburg, for valuable discussions and suggestions on the statistical analyses. This work was supported by an institutional grant by the Medical Faculty of the University of Freiburg. No other potential conflict of interest relevant to this article was reported.
Footnotes
Published online Aug. 16, 2012.
↵* Contributed equally to this work.
- © 2012 by the Society of Nuclear Medicine and Molecular Imaging, Inc.
REFERENCES
- Received for publication January 30, 2012.
- Accepted for publication May 15, 2012.


Jump to section
Related Articles
Cited By...
- No citing articles found.