
Main menu

  • Home
  • Content
    • Current
    • Ahead of print
    • Past Issues
    • JNM Supplement
    • SNMMI Annual Meeting Abstracts
    • Continuing Education
    • JNM Podcasts
  • Subscriptions
    • Subscribers
    • Institutional and Non-member
    • Rates
    • Journal Claims
    • Corporate & Special Sales
  • Authors
    • Submit to JNM
    • Information for Authors
    • Assignment of Copyright
    • AQARA requirements
  • Info
    • Reviewers
    • Permissions
    • Advertisers
  • About
    • About Us
    • Editorial Board
    • Contact Information
  • More
    • Alerts
    • Feedback
    • Help
    • SNMMI Journals
  • SNMMI
    • JNM
    • JNMT
    • SNMMI Journals
    • SNMMI

User menu

  • Subscribe
  • My alerts
  • Log in
  • Log out
  • My Cart

Search

  • Advanced search
Journal of Nuclear Medicine
  • SNMMI
    • JNM
    • JNMT
    • SNMMI Journals
    • SNMMI
  • Subscribe
  • My alerts
  • Log in
  • Log out
  • My Cart
Journal of Nuclear Medicine

Advanced Search

  • Home
  • Content
    • Current
    • Ahead of print
    • Past Issues
    • JNM Supplement
    • SNMMI Annual Meeting Abstracts
    • Continuing Education
    • JNM Podcasts
  • Subscriptions
    • Subscribers
    • Institutional and Non-member
    • Rates
    • Journal Claims
    • Corporate & Special Sales
  • Authors
    • Submit to JNM
    • Information for Authors
    • Assignment of Copyright
    • AQARA requirements
  • Info
    • Reviewers
    • Permissions
    • Advertisers
  • About
    • About Us
    • Editorial Board
    • Contact Information
  • More
    • Alerts
    • Feedback
    • Help
    • SNMMI Journals
  • View or Listen to JNM Podcast
  • Visit JNM on Facebook
  • Join JNM on LinkedIn
  • Follow JNM on Twitter
  • Subscribe to our RSS feeds
Meeting ReportInstrumentation & Data Analysis: Data Analysis & Management

Variations in SUV values with reconstruction algorithms

Bing Bai, Michal Kulon and Peter Esser
Journal of Nuclear Medicine May 2011, 52 (supplement 1) 2100;
Bing Bai
1Radiology, Columbia University, New York, NY
  • Find this author on Google Scholar
  • Find this author on PubMed
  • Search for this author on this site
Michal Kulon
1Radiology, Columbia University, New York, NY
  • Find this author on Google Scholar
  • Find this author on PubMed
  • Search for this author on this site
Peter Esser
1Radiology, Columbia University, New York, NY
  • Find this author on Google Scholar
  • Find this author on PubMed
  • Search for this author on this site
  • Article
  • Figures & Data
  • Info & Metrics
Loading

Abstract

2100

Objectives We compared the mean and maximum standard uptake values (SUVs) measured from PET images reconstructed with FBP, and OSEM, with and without point spread function (PSF) modeling, using both phantom and patient data.

Methods A 14 cm inner diameter (ID) cylindrical phantom with 7 fillable spherical inserts (ID 0.5-3.1 cm) was scanned using a 64 slice PET/CT scanner. A circular 2D region of interest (ROI) was drawn manually at the center of each sphere in the transaxial slice on the coregistered CT image. Activity was measured using a dose calibrator to calculate true SUV values (2.57/1.03 sphere/background). Three patient PET/CT scans with well-delineated lung tumors were reconstructed. ROIs were drawn based on a clinical protocol which selects the voxels exceed 50% of the maximum SUV in each tumor.

Results Differences between FBP and OSEM were small for all measurements. PSF-OSEM had higher SUV values related to the resolution recovery and the edge artifacts, that enhance the image values near the sharp edges in the image. The maximum SUV from phantom PSF-OSEM image may over-estimate the value (up to 9%, measured with the 1.5 cm ID sphere). For patient data, the PSF-OSEM SUVs were considerably higher (10-20%) than FBP and OSEM. The relative differences of mean SUVs between PSF-OSEM and FBP were larger for patient data than the phantom data, probably as a result of the different ROI sizes with each reconstruction algorithm.

Conclusions Mean and maximum SUV measured from FBP and OSEM images were similar, while PSF-OSEM values were significantly higher. Based on this data, for tumors between 1-3 cm in diameter, using the maximum SUV may overestimate the SUV value with PSF-OSEM

Figure
  • Download figure
  • Open in new tab
  • Download powerpoint

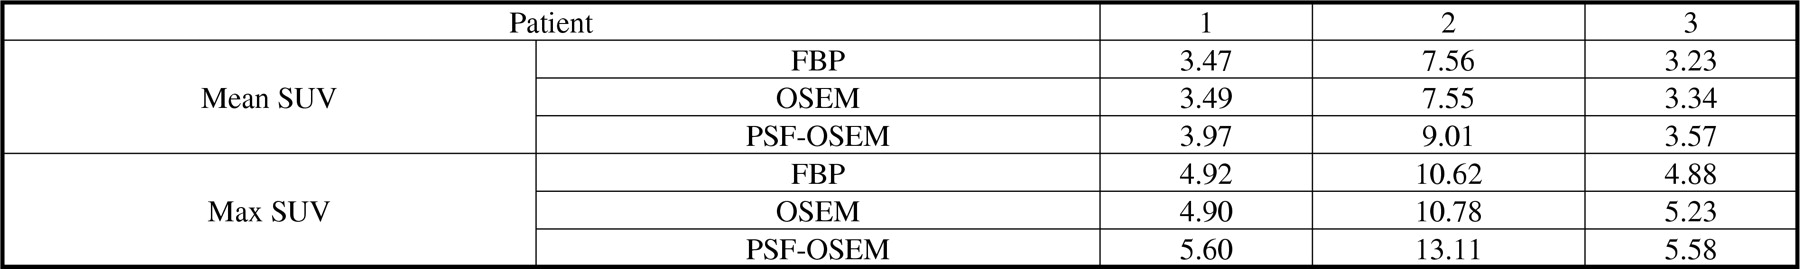
Mean and Maximum SUV of patient data

Back to top

In this issue

Journal of Nuclear Medicine
Vol. 52, Issue supplement 1
May 2011
  • Table of Contents
  • Index by author
Article Alerts
Sign In to Email Alerts with your Email Address
Email Article

Thank you for your interest in spreading the word on Journal of Nuclear Medicine.

NOTE: We only request your email address so that the person you are recommending the page to knows that you wanted them to see it, and that it is not junk mail. We do not capture any email address.

Enter multiple addresses on separate lines or separate them with commas.
Variations in SUV values with reconstruction algorithms
(Your Name) has sent you a message from Journal of Nuclear Medicine
(Your Name) thought you would like to see the Journal of Nuclear Medicine web site.
Citation Tools
Variations in SUV values with reconstruction algorithms
Bing Bai, Michal Kulon, Peter Esser
Journal of Nuclear Medicine May 2011, 52 (supplement 1) 2100;

Citation Manager Formats

  • BibTeX
  • Bookends
  • EasyBib
  • EndNote (tagged)
  • EndNote 8 (xml)
  • Medlars
  • Mendeley
  • Papers
  • RefWorks Tagged
  • Ref Manager
  • RIS
  • Zotero
Share
Variations in SUV values with reconstruction algorithms
Bing Bai, Michal Kulon, Peter Esser
Journal of Nuclear Medicine May 2011, 52 (supplement 1) 2100;
Twitter logo Facebook logo LinkedIn logo Mendeley logo
  • Tweet Widget
  • Facebook Like
  • Google Plus One
Bookmark this article

Jump to section

  • Article
  • Figures & Data
  • Info & Metrics

Related Articles

  • No related articles found.
  • Google Scholar

Cited By...

  • No citing articles found.
  • Google Scholar

More in this TOC Section

Instrumentation & Data Analysis: Data Analysis & Management

  • Comparing FDG quantification in tumors with the retention fraction and SUV in a dual scan examination after 60 and 90 minutes
  • Usefulness of dynamic FDG PET/CT for the evaluation of liver tumor
Show more Instrumentation & Data Analysis: Data Analysis & Management

Data Analysis and Management Posters

  • Extension of the MIAKAT analysis software package to non-brain and pre-clinical PET analysis.
  • Robustness of radiomic features in 18F-FDG PET/CT imaging of Nasopharyngeal Carcinoma: impact of parameter settings on different feature matrices
  • Automated Internal Dosimetry Research Tool Using Quantitative SPECT for the Lu177 Theranostic Application
Show more Data Analysis and Management Posters

Similar Articles

SNMMI

© 2025 SNMMI

Powered by HighWire