
Main menu

  • Home
  • Content
    • Current
    • Ahead of print
    • Past Issues
    • JNM Supplement
    • SNMMI Annual Meeting Abstracts
    • Continuing Education
    • JNM Podcasts
  • Subscriptions
    • Subscribers
    • Institutional and Non-member
    • Rates
    • Journal Claims
    • Corporate & Special Sales
  • Authors
    • Submit to JNM
    • Information for Authors
    • Assignment of Copyright
    • AQARA requirements
  • Info
    • Reviewers
    • Permissions
    • Advertisers
  • About
    • About Us
    • Editorial Board
    • Contact Information
  • More
    • Alerts
    • Feedback
    • Help
    • SNMMI Journals
  • SNMMI
    • JNM
    • JNMT
    • SNMMI Journals
    • SNMMI

User menu

  • Subscribe
  • My alerts
  • Log in
  • Log out
  • My Cart

Search

  • Advanced search
Journal of Nuclear Medicine
  • SNMMI
    • JNM
    • JNMT
    • SNMMI Journals
    • SNMMI
  • Subscribe
  • My alerts
  • Log in
  • Log out
  • My Cart
Journal of Nuclear Medicine

Advanced Search

  • Home
  • Content
    • Current
    • Ahead of print
    • Past Issues
    • JNM Supplement
    • SNMMI Annual Meeting Abstracts
    • Continuing Education
    • JNM Podcasts
  • Subscriptions
    • Subscribers
    • Institutional and Non-member
    • Rates
    • Journal Claims
    • Corporate & Special Sales
  • Authors
    • Submit to JNM
    • Information for Authors
    • Assignment of Copyright
    • AQARA requirements
  • Info
    • Reviewers
    • Permissions
    • Advertisers
  • About
    • About Us
    • Editorial Board
    • Contact Information
  • More
    • Alerts
    • Feedback
    • Help
    • SNMMI Journals
  • View or Listen to JNM Podcast
  • Visit JNM on Facebook
  • Join JNM on LinkedIn
  • Follow JNM on Twitter
  • Subscribe to our RSS feeds
Research ArticleClinical Investigation

Contribution of SPECT Measurements of D2 and 5-HT2A Occupancy to the Clinical Development of the Antipsychotic SB-773812

Ana M. Catafau, Santiago Bullich, Gianluca Nucci, Clare Burgess, Frank Gray, Emilio Merlo-Pich and on behalf of the Barcelona Clinical Imaging in Psychiatry Group
Journal of Nuclear Medicine April 2011, 52 (4) 526-534; DOI: https://doi.org/10.2967/jnumed.110.081885
Ana M. Catafau
  • Find this author on Google Scholar
  • Find this author on PubMed
  • Search for this author on this site
Santiago Bullich
  • Find this author on Google Scholar
  • Find this author on PubMed
  • Search for this author on this site
Gianluca Nucci
  • Find this author on Google Scholar
  • Find this author on PubMed
  • Search for this author on this site
Clare Burgess
  • Find this author on Google Scholar
  • Find this author on PubMed
  • Search for this author on this site
Frank Gray
  • Find this author on Google Scholar
  • Find this author on PubMed
  • Search for this author on this site
Emilio Merlo-Pich
  • Find this author on Google Scholar
  • Find this author on PubMed
  • Search for this author on this site
  • Article
  • Figures & Data
  • Info & Metrics
  • PDF
Loading

Article Figures & Data

Figures

  • Tables
  • FIGURE 1.
    • Download figure
    • Open in new tab
    • Download powerpoint
    FIGURE 1.

    Selected MRI and coregistered SPECT slices at basal ganglia level (top and middle rows) and at cerebellum level (bottom row), showing representative ROIs drawn on basal ganglia and occipital cortex for D2 quantification (top row) and on cortical regions and cerebellum for 5-HT2A quantification (middle and bottom rows). IBZM = iodobenzamide.

  • FIGURE 2.
    • Download figure
    • Open in new tab
    • Download powerpoint
    FIGURE 2.

    Individual values of D2 and 5-HT2A occupancy from study A. 5-HT2A occupancy values are mean of all cortical regions.

  • FIGURE 3.
    • Download figure
    • Open in new tab
    • Download powerpoint
    FIGURE 3.

    Coregistered SPECT/MR images from representative healthy volunteers (study A, left) and patients with schizophrenia (studies B [right top] and C [right bottom]). Percentages of D2 and 5-HT2A occupancy values are shown for each individual case. 5-HT2A occupancy values are mean of all cortical regions.

  • FIGURE 4.
    • Download figure
    • Open in new tab
    • Download powerpoint
    FIGURE 4.

    Individual 5-HT2A occupancy data from studies A and B and corresponding Emax model fitting. Dashed lines correspond to 95% confidence interval. 5-HT2A occupancy values are mean of all cortical regions.
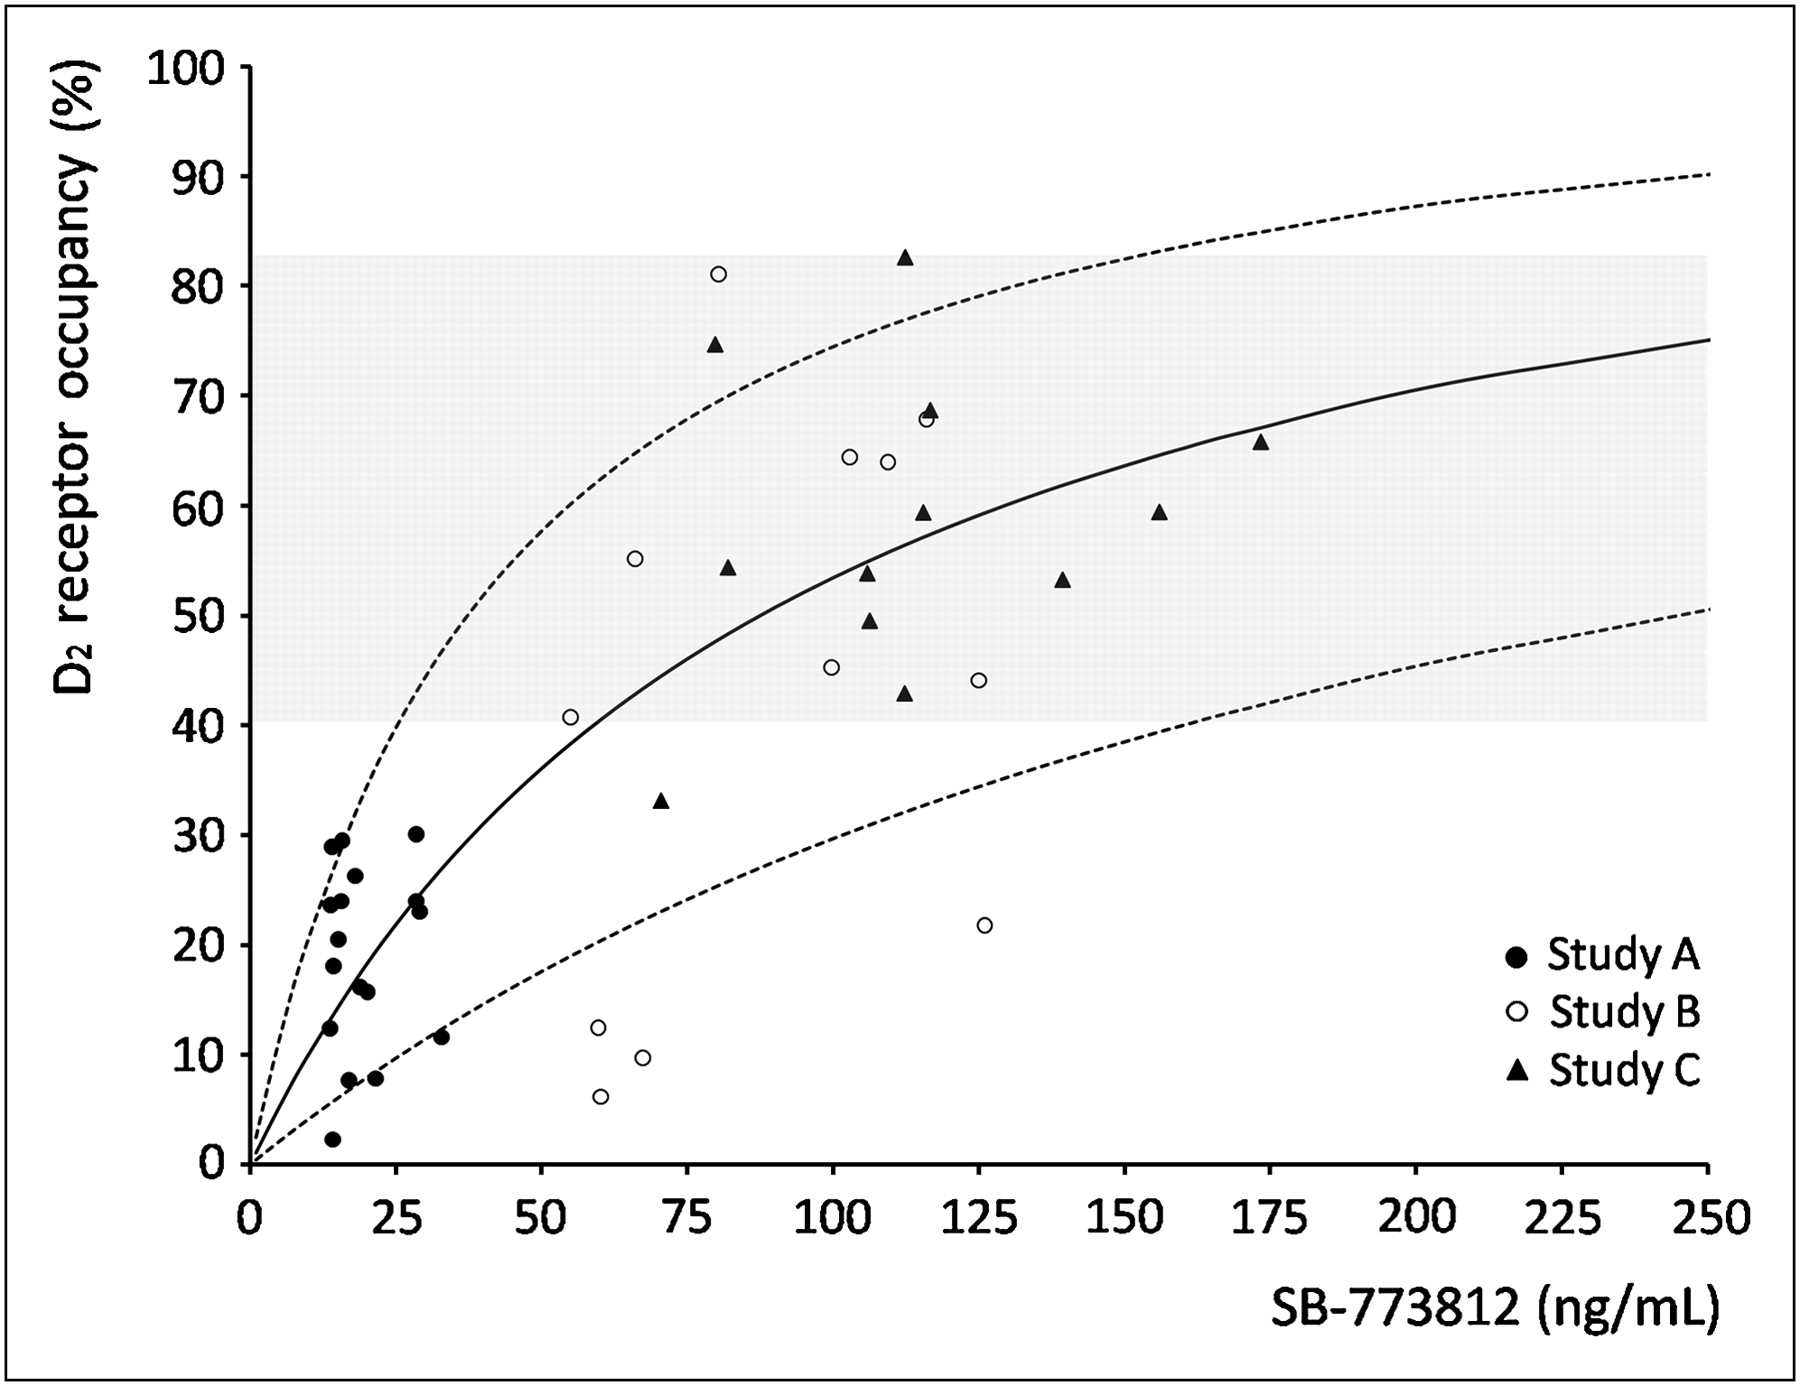
  • FIGURE 5.
    • Download figure
    • Open in new tab
    • Download powerpoint
    FIGURE 5.

    Individual D2 occupancy data from studies A, B, and C with corresponding Emax model fitting. Dashed lines correspond to 95% confidence interval.

  • FIGURE 6.
    • Download figure
    • Open in new tab
    • Download powerpoint
    FIGURE 6.

    Individual D2 occupancy values at Tmax and Ttrough from subjects in study C. Dashed lines correspond to patients on risperidone.

Tables

  • Figures
    • View popup
    TABLE 1

    Summary of Human SPECT Studies Performed to Contribute to SB-773812 Development

    Study A, healthy volunteers (n = 27; all men; 26 ± 5 y)Study B, patients with chronic schizophrenia (n = 14; 10 men; 33 ± 7 y)Study C, patients with exacerbated schizophrenia ± (n = 12; all men; 36 ± 8 y)
    ParameterCohort 1 (n = 9)Cohort 2 (n = 9)Cohort 3 (n = 9)
    SB-773812 dose48 mg (single)56 mg (single)56 mg (single)56 mg/d, 16–18 d (steady state)100 mg/d, 18–21 d (n = 9)
    Risperidone dose6 mg/d (n = 3)
    Target (receptor)D2D25-HT2AD2 + 5-HT2AD2
    Scans (2/subject, 48 h apart)Baseline postdosePostdose 123I-iodobenzamide, postdose 123I-R91150Postdose Cmax, postdose Ctrough
    Scan time after doseTmax (6 ± 2 h) (n = 5/cohort), Ttrough (24 ± 4 h) (n = 4/cohort)12 ± 4 hTmax (6 ± 2 h) (n = 10), Ttrough (24 ± 4 h) (n = 8)
    % receptor occupancy formula (×100)(1 − [SURpostdose/SURbaseline])(1 − [SURpostdose/SURHV])(1 − [SURpostdose/SURHV])
    Plasma concentration over time (pharmacokinetics)YesYesYes
    • HV = healthy volunteers.

    • View popup
    TABLE 2

    Mean D2 Occupancy and Plasma Concentrations Measured Over Time in Studies A, B, and C

    StudyDrugDrug dosePlasma concentration during scan∼Tmax (ng/mL)% D2 occupancy at Tmax (6 ± 2 h)Plasma concentration during scan∼Ttrough (ng/mL)% D2 occupancy at Ttrough (24 ± 4 h)
    ASB-77381248/56 mg21.0 ± 6.7 (n = 10)16.4 ± 8.4 (n = 10)17.8 ± 5.3 (n = 8)21.3 ± 7.8 (n = 4)
    BSB-77381256 mg/d89.0 ± 27.1 (n = 12)42.7 ± 25.2 (n = 12)NANA
    CSB-773812100 mg/d125.1 ± 23.7 (n = 7)60.3 ± 13.3 (n = 7)98.8 ± 34.5 (n = 5)55.1 ± 14.9 (n = 5)
    Risperidone6 mg/d55.5 ± 31.9 (n = 3)83.6 ± 3.4 (n = 3)26.1 ± 20.0 (n = 3)64.4 ± 3.6 (n = 3)
    • Risperidone plasma concentration reported as active moiety (i.e., risperidone + 9-OH-risperidone).

    • NA = not available.

    • View popup
    TABLE 3

    Estimated EC50 Values (Mean ± SE) for Both D2 and 5-HT2A Receptor Targets with Between-Subject Variability from Each Study and from All Studies Pooled Together

    ParameterStudy AStudy BStudy CPooled
    EC50 for D2 (ng/mL)90.7 ± 63.898.3 ± 15.681.2 ± 8.992.7 ± 13.5
    Between-subject variability in D2 EC50NA82%45%73%
    EC50 for 5-HT2A (ng/mL)2.3 ± 0.41.6 ± 0.8NA2.1 ± 0.5
    Between-subject variability in 5-HT2A EC5056%147%NA71%
    • NA = not available.

PreviousNext
Back to top

In this issue

Journal of Nuclear Medicine: 52 (4)
Journal of Nuclear Medicine
Vol. 52, Issue 4
April 1, 2011
  • Table of Contents
  • Table of Contents (PDF)
  • About the Cover
  • Index by author
Print
Download PDF
Article Alerts
Sign In to Email Alerts with your Email Address
Email Article

Thank you for your interest in spreading the word on Journal of Nuclear Medicine.

NOTE: We only request your email address so that the person you are recommending the page to knows that you wanted them to see it, and that it is not junk mail. We do not capture any email address.

Enter multiple addresses on separate lines or separate them with commas.
Contribution of SPECT Measurements of D2 and 5-HT2A Occupancy to the Clinical Development of the Antipsychotic SB-773812
(Your Name) has sent you a message from Journal of Nuclear Medicine
(Your Name) thought you would like to see the Journal of Nuclear Medicine web site.
Citation Tools
Contribution of SPECT Measurements of D2 and 5-HT2A Occupancy to the Clinical Development of the Antipsychotic SB-773812
Ana M. Catafau, Santiago Bullich, Gianluca Nucci, Clare Burgess, Frank Gray, Emilio Merlo-Pich, on behalf of the Barcelona Clinical Imaging in Psychiatry Group
Journal of Nuclear Medicine Apr 2011, 52 (4) 526-534; DOI: 10.2967/jnumed.110.081885

Citation Manager Formats

  • BibTeX
  • Bookends
  • EasyBib
  • EndNote (tagged)
  • EndNote 8 (xml)
  • Medlars
  • Mendeley
  • Papers
  • RefWorks Tagged
  • Ref Manager
  • RIS
  • Zotero
Share
Contribution of SPECT Measurements of D2 and 5-HT2A Occupancy to the Clinical Development of the Antipsychotic SB-773812
Ana M. Catafau, Santiago Bullich, Gianluca Nucci, Clare Burgess, Frank Gray, Emilio Merlo-Pich, on behalf of the Barcelona Clinical Imaging in Psychiatry Group
Journal of Nuclear Medicine Apr 2011, 52 (4) 526-534; DOI: 10.2967/jnumed.110.081885
Twitter logo Facebook logo LinkedIn logo Mendeley logo
  • Tweet Widget
  • Facebook Like
  • Google Plus One
Bookmark this article

Jump to section

  • Article
    • Abstract
    • MATERIALS AND METHODS
    • RESULTS
    • DISCUSSION
    • CONCLUSION
    • APPENDIX
    • Acknowledgments
    • REFERENCES
  • Figures & Data
  • Info & Metrics
  • PDF

Related Articles

  • This Month in JNM
  • PubMed
  • Google Scholar

Cited By...

  • No citing articles found.
  • Google Scholar

More in this TOC Section

  • First-in-Human Study of 18F-Labeled PET Tracer for Glutamate AMPA Receptor [18F]K-40: A Derivative of [11C]K-2
  • Detection of HER2-Low Lesions Using HER2-Targeted PET Imaging in Patients with Metastatic Breast Cancer: A Paired HER2 PET and Tumor Biopsy Analysis
  • [11C]Carfentanil PET Whole-Body Imaging of μ-Opioid Receptors: A First in-Human Study
Show more Clinical Investigation

Similar Articles

SNMMI

© 2025 SNMMI

Powered by HighWire