


Article Figures & Data
Figures
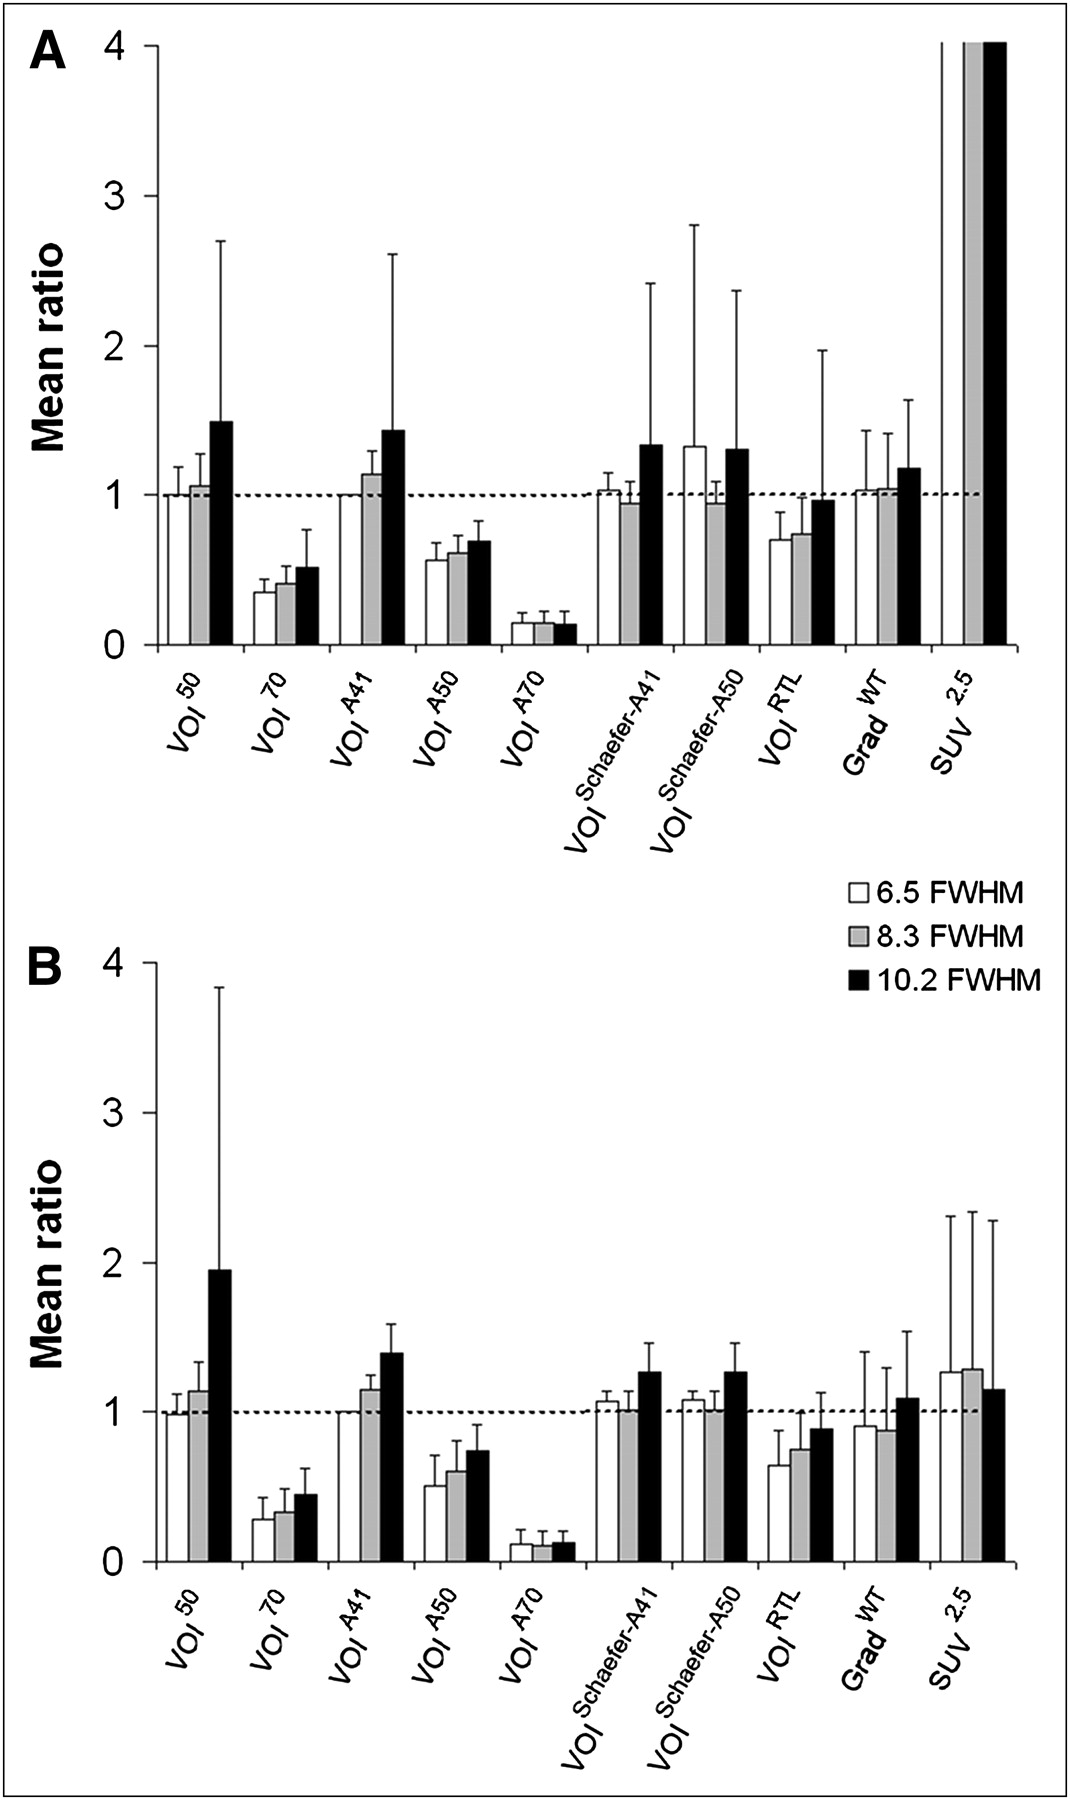
- FIGURE 1.
Mean ratio of tumor volume obtained with various tumor delineation methods against defined reference standard (sum of last 3 frames and 6.5 mm FWHM) as function of image resolution for 18F-FDG (A) and 18F-FLT (B). All bars cut off at 4 (indicated by absence of SD bars) were higher than 20. Error bars represent SD.
- FIGURE 2.
Mean ratio of tumor volume obtained with various tumor delineation methods against defined reference standard (sum of last 3 frames and 6.5 mm FWHM) as function of image contrasts for 18F-FDG (A) and 18F-FLT (B). All bars cut off at 4 (indicated by absence of SD bars) were higher than 20. Error bars represent SD.
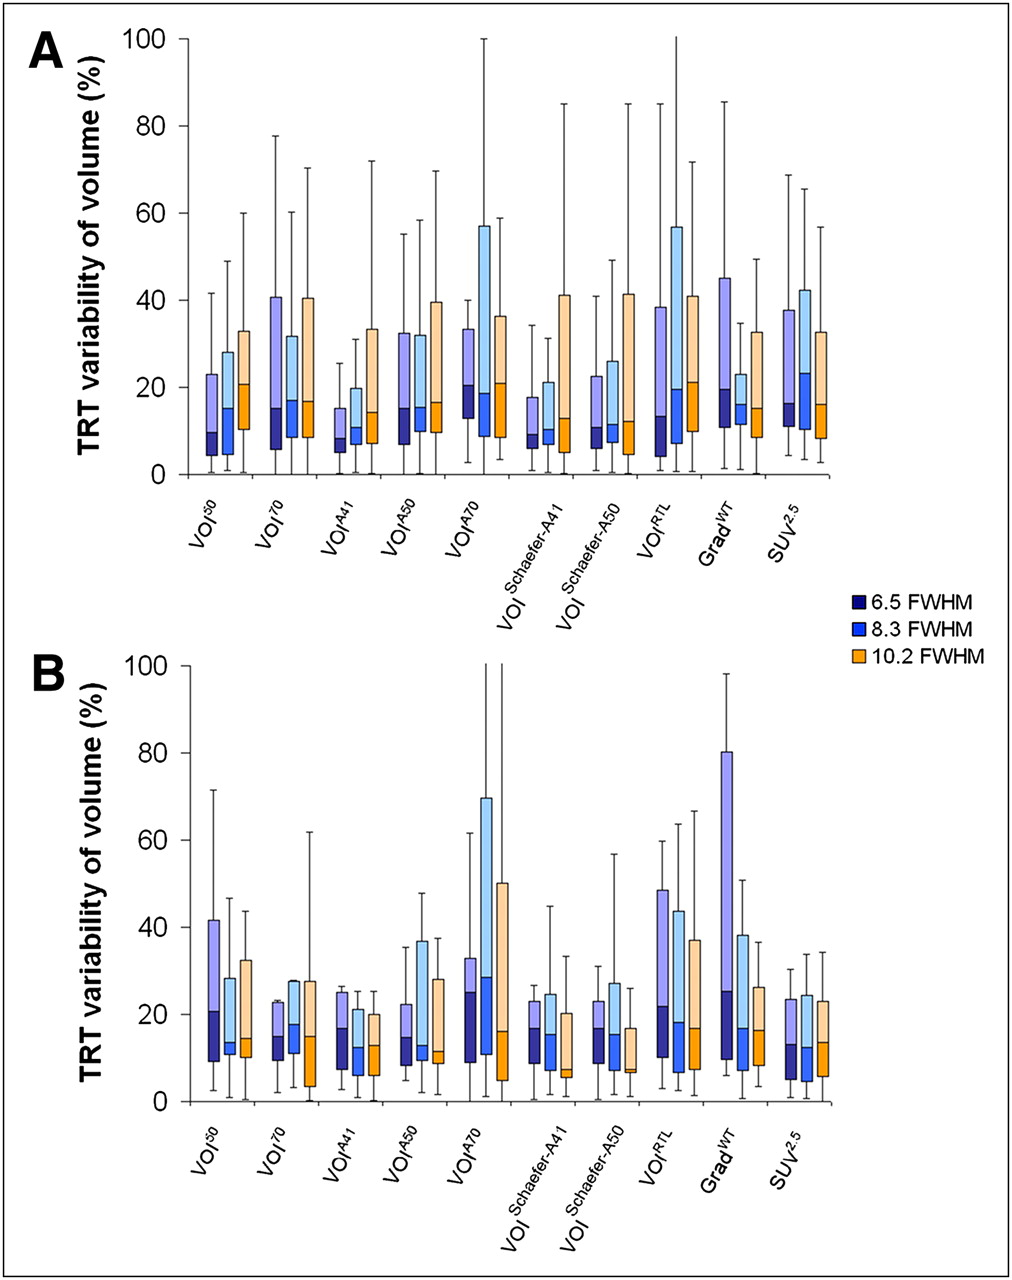
- FIGURE 3.
Box-and-whisker plots of percentage test–retest (TRT)variability in tumor volume obtained using various tumor delineation methods at high image contrast and varying image resolutions for 18F-FDG (A) and 18F-FLT (B). Median is horizontal line between lower (first) and upper (third) quartiles. Upper whisker represents upper quartile to maximum value, corrected for outliers (not exceeding 1.5 times interquartile range).
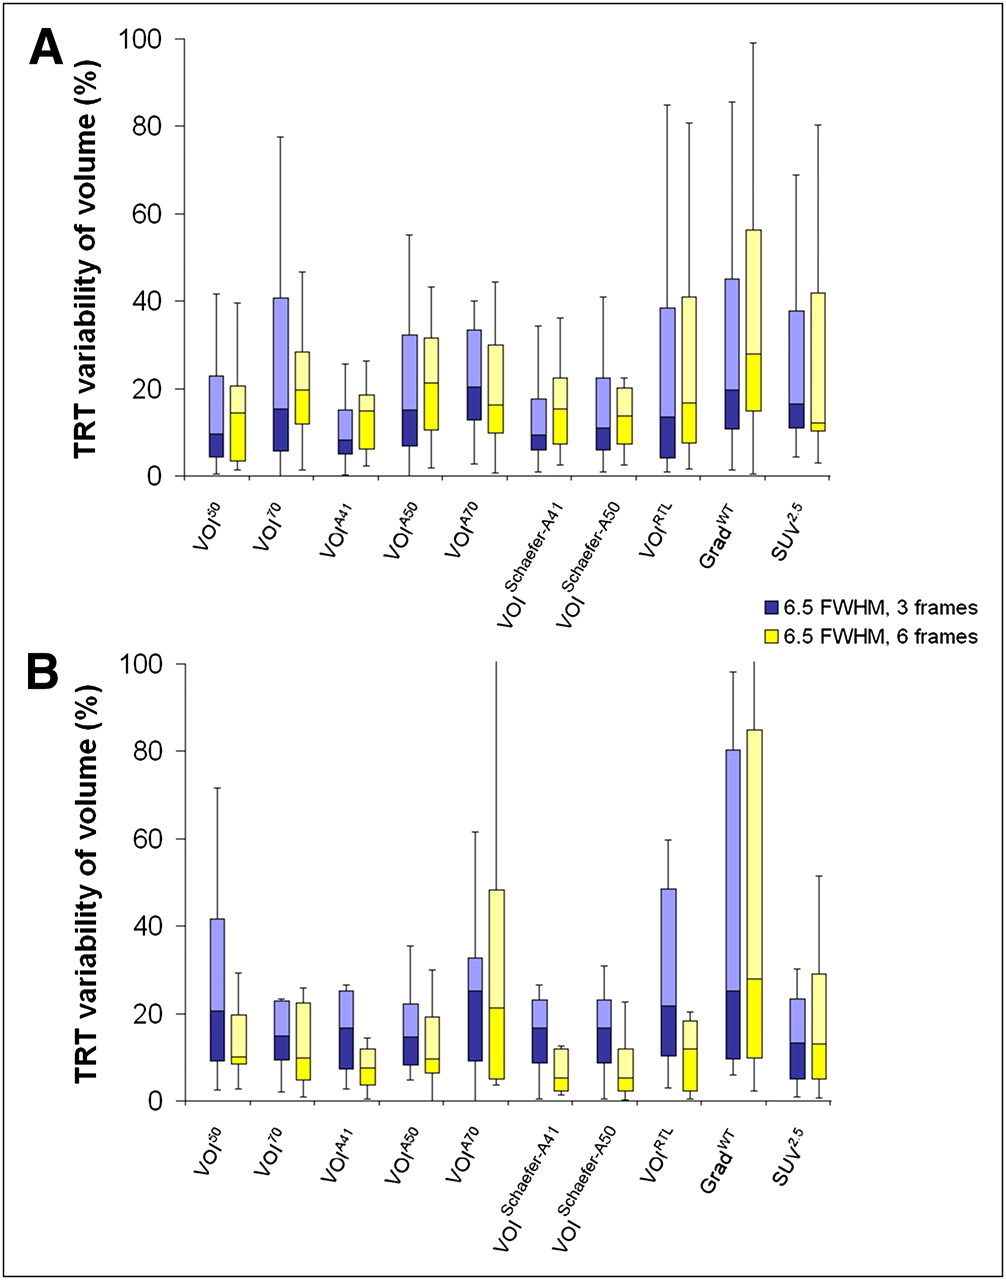
- FIGURE 4.
Box-and-whisker plots of percentage test–retest (TRT) variability of tumor volume obtained by various tumor delineation methods when using different image contrasts for 18F-FDG (A) and 18F-FLT (B). Median is horizontal line between lower (first) and upper (third) quartiles. Upper whisker represents upper quartile to maximum value, corrected for outliers (not exceeding 1.5 times interquartile range).
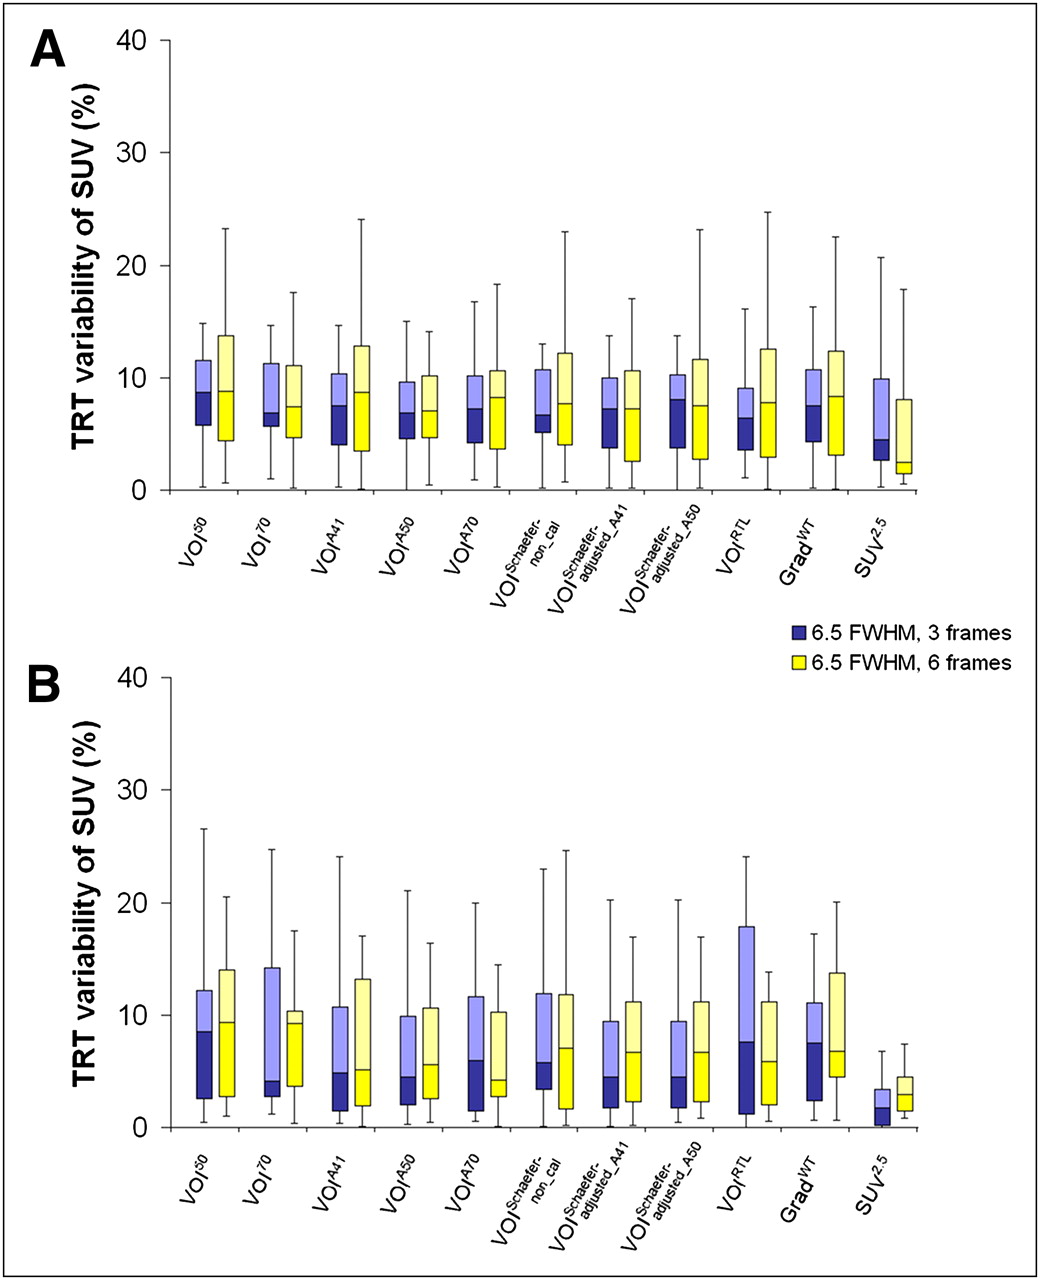
- FIGURE 5.
Box plots of percentage test–retest (TRT) variability of SUV obtained by various tumor delineation methods at high image contrast when image resolutions were varied for 18F-FDG (A) and 18F-FLT (B). Median is horizontal line between lower (first) and upper (third) quartiles. Upper whisker represents upper quartile to maximum value, corrected for outliers (not exceeding 1.5 times interquartile range). Note that scale differs from Figure 3.
- FIGURE 6.
Box plots of percentage test–retest (TRT) variability of SUV obtained by various tumor delineation methods when different image contrasts were used for 18F-FDG (A) and 18F-FLT (B). Median is horizontal line between lower (first) and upper (third) quartiles. Upper whisker represents upper quartile to maximum value, corrected for outliers (not exceeding 1.5 times interquartile range). Note that scale differs from Figure 4.


Tables
- TABLE 1
Number of Outliers When Determining Tumor Volume for All Scans (Test and Retest) for Different Image Characteristics and Radiotracers
18F-FDG 18F-FLT Sum of last 6 frames Sum of last 3 frames Sum of last 6 frames Sum of last 3 frames Tumor delineation method 6.5* 8.3* 10.2* 6.5 8.3 10.2 6.5 8.3 10.2 6.5 8.3 10.2 VOI50 12 14 15 8 13 14 7 4 5 7 5 4 VOI70 0 2 3 0 0 2 0 0 0 1 0 0 VOIA41 6 10 12 6 6 11 3 3 3 4 5 4 VOIA50 2 3 3 0 0 2 1 0 0 2 0 0 VOIA70 0 0 0 0 0 0 1 0 0 1 0 0 VOISchaefer-A41 6 3 6 6 3 4 2 1 3 4 2 3 VOISchaefer-A50 5 5 4 4 3 4 2 1 1 4 2 2 VOIRTL 0 3 2 0 0 1 0 0 0 1 0 0 GradWT 0 0 2 0 0 2 0 0 1 0 1 1 SUV2.5 12 11 11 5 3 6 3 0 1 2 1 0 Total detectable lesions 60 60 60 60 60 60 35 33 32 36 34 31 * Image resolution (mm).
- TABLE 2
Slope (with Intercept Fixed to 0) and Coefficient of Determination Between Tumor Volume Size Measured for Test and Retest Studies
18F-FDG 18F-FLT Tumor delineation method R2 Slope R2 Slope VOI50 0.79 0.71 0.93 0.83 VOI70 0.89 0.99 0.52 1.52 VOI70 (reduced dataset) — — 0.81* 1.21* VOIA41 0.91 0.90 0.91 0.82 VOIA50 0.94 0.93 0.91 1.06 VOIA70 0.88 1.11 0.72 0.91 VOISchaefer-A41 1.00 1.01 0.96 0.79 VOISchaefer-A50 0.92 0.83 0.95 0.76 VOIRTL 0.95 0.93 0.90 1.04 GradWT 0.58 1.34 0.41 1.02 GradWT (reduced dataset) 0.86† 0.94† 0.70‡ 1.10‡ SUV2.5 0.97 1.11 0.99 0.86 * After removing 2 outliers.
† After removing 5 outliers.
‡ After removing 3 outliers.


