


Article Figures & Data
Figures
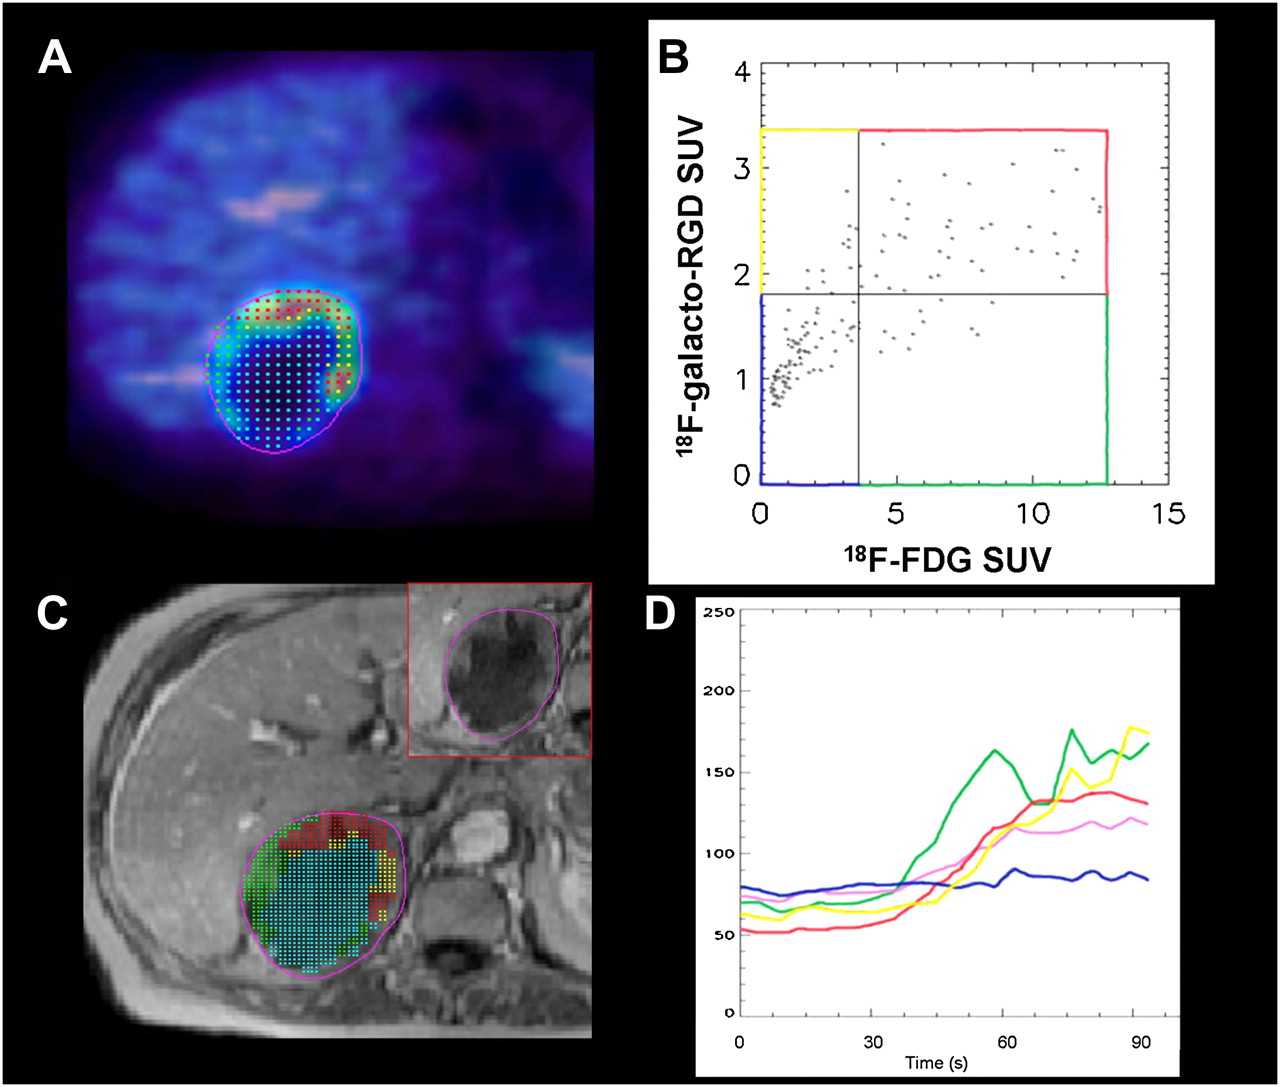
- FIGURE 1.
Image analysis using our custom software tool, showing large metastasis from NSCLC of right adrenal gland. (A) Different image sets are opened simultaneously in separate windows. After manual image fusion of 18F-FDG (multicolor scale) and 18F-galacto-RGD PET (blue–white scale), ROI covering total tumor area is defined in fused PET dataset (A: magenta line). (B) Scatterplot shows distribution of SUVs within this ROI on pixel-by-pixel basis. Different tumor areas are defined by preset thresholds for 18F-FDG and 18F-galacto-RGD uptake on x- and y-axes, respectively (blue: RGD−/FDG−, green: RGD+/FDG−, yellow: RGD−/FDG+, and red: RGD+/FDG+). (C) Different areas are then copied to MR image set (blue: RGD−/FDG−, green: RGD+/FDG−, yellow: RGD−/FDG+, and red: RGD+/FDG+; inset shows tumor without overlay of different color-coded areas). (D) Intensity–time curves of DCE MRI data are subsequently derived for these different tumor areas. Central blue area with low tracer uptake (FDG−/RGD−) shows only slight contrast enhancement (blue line), whereas areas with higher tracer uptake (yellow, green, and red lines) show more rapid and intense enhancement. Magenta line represents results for whole-tumor ROI.
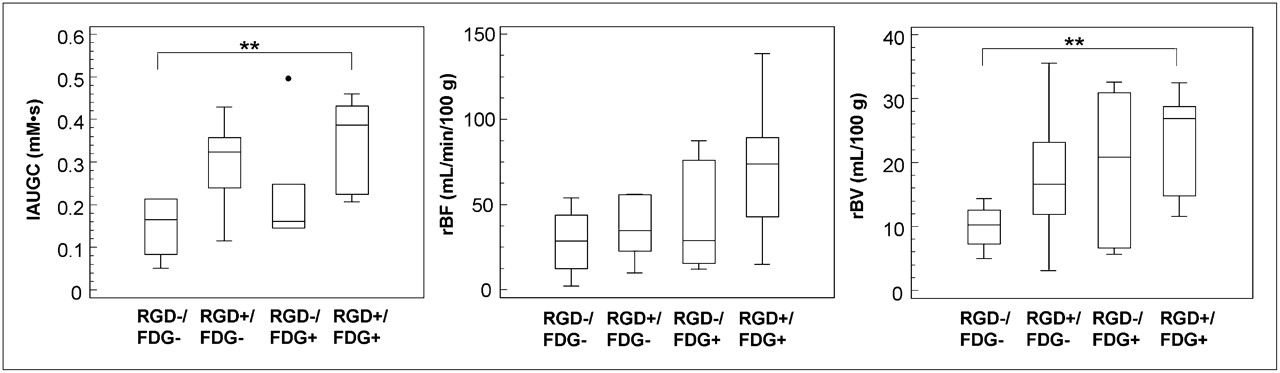
- FIGURE 2.
Box-and-whisker graphs (central box: values from 25th to 75th percentiles, middle line: median) for functional MRI parameters, divided according to PET data into different tumor regions (combined analysis of 18F-FDG and 18F-galacto-RGD uptake using image fusion). Tumor regions with high uptake for both tracers (RGD+/FDG+) show higher functional MRI data than do less tracer-avid tumor regions (RGD−/FDG−); difference is significant for initial AUC and rBV (**P < 0.01).
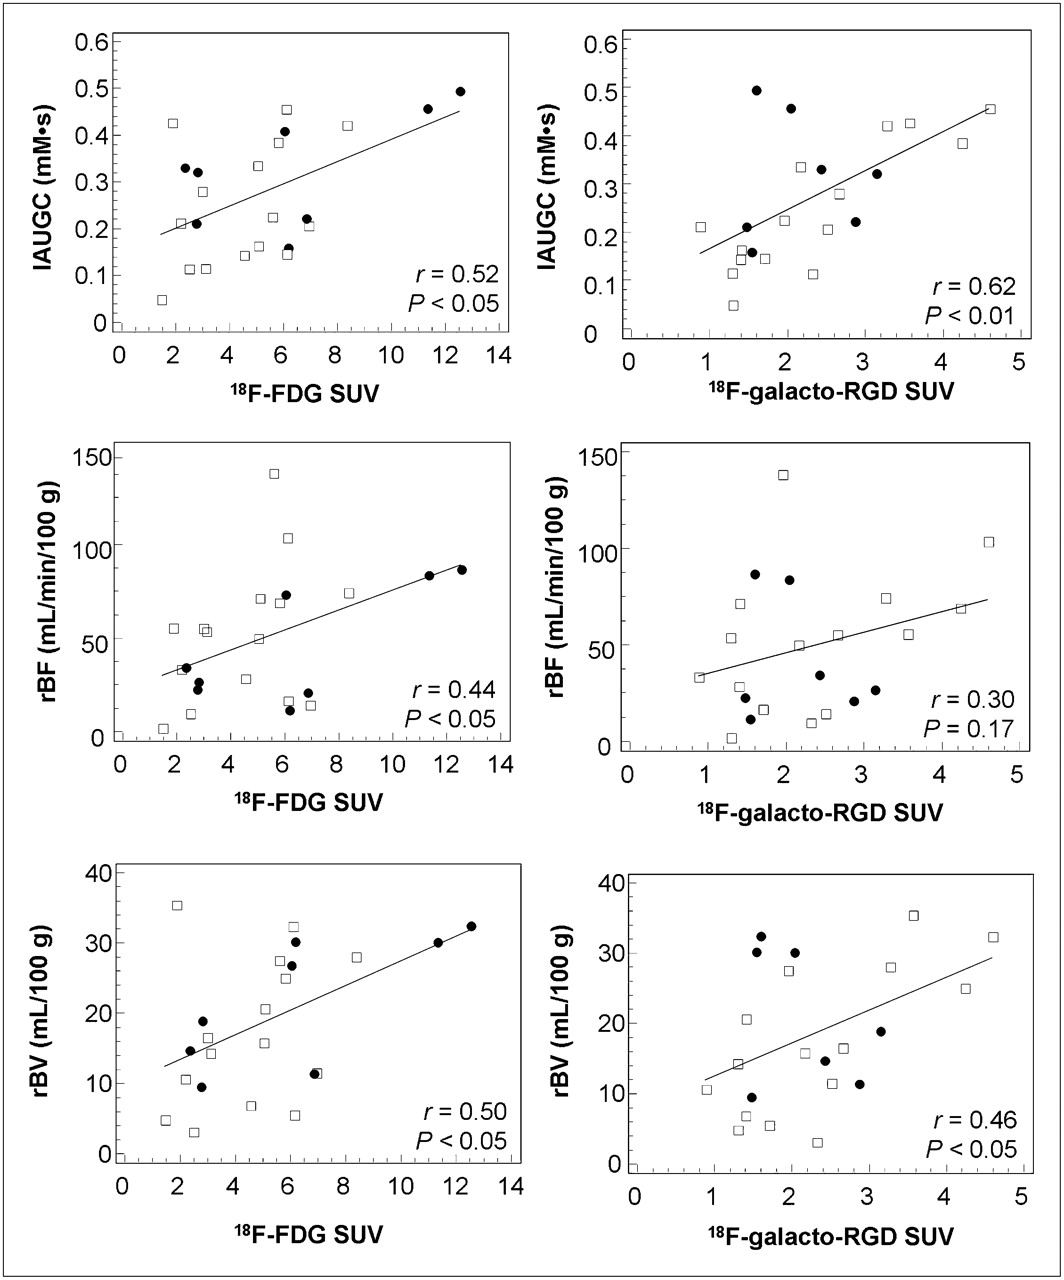
- FIGURE 3.
Scatterplots and regression lines correlating SUVs from PET data with functional MRI parameters of different tumor ROIs (□ = NSCLC; • = other histologic types). Pearson correlation coefficients and P values of between-subject correlation (generalized-estimating-equation model) are shown in scatterplots. Significant correlation was found between molecular PET data and all functional MRI parameters, except for 18F-galacto-RGD vs. rBF.

Tables
Patient no. Sex Age (y) Primary tumor Imaged tumor site 1 M 62 NSCLC Primary 2 M 52 NSCLC Primary 3 M 71 Rectal adenocarcinoma Metastasis to lung 4 F 71 NSCLC Metastasis to adrenal gland 5 M 74 NSCLC Metastasis to pelvic bone 6 F 70 NSCLC Metastasis to pelvic bone 7 F 62 NSCLC Metastasis to pelvic bone 8 F 64 Renal cell carcinoma Local recurrence 9 M 73 Neuroendocrine carcinoma of lung Metastasis to liver 10 M 68 Neuroendocrine carcinoma of lung Lymph node metastasis 11 M 68 NSCLC Primary 12 M 80 NSCLC Primary 13 M 58 NSCLC Primary Patients 12 and 13 were excluded because of movement or pulsation artifacts on MRI.


Jump to section
Related Articles
Cited By...
- Prospective Evaluation of 18F-Fluorodeoxyglucose Uptake in Postischemic Myocardium by Simultaneous Positron Emission Tomography/Magnetic Resonance Imaging as a Prognostic Marker of Functional Outcome
- Integrin-Targeted Molecular Imaging of Experimental Abdominal Aortic Aneurysms by 18F-labeled Arg-Gly-Asp Positron-Emission Tomography
- Quantitative, Simultaneous PET/MRI for Intratumoral Imaging with an MRI-Compatible PET Scanner