


Abstract
Assessment of osteosarcoma response to neoadjuvant chemotherapy is performed by histopathologic analysis after surgical resection of the primary tumor. The purpose of this study was to evaluate whether 18F-FDG PET could be a noninvasive surrogate to histopathologic analysis and allow for earlier response evaluation to neoadjuvant chemotherapy in osteosarcoma. Methods: Metabolic response to neoadjuvant chemotherapy was assessed in immunocompetent rats with a preestablished orthotopic osteosarcoma using 18F-FDG PET before and after receiving 2 doses of ifosfamide. Comparison was then made by assessing histologic responses on euthanized animals. Results: Maximum standardized uptake value (SUVmax) measured by 18F-FDG PET after 2 doses of chemotherapy was correlated to histologic classification (P < 0.01). An SUVmax less than 15 corresponded to good responders, whereas an SUVmax greater than 15 but less than 20 and an SUVmax greater than 20 corresponded to partial responders or nonresponders, respectively. A 40% decrease in SUVmax between the first and second 18F-FDG PET scans distinguished between partial and good response to chemotherapy. Conclusion: Determination of SUVmax using semiquantitative 18F-FDG PET predicts response to neoadjuvant chemotherapy earlier than does histologic analysis.
Although it accounts for only 0.1% of all tumors in this age group, osteosarcoma is the most frequent primary malignant bone tumor in children and adolescents (1). The introduction of multiple-agent chemotherapy regimens, combined with wide-margin, limb-sparing surgery, improved the outcome for these patients, and most modern series report relapse-free survival over 5 y in approximately 65% of patients (2). Whereas the tumor size, location, and presence of metastases at diagnosis carry a prognostic value for patient outcome, the most determining prognostic factor in osteosarcoma remains the response to neoadjuvant chemotherapy. A greater degree of tumor necrosis at the completion of neoadjuvant chemotherapy is associated with a significantly higher survival rate (3). Tumor response to chemotherapy is evaluated at the time of surgery on the resected tumor by histologic analysis according to a method described by Huvos et al. (4). Ninety-five percent or higher tumor necrosis is considered good response to therapy (4). Conversely, a necrosis rate between 90% and 95% is classified as partial response, and tumor necrosis less than 90% qualifies as nonresponder to neoadjuvant chemotherapy (4). Early determination of tumor response during the course of neoadjuvant chemotherapy could prove critical to the detection of nonresponders and offer alternative chemotherapy regimens. The application of noninvasive imaging to determine tumor response to chemotherapy throughout the treatment has been investigated. So far, the value of noninvasive CT or MRI to predict histopathologic treatment responses has failed to demonstrate its benefit during neoadjuvant chemotherapy of musculoskeletal sarcoma (5). CT or MRI changes observed in soft tissues and bone revealed inconsistent correlation with patient outcomes. Moreover, limitations appeared with these techniques when trying to distinguish necrotic tumor, local inflammatory reaction, or fibrotic scarring from residual tumor tissue (6,7). Because 18F-FDG PET distinguishes metabolic highly active from less-active tumor tissues and can discriminate normal from tumor cells on the basis of glucidic alterations, functional response measured by 18F-FDG PET may represent a surrogate to histologic tumor response to therapy. Ultimately, treatment may be adapted at an earlier stage during the course of neoadjuvant chemotherapy on the basis of tumor functional activity measured by 18F-FDG PET rather than volumetric analysis using CT or MRI (8). A decrease in standardized uptake values (SUVs) has been shown to predict response to therapy in malignant lymphomas and other solid tumors (8–11). In soft-tissue sarcomas and gastrointestinal stromal tumors (GIST), metabolic imaging with 18F-FDG PET allows for the assessment of tumor response to therapy (9,10). Moreover, maximum SUV (SUVmax) measured by 18F-FDG PET is correlated to histologic tumor response in patients undergoing neoadjuvant chemotherapy for Ewing sarcoma (12,13). Nonetheless, evidence of the predictive value of 18F-FDG PET is lacking in osteosarcoma.
Because ethical, financial, and technical constraints make the prospective evaluation of the risk–benefit ratio of 18F-FDG PET in a pediatric patient population cumbersome, we decided to study the technique in an orthotopic osteosarcoma model in rats. We have previously demonstrated in this model the ability of 18F-FDG PET to correlate metabolic to histologic responses, thus allowing longitudinal in vivo assessment of tumor response to therapy (14,15). We now report data supporting that the 18F-FDG PET response predicts the histopathologic response to neoadjuvant chemotherapy.
MATERIALS AND METHODS
Osteosarcoma Model and Treatment Schedule
Care of and procedures for animals were performed according to institutional and national guidelines. Animals were anesthetized throughout all surgical and imaging procedures with isoflurane/oxygen (2.5%/2.5%, v/v) (Minerve). The transplantable orthotopic and metastatic rat osteosarcoma has been described elsewhere (14,16). This model mimics its human counterpart in terms of aggressiveness, metastatic spreading, and chemoresistance phenotype (15,16). Tumors were grafted on 25-d-old Sprague–Dawley rats (Charles River Laboratories) as previously described (14). Fourteen days after tumor transplantation, animals underwent a first 18F-FDG PET scan and were randomly assigned to a control (saline, n = 10) or a treatment (ifosfamide; Baxter) group (n = 10). Treated animals received 2 subcutaneous doses (20 mg/kg each) of ifosfamide 7 d apart (at days 15 and 22 after tumor transplantation). A second 18F-FDG PET scan was obtained 7 d after the second administration of ifosfamide (i.e., day 29 after tumor implantation). Total tumor volume and metabolic volume were measured using a volume of interest (VOI)–based method on reconstructed PET images. All animals were euthanized if they showed any signs of distress. At the time of necropsy, tumors and lungs were collected for histologic examinations.
Metabolic Response to Chemotherapy Using 18F-FDG Small-Animal PET Scan
The initial 18F-FDG PET scan was obtained 14 d after tumor implantation (i.e., 24 h before treatment initiation, or prechemotherapy PET). A second 18F-FDG PET scan was acquired 7 d after the completion of chemotherapy (i.e., 29 d after tumor transplantation, or postchemotherapy PET). After the animals had fasted for 4 h, they received intravenous injections of 18F-FDG (30 MBq/kg; CERMEP) 2 h before image acquisition. During acquisition, animals were kept under general anesthesia with isoflurane/oxygen (2.5%/2.5%, v/v), and animals' body temperature was maintained using a warming pad. PET scans were obtained at the Animage core facility on a small-animal PET camera (Clearpet; Raytest). Whole-body images were acquired with 2 bed positions (field of view, 110 mm): one centered on the tumor and the other one on the lungs, with an acquisition time of 15 min per bed position.
Data were processed without attenuation correction, and images were reconstructed using an iterative method (maximum-likelihood expectation maximization, 20 iterations) using the Amide software (http://amide.sourceforge.net). 18F-FDG PET images were semiquantitatively analyzed using a VOI-based method. Ellipsoid VOIs were drawn over the whole tumor. Three-dimensional isocontour VOIs using a 40% maximum threshold defined the total tumor volume. Similarly, a 50% maximum threshold defined the metabolic tumor volume. The 40% and 50% threshold values applied to define the total tumor volume and the metabolic tumor volume in 3-dimensional isocontour VOIs were chosen on the basis of published studies (17,18). As internal negative control, a reference nontumor VOI was positioned in a corresponding location to the tumor region of interest (e.g., in the contralateral unaffected paw). An SUVmax normalized to body weight was calculated for all volumes using the formula (18):
The 50% and 40% threshold values allowed us to calculate a metabolic volume corresponding to all the voxels having an SUV greater than or equal to 50% and 40% threshold values and to give an SUV mean value for the concerned volume. With this method, the necrotic areas (for which SUVs were below the threshold values) did not affect the metabolic volume measure.
According to recommendations by the European Organization for Research and Treatment of Cancer (EORTC) (19), we graded metabolic responses on the basis of the changes of SUVmax measured on prechemotherapy PET and postchemotherapy PET reconstructed images (Table 1).
Metabolic Response Criteria According to Recommendations of EORTC
Histology
All animals were euthanized 24 h after the postchemotherapy PET scan. Primary tumor and lungs were fixed in 10% buffered formalin and then processed and embedded in paraffin. Viable tumor remaining after chemotherapy was expressed as the percentage of whole tumor volume using the Huvos histologic response (Table 2) (4,20). Tumors were oriented, and series of whole transverse sections were cut in the distal fourth, middle, and proximal fourth of the tumor. After hematoxylin and eosin coloration, tissue slides were analyzed using a DM4500 B microscope (Leica). We examined all cases to evaluate the following histologic features: mitotic rate expressed as the number of mitotic figures per 10 high-power fields (1 field, 0.237 mm2), necrosis, and bone. For each tumor, mitotic rate and necrosis were estimated on whole transverse sections from the 3 areas (e.g., distal fourth, middle, and proximal fourth of the tumor).
Histologic Response According to Huvos Gradation
Immunohistochemistry
Glucose transporter 1 (Glut-1) immunostaining was performed on deparaffinized tumor sections with an anti–rat Glut-1 rabbit polyclonal antibody (Abcam; 1-h incubation at room temperature). Slides were then washed twice in 0.3% phosphate-buffered saline containing bovine serum albumin for 5 min. Slides were incubated with a biotinylated secondary antibody (Vector Laboratories) according to the manufacturer's instructions. After a final wash, tumor sections were stained with a Vectastain ABC Kit (Vector Laboratories), followed by counterstaining using hematoxylin (Sigma-Aldrich) and microscopic examination. Glut-1 staining was graded as positive or negative. Cases were considered negative when less than 10% of cells showed Glut-1 staining and positive when 10% or more of tumor cells showed Glut-1 staining. Variations in staining intensity of the cells were scored, and the following criteria were used: +, weak but unequivocal staining in some cells; ++, staining of moderate intensity; and +++, strong or intense staining.
Statistical Analysis
SUVs and tumor volumes were compared between control and treatment groups using a 2-tailed Student t test.
Relative mean tumor volume (RMTV) and tumor volume inhibition rate (IR) were calculated as indicated below: P values less than 0.01 were considered statistically significant. Correlation between tumor responses determined by histologic analysis or by 18F-FDG PET was assessed using the Pearson test. Statistical analysis was performed using the StatView 5.0 software package (SAS Institute Inc.).
RESULTS
Ifosfamide Induces Clinical and Histologic Tumor Response in Orthotopic Osteosarcoma in Rats
There was no difference in the mean (±SD) tumor volumes measured on 18F-FDG PET reconstructed images at the initiation of treatment between control and treated animals (1,909 ± 515 mm3 and 2,559 ± 1,046 mm3, respectively; P = 0.09). After the end of treatment, the mean tumor volume in the treated animals was significantly smaller than that in the control group (1,251 ± 701 mm3 vs. 9,172.1 ± 2,693 mm3; P < 0.01). Compared with the control group, in the treatment group the 2 cycles of ifosfamide induced a 53.34% decrease in tumor volume, which corresponded to a 10.2-fold inhibition rate (P < 0.01) (Table 3). According to Huvos histologic response, animals from the control group were all classified as grade 3 or 4 nonresponders (Table 4). In treated animals, histologic evaluation found only good (grade 1, n = 5) and partial responders (grade 2, n = 5) (Table 4).
Parameters Indicative of Tumor Metabolic Activity and Tumor Response to Therapy Measured on 18F-FDG Scans Before and After Chemotherapy in Control and Ifosfamide-Treated Groups
Changes in Tumor Volume and SUVs on 18F-FDG PET Before and After Chemotherapy: Status of Metabolic Response (According to EORTC) and Histologic Response in Control and Ifosfamide-Treated Rats
18F-FDG PET Correlates with Histologic Observations in Osteosarcoma in Rats
For all animals, the SUVmax was observed within the tumor metabolic volumes. Before treatment initiation, the metabolic volume represented 86.9% (±13%) and 94.5% (±11%) of the whole tumor volume in the control and treatment groups, respectively (Table 3). After treatment, the metabolic volume still represented approximately 60% of tumor volume in both groups (Table 3). For all control animals (representative images shown in Fig. 1), when 18F-FDG PET images were superimposed onto the corresponding whole-mount tumor sections, areas of metabolic volume defined on 18F-FDG PET images were found to match with the histologically defined hyperproliferative regions (Figs. 1A and 1B). On histologic analysis, these areas presented with the highest cell density, an elevated mitotic score, and a strong staining of Glut-1 (Figs. 1C and 1E). Conversely the areas with the lowest SUV corresponded to tumor regions with necrotic or osteoid areas with low cellular density and weak Glut-1 staining (Figs. 1D and 1F).
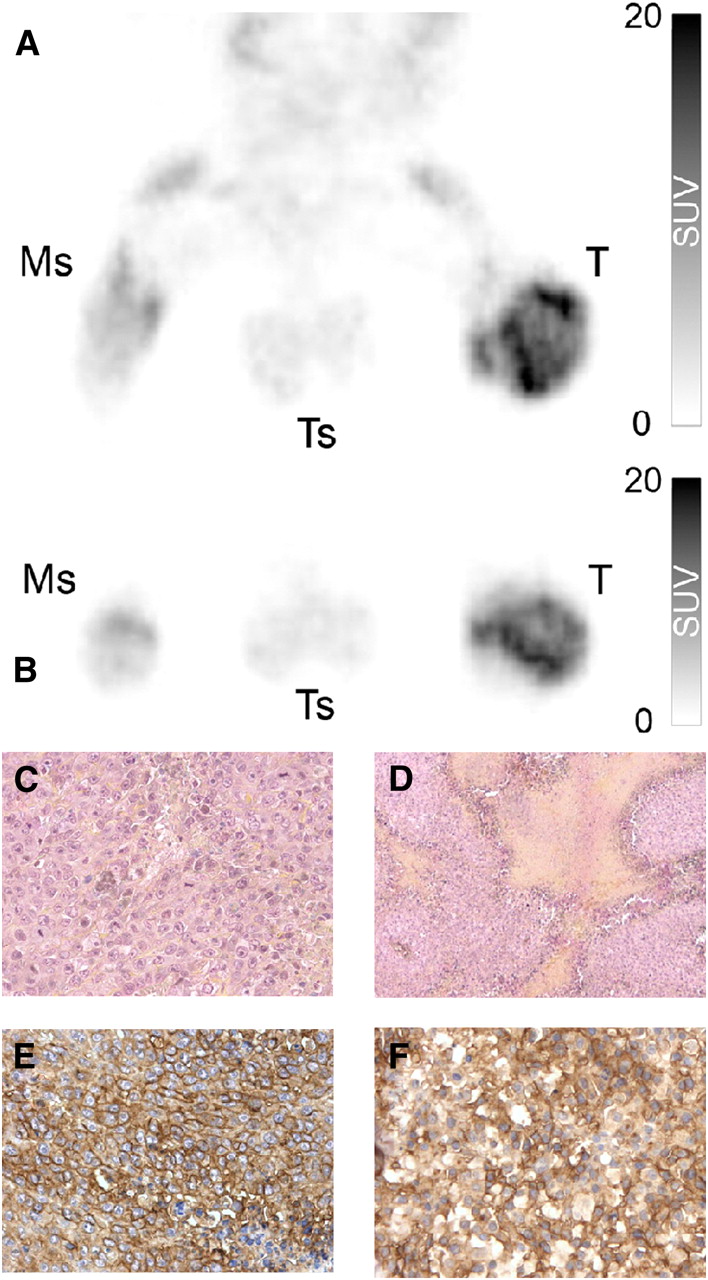
Representative 3-dimensional maximal-intensity-projection reconstruction obtained for control group. Tumor coronal (A) and transaxial (B) slices visualized by 18F-FDG PET. Areas with higher fixation of 18F-FDG corresponded on hematoxylin- and eosin-stained tumor transverse sections (C) to regions with high cellular density, mitotic score, and high homogeneous expression of Glut-1 visualized by immunohistostaining (E). Areas with lower fixation of 18F-FDG corresponded on hematoxylin- and eosin-stained tumor transverse sections (D) to necrotic areas, or regions with low cellular density, mitotic score, and lower and heterogeneous expression of Glut-1 visualized by immunohistostaining (F). Ms = muscle; T = tumor; Ts = testis. All images are obtained from same rat. Magnifications are ×200 for C, D, and F; ×100 for E.
Among the treated animals, 18F-FDG PET scans obtained after the completion of treatment revealed tumors with areas of intense 18F-FDG fixation (Figs. 2A and 2B) amid areas of lower intensity (Figs. 2A and 2E). The superimposition of 18F-FDG PET transverse sections with the corresponding whole-mount paraffin slides revealed that the areas showing the least 18F-FDG fixation intensity (i.e., areas with SUV < SUV mean) corresponded on histologic analysis to necrotic areas. Interestingly, areas of active metabolic activity as visualized by 18F-FDG PET corresponded on histologic slides to tumor foci as small as 1.2 mm in diameter (Fig. 2C). These remaining tumor foci presented with the same characteristics as the metabolic volume areas of tumors from the control group: high cell density, high mitotic index, and intense expression of Glut-1, all being evidence of the aggressiveness of remaining tumor cells (Figs. 2C and 2D). Areas presenting with an intermediate fixation of 18F-FDG (areas with SUVs approaching the SUV mean) on 18F-FDG PET were found to correspond histologically to regions of chemotherapy-induced modifications (Figs. 2E and 2F). No viable tumor cells were found in these areas, but fibrous scarring and infiltration by immune and giant cells were observed (Fig. 2F). These cells presented a Glut-1 staining of moderate intensity. Indeed, normal immune cells are known to express Glut-1, albeit at a lower level than tumor cells, which may explain this nonspecific 18F-FDG uptake (Fig. 2G).

Representative 3-dimensional maximal-intensity-projection coronal reconstruction of 18F-FDG PET images from ifosfamide-treated group (A). 18F-FDG accumulates heterogeneously in tumor. Transaxial slice from region of 1.2-mm thickness showing high levels (B) of 18F-FDG uptake corresponded on hematoxylin and eosin histologic analysis to remaining hyperproliferative osteosarcoma (C) with strong Glut-1 immunostaining (D). Transaxial slice from region showing low and heterogeneous fixation of 18F-FDG (E) corresponded on hematoxylin and eosin histologic analysis to chemotherapy-modified regions without viable tumor cells but with infiltration of giant polynuclear immune cells (arrows) (F) expressing Glut-1 (G). Ms = muscle; T = tumor; Ts = testis. Magnifications: ×50 for C; ×100 for D and F; ×400 for G and insets from C and F.
Evaluation of Tumor Response by 18F-FDG PET
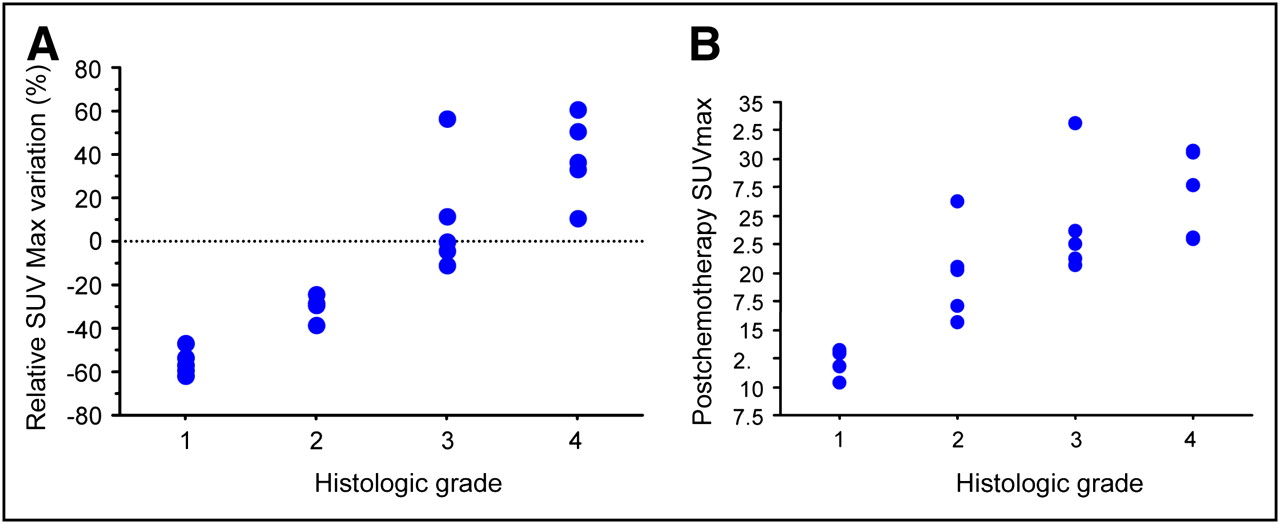
There was no correlation between changes in tumor volumes (whole or metabolic; Table 4) and histologic responses (Fig. 3), even if a 55% reduction in tumor volume could identify good responders. When applying the criteria of the EORTC to evaluate the tumor metabolic response in our tumor model, all tumors in the control group qualified as progressive disease, whereas all animals in the treated group were considered partial responders (Table 4). No correlation was found between the metabolic response graded according to the recommendations by the EORTC and the histopathologic gradation. Thus, using the criteria of the EORTC for SUV changes and staging of metabolic response, we could not discriminate good from partial responders (Table 4). A closer analysis of the SUVmax revealed that a 40% decrease in the SUVmax between prechemotherapy and postchemotherapy 18F-FDG PET could differentiate good from partial responders with a 100% sensitivity and specificity (Fig. 4A). We also found that an SUVmax less than 15 on 18F-FDG PET performed after chemotherapy distinguished good from partial responders (Fig. 4A). Indeed, 5 of the 5 good responders had a postchemotherapy SUVmax less than 15, whereas animals presenting a partial response to ifosfamide had an SUVmax between 15 and 20 (P < 0.01). The SUVmax in rats with progressive tumors (control group, n = 10) was above 20; the most aggressive tumor presented with an SUVmax greater than 25 (P < 0.01). Interestingly, there was a significant correlation between the SUVmax on 18F-FDG PET after chemotherapy and histologic response (P < 0.01, R2 = 0.94) (Fig. 4B).
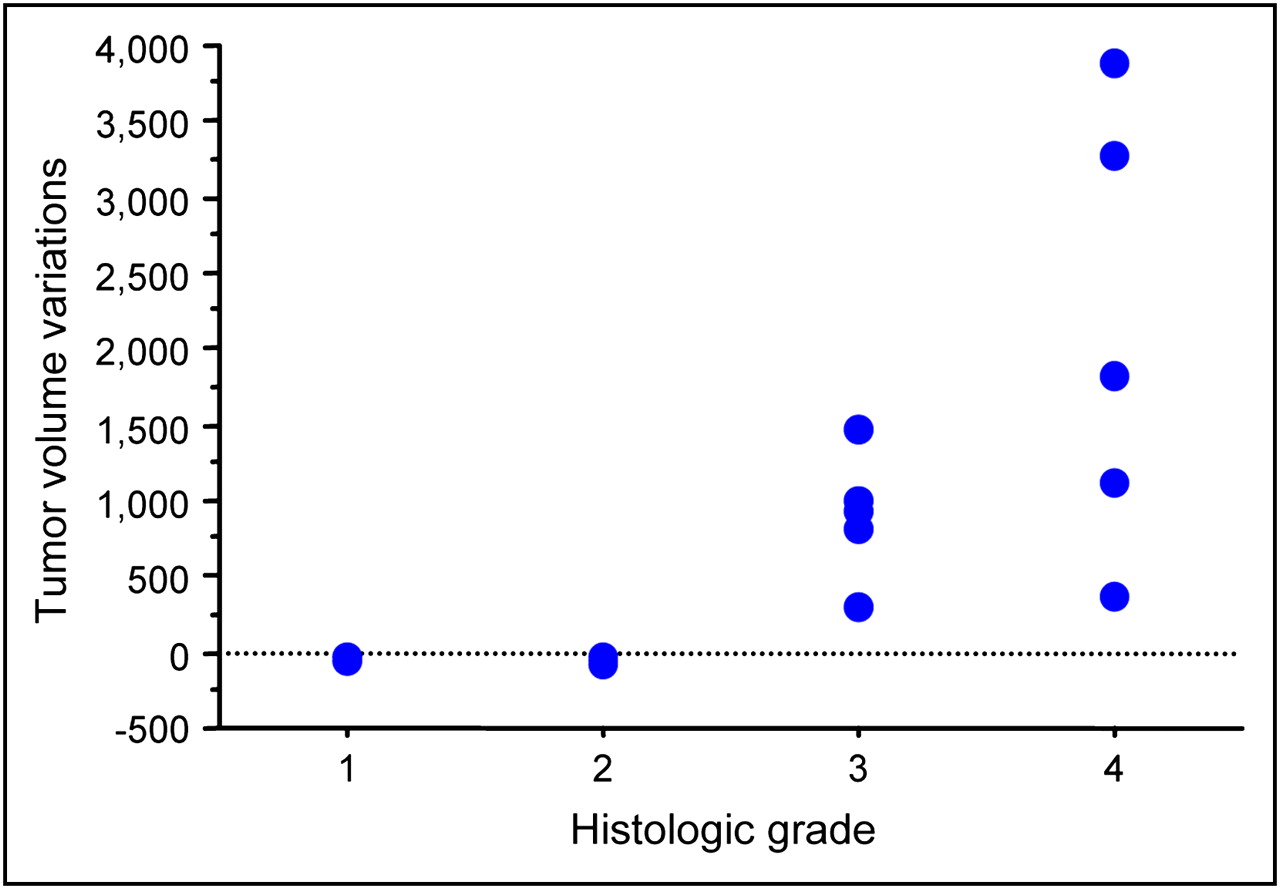
Scatter plot of histologic response and total tumor volume changes measured using 18F-FDG PET shows absence of correlation between parameters measured by metabolic imaging and histologic response (R2 = 0.56). Tumor volumes were measured by VOI on maximal-intensity-projection reconstructed images.

Correlation of tumor histologic response (Huvos) with SUVmax measured by 18F-FDG PET. (A) Scatter plot of relative SUVmax changes and tumor histologic response shows strong correlation of SUVmax change with histologic response (R2 = 0.86): a 40% decrease in SUVmax could distinguish good from partial responder (grade 1 from grade 2). (B) Scatter plot of SUVmax measured by 18F-FDG PET scan after chemotherapy correlates with histologic grade (R2 = 0.94). Postchemotherapy SUVmax less than 15 indicated good response to chemotherapy. For this analysis, histologic response, relative SUVmax change, and postchemotherapy SUVmax from all animals studied were considered.
DISCUSSION
In osteosarcoma, response to neoadjuvant chemotherapy is considered complete if less than 5% of viable tumor cells are present on histologic analysis of the resected tumor. Correlation between histologic response to treatment and survival is now widely accepted in patients with bone sarcomas (3,21). Nonetheless, assessing tumor response (or lack thereof) early into neoadjuvant chemotherapy is critical to adapting treatment strategies.
In this study, we evaluated the potential of 18F-FDG PET as an early predictor of osteosarcoma response to chemotherapy in osteosarcoma-bearing rats treated with 2 doses of ifosfamide. We showed a significant correlation between the SUVmax measured by 18F-FDG PET after completion of chemotherapy and histologic response evaluated according to Huvos. We established that a cutoff value of 40% between pre- and posttreatment SUVmax discriminated between good and partial responders.
Metabolic imaging using 18F-FDG PET scans has an established role in staging, predicting the aggressiveness, and detecting the recurrence of many tumors including bone sarcomas (22,23). One of the advantages of 18F-FDG PET is that it can visualize and quantify 18F-FDG uptake to distinguish metabolically highly active from less active tumor tissues. 18F-FDG PET could be useful for the early assessment of tumor response to chemotherapy and the detection of metabolic alterations of tumor cells occurring before alterations in tumor size. Studies conducted in patients with lung, breast, or ovarian cancer and lymphoma have demonstrated that reduced 18F-FDG uptake can identify responders early after treatment and that increased 18F-FDG uptake after treatment was associated with a high risk for early disease recurrence and poor prognosis (24,25). The role of 18F-FDG PET in monitoring response to chemotherapy has been shown in patients with soft-tissue and bone tumors other than osteosarcoma (9,13,26). In fact, the predictive value of 18F-FDG PET in monitoring response to neoadjuvant chemotherapy has not been reported yet in osteosarcoma.
In our osteosarcoma model, we tested whether 18F-FDG PET correlated with the histologic response after neoadjuvant chemotherapy. Our results showed that ifosfamide-induced tumor response is associated with a decrease in tumor volume and an increase in tumor necrosis. When applying the prospective definitions of metabolic response according to the EORTC (19), we found that the changes of tumor volume and SUVmax were not correlated with tumor histologic response. This limitation could be explained in part because 18F-FDG PET does not allow distinguishing a necrotic area from osteoid matrix typically found in tumors after chemotherapy and whose localization can be confirmed only by histologic analysis. Another lack of sensitivity of 18F-FDG PET is illustrated by the fixation of radiotracer seen in fibrous scarring and tumor-infiltrated immune cells. Fibrous scarring and accumulation of infiltrating inflammatory cells within the tumor are modifications induced by chemotherapy that are commonly found in tumor response to chemotherapy. Glut-1 immunostaining by active immune cells led to the overestimation of tumor SUV changes and tumor volumes, a known issue responsible for the limited sensitivity of the technique in detecting tumor response to treatment (27). Nonetheless, we demonstrated that SUVmax measured at the completion of chemotherapy correlated strongly with histologic response and was thus able to distinguish good responders from partial responders. With the current race to design innovative PET radiopharmaceuticals, it is likely that other agents such as 18F-fluorothymidine, which measure more directly cell growth or death, or radiolabeled amino acids will be more effective than 18F-FDG in the evaluation of early tumor response (28).
CONCLUSION
Taken together, our data validate 18F-FDG PET as an early marker of tumor response to neoadjuvant chemotherapy in a relevant animal model of osteosarcoma that mimics its human counterpart. Our results suggest possible refinements to the EORTC classification (20) in which threshold rather than changes in SUVmax could be used to predict histologic response. Prospective studies are needed in patients with osteosarcoma to confirm the potential of metabolic imaging for the early detection of tumor response to neoadjuvant chemotherapy and its potential use as a decision-making tool to adapt treatment in poorly or even nonresponding patients. Ultimately, correlation between early metabolic imaging and long-term clinical outcome is warranted in patients with osteosarcoma.
Acknowledgments
We thank Dr. David Perol for support with statistical analysis, Jean Philippe Michot for technical advice, technicians from the Experimental Therapeutics Laboratory for their skilled assistance, the Institut Claude Bourgelat, and Stephane Martin at the Animage imaging platform for help and excellent care of the animals.
Footnotes
-
↵* Contributed equally to this work.
-
COPYRIGHT © 2009 by the Society of Nuclear Medicine, Inc.
References
- Received for publication January 20, 2009.
- Accepted for publication June 4, 2009.


