


Article Figures & Data
Figures
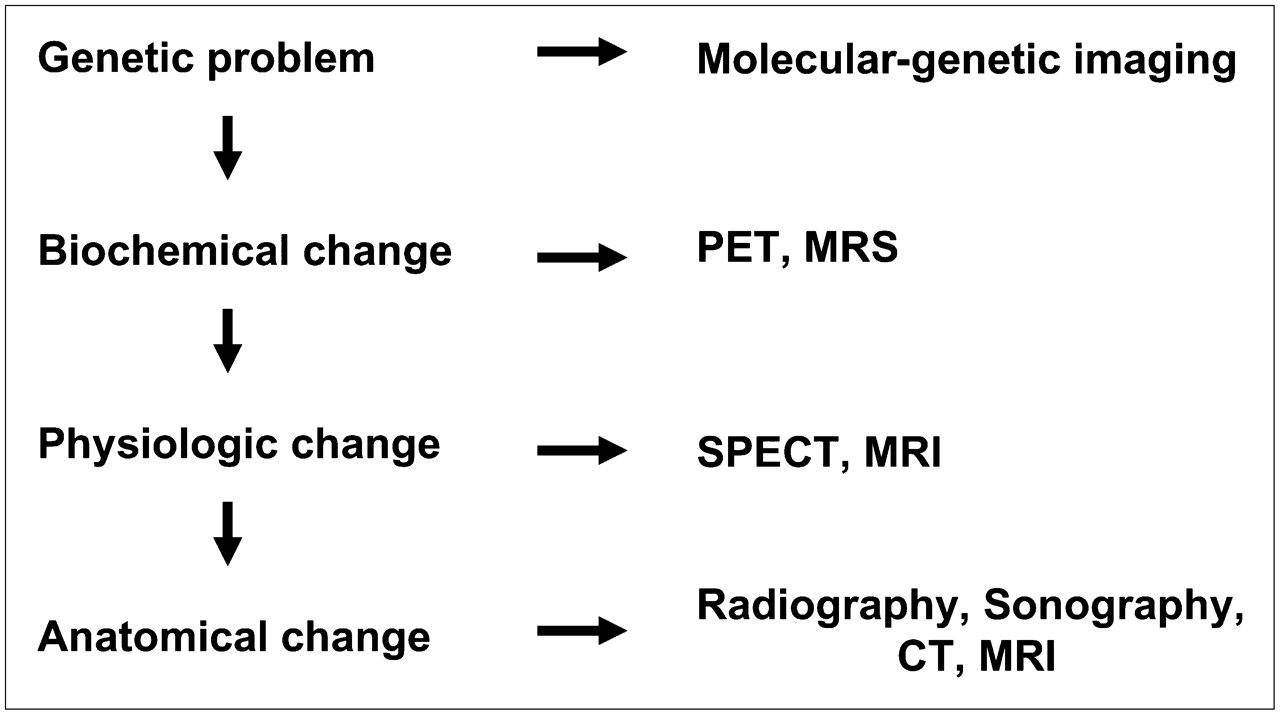
- FIGURE 1.
Schematic explanation of disease progression and development of imaging modality. In many diseases, including cancer, genetic problem occurs first and then is followed by biochemical, functional, and morphologic changes. Conventional images can visualize anatomic morphologic change. SPECT, MRI, and PET can visualize functional physiologic change and biochemical change. Molecular-genetic imaging has been designed to visualize original genetic problem. MRS = MR spectroscopy.
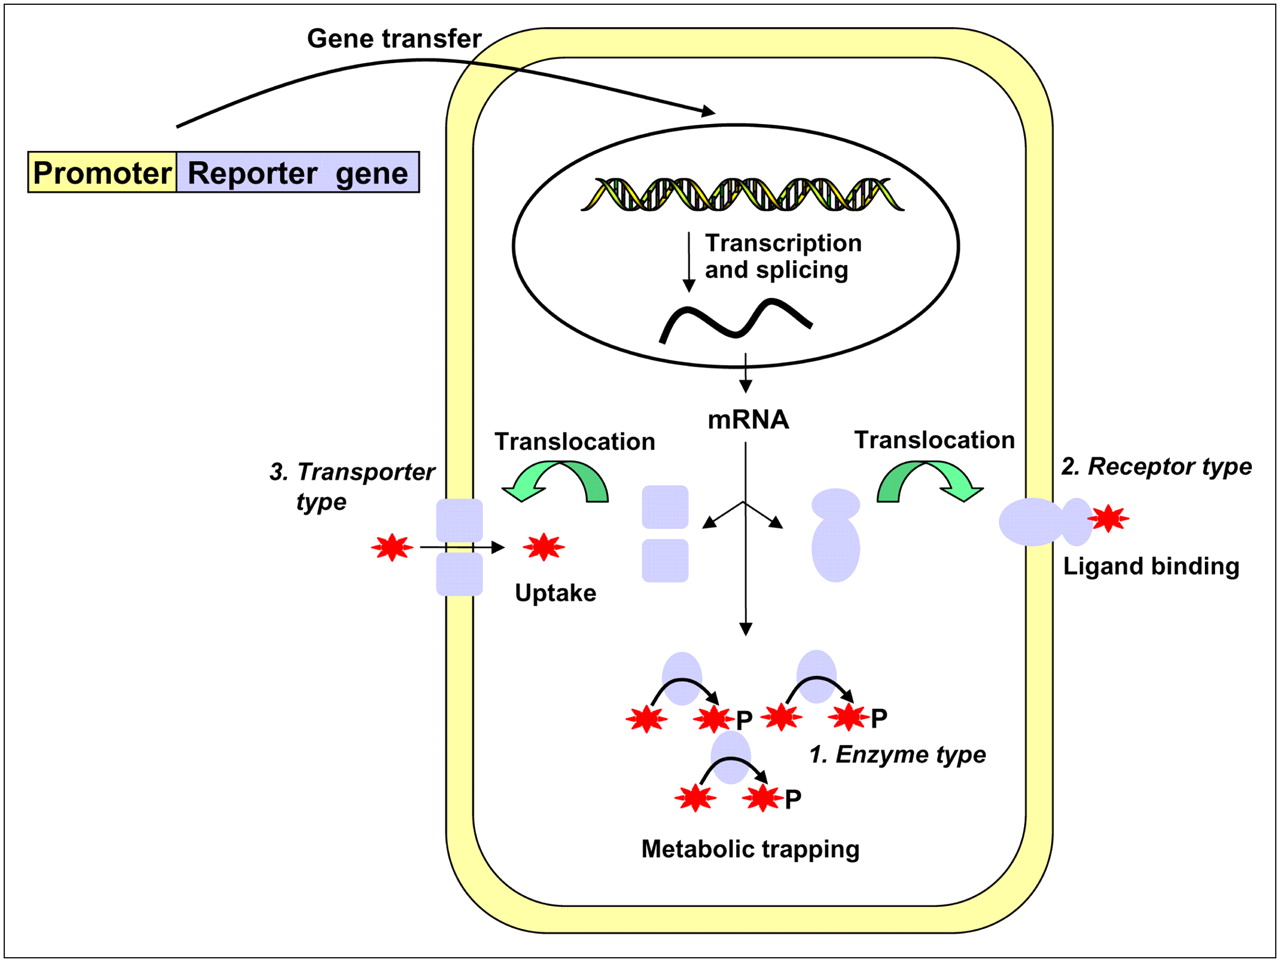
- FIGURE 2.
Schematic illustration of 3 types of reporter gene expression used in nuclear medicine modality. Representatives of enzyme type and transporter type are HSV1-tk (ovals) and NIS (squares), respectively. Receptor types are D2R, norepinephrine receptor, and SSTr2. Stars represent radioisotope-labeled substrates (enzyme) or ligands (receptor) or radionuclide itself (transporter type).
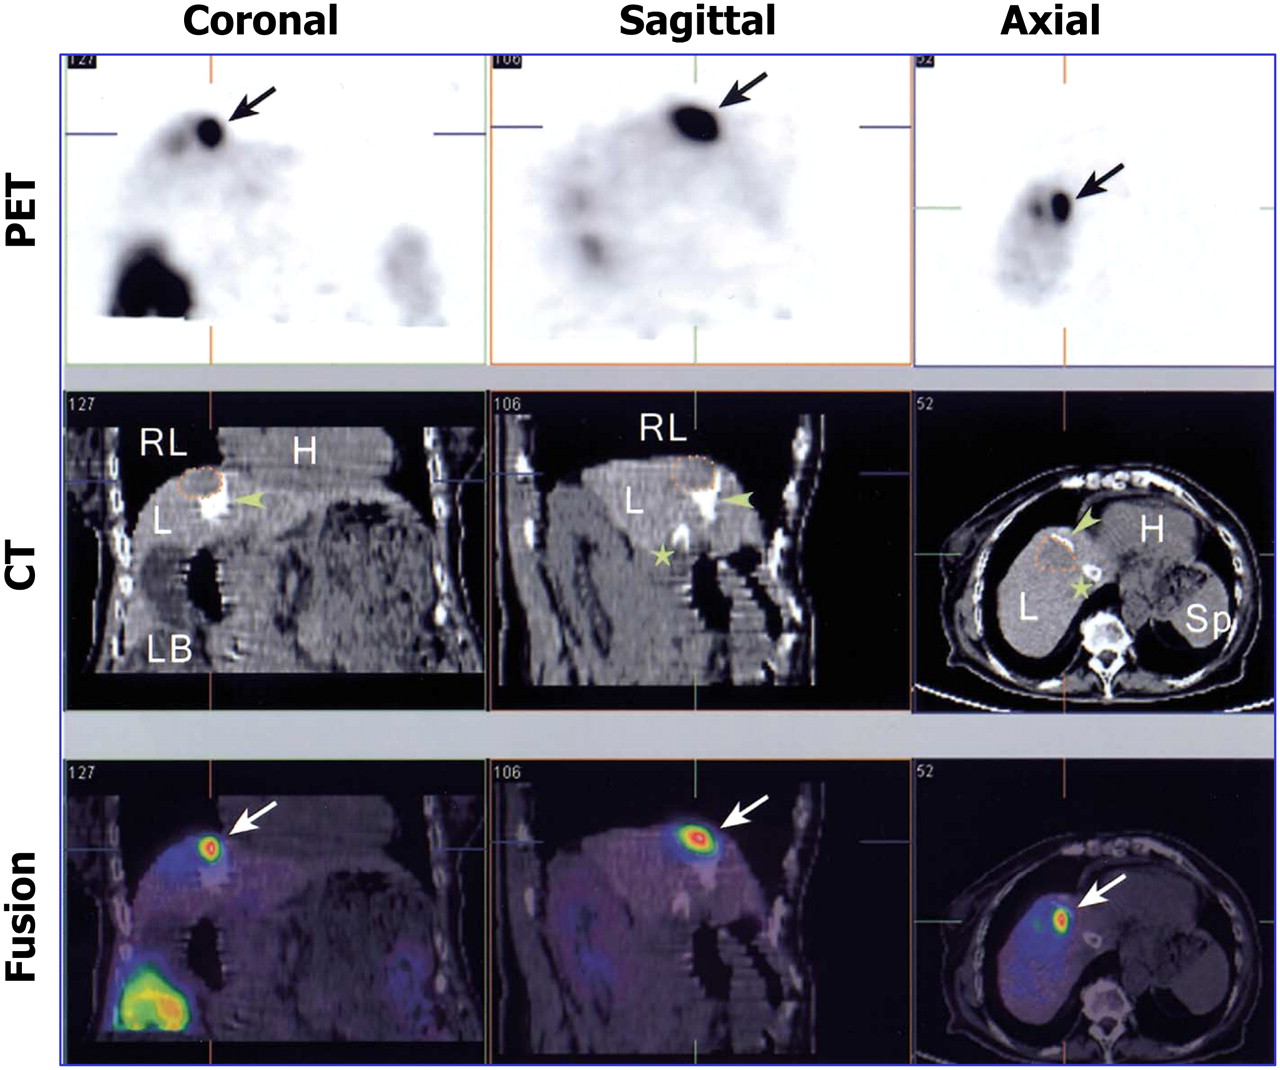
- FIGURE 3.
PET/CT of adenovirus-mediated HSV1-tk expression in liver cancer patients. Treated tumor lesion is indicated by dotted lines on CT images, and 18F-FHBG accumulation at tumor site is indicated by arrows on PET images. White spots in liver on CT images (arrowheads) correspond to lipiodol retention after transarterial embolization of tumor and installation of transjugular intrahepatic portosystemic shunt (star). H = heart; L = liver; LB = large bowel; RL = right lung; Sp = spleen. (Reprinted with permission of (63).)
- FIGURE 4.
Relationship between p53 gene expression and accumulation of radioiodine in SK-Hep1 cells expressing p53RE-hNIS (SK-Hep1p53NIS) after adriamycin treatment. (A) Western blot analysis and radioiodine uptake. After treatment of SK-Hep1p53NIS cells with adriamycin, 125I uptake of cells increased with increasing adriamycin dose. Levels of expression of total p53 and activated p53 (p53 Ser15) proteins increased in dose-dependent manner in SK-Hep1p53NIS cells. This increase in cells was completely inhibited by KClO4. (B) Scintigraphic images of endogenous p53 activation. Tumor xenografts were implanted in nude mice at 4 different sites: SK-Hep1 (a, 1 × 10⁷, negative control); SK-Hep1p53NIS (b, 5 × 10⁶; c, 1 × 10⁷; d, 2 × 10⁷). Scintigraphic images of 99mTc were obtained before and after adriamycin treatment in same mouse. Scintigraphy showed higher radioactivity in test tumors (SK-Hep1p53NIS) after adriamycin treatment than in control tumor (SK-Hep1). (C) Radioactivity ratio of SK-Hep1p53NIS to SK-Hep1 in mice before and after adriamycin treatment. Significantly higher uptake was observed in SK-Hep1p53NIS tumors than in SK-Hep1 tumor after adriamycin treatment or in nontreated SK-Hep1p53NIS tumors.
- FIGURE 5.
99mTc scintigraphic images (A) and bioluminescent images (B) of nude mice bearing SK-Hep1 and SK-Hep1/RARE/NIS-Luc tumors before and after all-trans-retinoic acid (ATRA) treatment. Tumor xenografts derived from SK-Hep1 cells (a, 1 × 10⁷, wild type) and SK-Hep1/RARE/NIS-Luc cells (b, 1 × 10⁶; c, 1 × 10⁷; d, 1 × 10⁸) were grown in nude mice. (A) Serial planar γ-camera images of same mouse show increased radioactivity after ATRA treatment in SK-Hep1/RARE/NIS-Luc tumors but not in SK-Hep1 tumor. (B) Serial optical images of same mouse show increased optical signal after ATRA treatment in SK-Hep1/RARE/NIS-Luc tumors but not in SK-Hep1 tumor. Bl = bladder; St = stomach; Thy = thyroid.
- FIGURE 6.
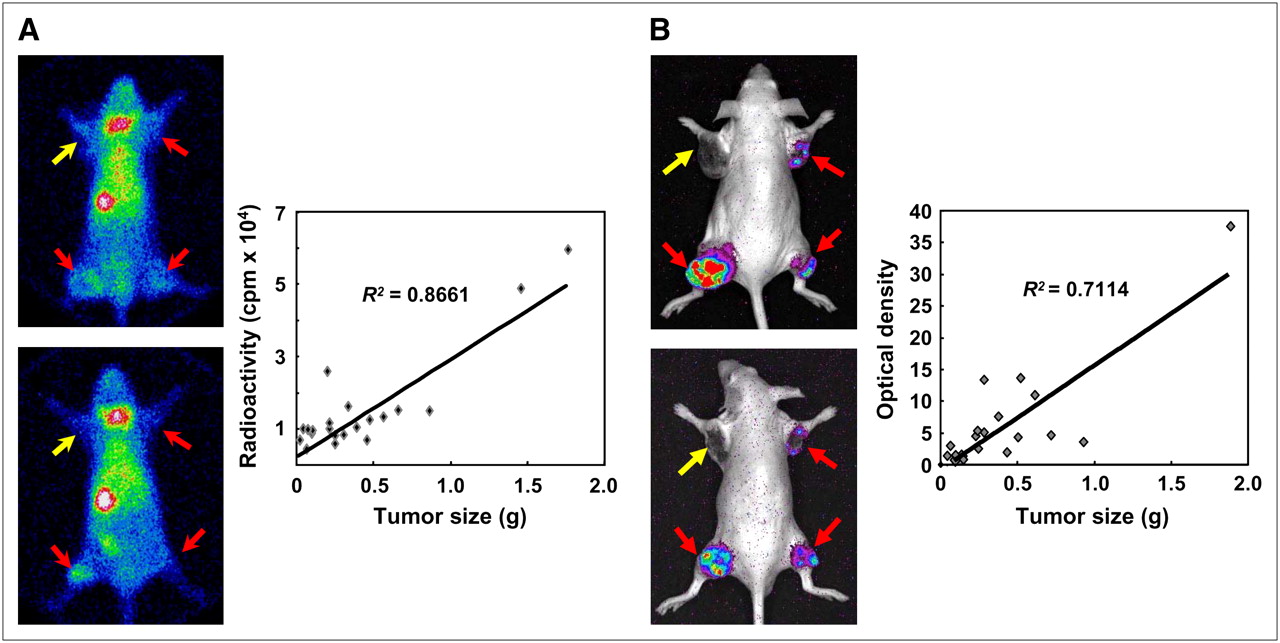
Correlation between imaging signals from tumors and tumor weight. SK-Hep1 and SK-Hep1/NIS-Luc cells expressing simultaneously NIS and luciferase genes were implanted as xenografts into left shoulder (SK-Hep1; 5 × 10⁶ cells), right shoulder (SK-Hep1/NIS-Luc; 5 × 10⁶ cells), left thigh (SK-Hep1/NIS-Luc; 1 × 10⁷ cells), and right thigh (SK-Hep1/NIS-Luc; 5 × 10⁶ cells). (A) 99mTc scintigraphic images show increased radioactivity in SK-Hep1/NIS-Luc tumors but not in SK-Hep1 tumor. After acquisition of scintigraphic images, mice were sacrificed, and biodistribution of radioactivity was examined. Correlation between tumor weight and radioactivity of each tumor is shown (R2 = 0.8661). (B) Bioluminescent images show viable tumor burden of SK-Hep1/NIS-Luc tumors but not of SK-Hep1 tumor. Correlation between bioluminescence signal and tumor weight was moderate (R2 = 0.7114).
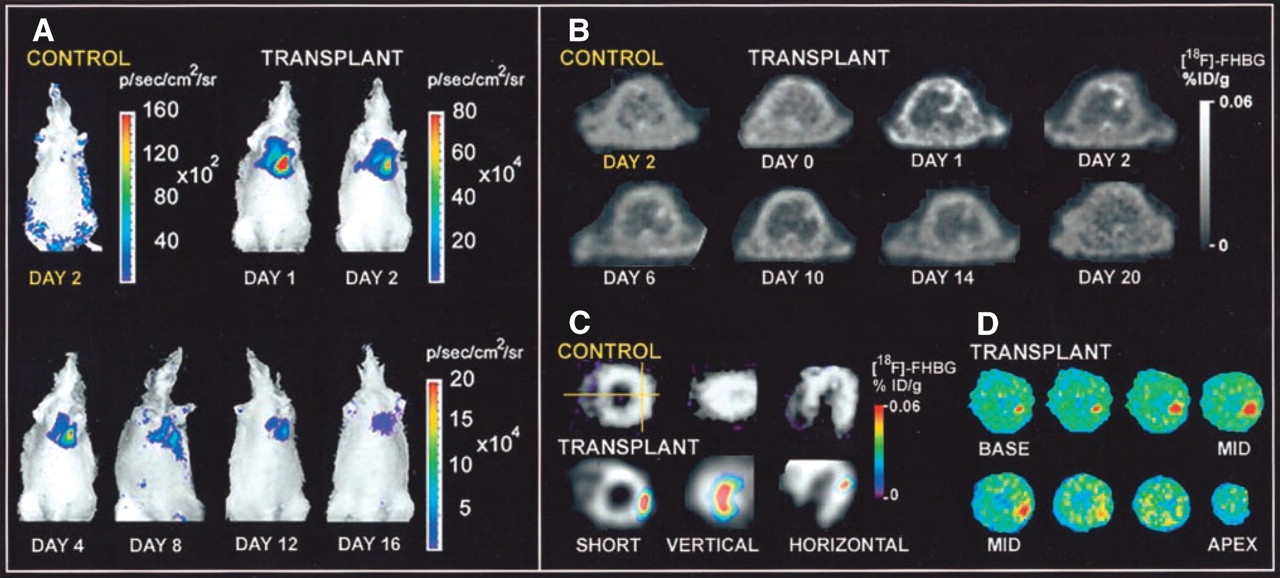
- FIGURE 7.
Molecular imaging of cardiac cell transplantation in rat using optical bioluminescence and PET. (A) After transplantation into rat of embryonic cardiomyoblasts expressing luciferase gene, luciferase images were obtained for 16 d at cardiac site. Control rat showed background signal only. (B) After transplantation with cardiomyoblasts expressing HSV1-sr39tk reporter gene, location(s), magnitude, and duration of gene expression could be monitored by PET with 18F-FHBG (gray scale). (C) Representative rat with transplant had significant activity at lateral wall, as shown by 18F-FHBG image (color scale) overlaid on 13N-NH3 perfusion image (gray scale). Control rat had homogeneous 13N-NH3 perfusion but background 18F-FHBG activity. (D) Autoradiography of same rat confirmed accumulation of 18F-FHBG at lateral wall. %ID/g = percentage injected dose per gram. (Reprinted with permission of (92).)
- FIGURE 8.
Development of NIS-transgenic mice for cardiomyocyte-specific reporter gene expression. (A) To verify cell-type-specific expression of pMHC-NIS vector, pMHC-NIS was transfected into 2 rat myoblast cell lines, L6 and H9c2, and human hepatoma cell line, SK-Hep1. Transfected L6 and H9c2 cells showed 20-fold- and 10-fold-higher 125I uptake than their parental cells, but hepatoma did not (inset). Therefore, the MHC promoter was confirmed to be active only in cardiomyocytes. (B) Small-animal PET image obtained for transgenic mouse with 124I (left, transverse; center, coronal; right, sagittal). Transgenic mouse showed higher uptake of 124I in heart (H) than in thyroid (T) or stomach (S). pcDNA-NIS = control.


Tables
Modality Reporter Reference(s) Optical reporter genes Fluorescent protein (red, green) 17,18 Luciferase (firefly, click beetle, renilla, gaussia) 9,14–16 Nuclear medicine reporter genes HSV1 TK 2,3,62,63 Human mitochondrial TK 33 D2R 34,35 NIS 41–43 Norepinephrine transporter 40,44 SSTr 39 Estrogen receptor 36 MRI reporter genes Transferrin receptor 22 β-galactosidase 23 Tyrosinase 24,25 Ferritin 26,27 LRP 28 Value for: Parameter Optical imaging Nuclear medicine imaging Spatial resolution 3–5 mm 1–2 mm Temporal resolution Seconds to minutes 10 s to minutes 3-dimensional tomography Not yet available Yes Tissue penetration 1 cm (variable) No limit Sensitivity 10−15–10−17 mol/L (bioluminescence) 10−10–10−12 mol/L 10−9–10−12 mol/L (fluorescence) Background Low (bioluminescence) Moderate to high Moderate (fluorescence) Reporter gene transfer Yes Yes Probes Yes (bioluminescence) Radiolabeled tracers No (fluorescence) Chemical synthesis or labeling labor No Yes Radiation hazard No Yes Costs Low Low (γ-camera) High (PET) Potential for clinical uses Very low Yes


