
Main menu

  • Home
  • Content
    • Current
    • Ahead of print
    • Past Issues
    • JNM Supplement
    • SNMMI Annual Meeting Abstracts
    • Continuing Education
    • JNM Podcasts
  • Subscriptions
    • Subscribers
    • Institutional and Non-member
    • Rates
    • Journal Claims
    • Corporate & Special Sales
  • Authors
    • Submit to JNM
    • Information for Authors
    • Assignment of Copyright
    • AQARA requirements
  • Info
    • Reviewers
    • Permissions
    • Advertisers
  • About
    • About Us
    • Editorial Board
    • Contact Information
  • More
    • Alerts
    • Feedback
    • Help
    • SNMMI Journals
  • SNMMI
    • JNM
    • JNMT
    • SNMMI Journals
    • SNMMI

User menu

  • Subscribe
  • My alerts
  • Log in
  • My Cart

Search

  • Advanced search
Journal of Nuclear Medicine
  • SNMMI
    • JNM
    • JNMT
    • SNMMI Journals
    • SNMMI
  • Subscribe
  • My alerts
  • Log in
  • My Cart
Journal of Nuclear Medicine

Advanced Search

  • Home
  • Content
    • Current
    • Ahead of print
    • Past Issues
    • JNM Supplement
    • SNMMI Annual Meeting Abstracts
    • Continuing Education
    • JNM Podcasts
  • Subscriptions
    • Subscribers
    • Institutional and Non-member
    • Rates
    • Journal Claims
    • Corporate & Special Sales
  • Authors
    • Submit to JNM
    • Information for Authors
    • Assignment of Copyright
    • AQARA requirements
  • Info
    • Reviewers
    • Permissions
    • Advertisers
  • About
    • About Us
    • Editorial Board
    • Contact Information
  • More
    • Alerts
    • Feedback
    • Help
    • SNMMI Journals
  • View or Listen to JNM Podcast
  • Visit JNM on Facebook
  • Join JNM on LinkedIn
  • Follow JNM on Twitter
  • Subscribe to our RSS feeds
Research ArticleCLINICAL INVESTIGATIONS

Quantitative Measures of Coronary Stenosis Severity by 64-Slice CT Angiography and Relation to Physiologic Significance of Perfusion in Nonobese Patients: Comparison with Stress Myocardial Perfusion Imaging

Akira Sato, Michiaki Hiroe, Mieko Tamura, Hirokazu Ohigashi, Toshihiro Nozato, Hiroyuki Hikita, Atsushi Takahashi, Kazutaka Aonuma and Mitsuaki Isobe
Journal of Nuclear Medicine April 2008, 49 (4) 564-572; DOI: https://doi.org/10.2967/jnumed.107.042481
Akira Sato
  • Find this author on Google Scholar
  • Find this author on PubMed
  • Search for this author on this site
Michiaki Hiroe
  • Find this author on Google Scholar
  • Find this author on PubMed
  • Search for this author on this site
Mieko Tamura
  • Find this author on Google Scholar
  • Find this author on PubMed
  • Search for this author on this site
Hirokazu Ohigashi
  • Find this author on Google Scholar
  • Find this author on PubMed
  • Search for this author on this site
Toshihiro Nozato
  • Find this author on Google Scholar
  • Find this author on PubMed
  • Search for this author on this site
Hiroyuki Hikita
  • Find this author on Google Scholar
  • Find this author on PubMed
  • Search for this author on this site
Atsushi Takahashi
  • Find this author on Google Scholar
  • Find this author on PubMed
  • Search for this author on this site
Kazutaka Aonuma
  • Find this author on Google Scholar
  • Find this author on PubMed
  • Search for this author on this site
Mitsuaki Isobe
  • Find this author on Google Scholar
  • Find this author on PubMed
  • Search for this author on this site
  • Article
  • Figures & Data
  • Info & Metrics
  • PDF
Loading

Article Figures & Data

Figures

  • Tables
  • FIGURE 1. 
    • Download figure
    • Open in new tab
    • Download powerpoint
    FIGURE 1. 

    Window settings for lumen and outer vessel boundary by CTA are the same as those for IVUS imaging. (A) Curved multiplanar reconstructed CTA image reveals significant stenosis in left anterior descending artery (arrow). (B) IVUS cross-section reveals lumen area of 2.1 mm2 and vessel area of 15.4 mm2. Cross-sectional CTA images show luminal CSA of 2.1 mm2 (C) and vessel CSA of 15.4 mm2 (D).

  • FIGURE 2. 
    • Download figure
    • Open in new tab
    • Download powerpoint
    FIGURE 2. 

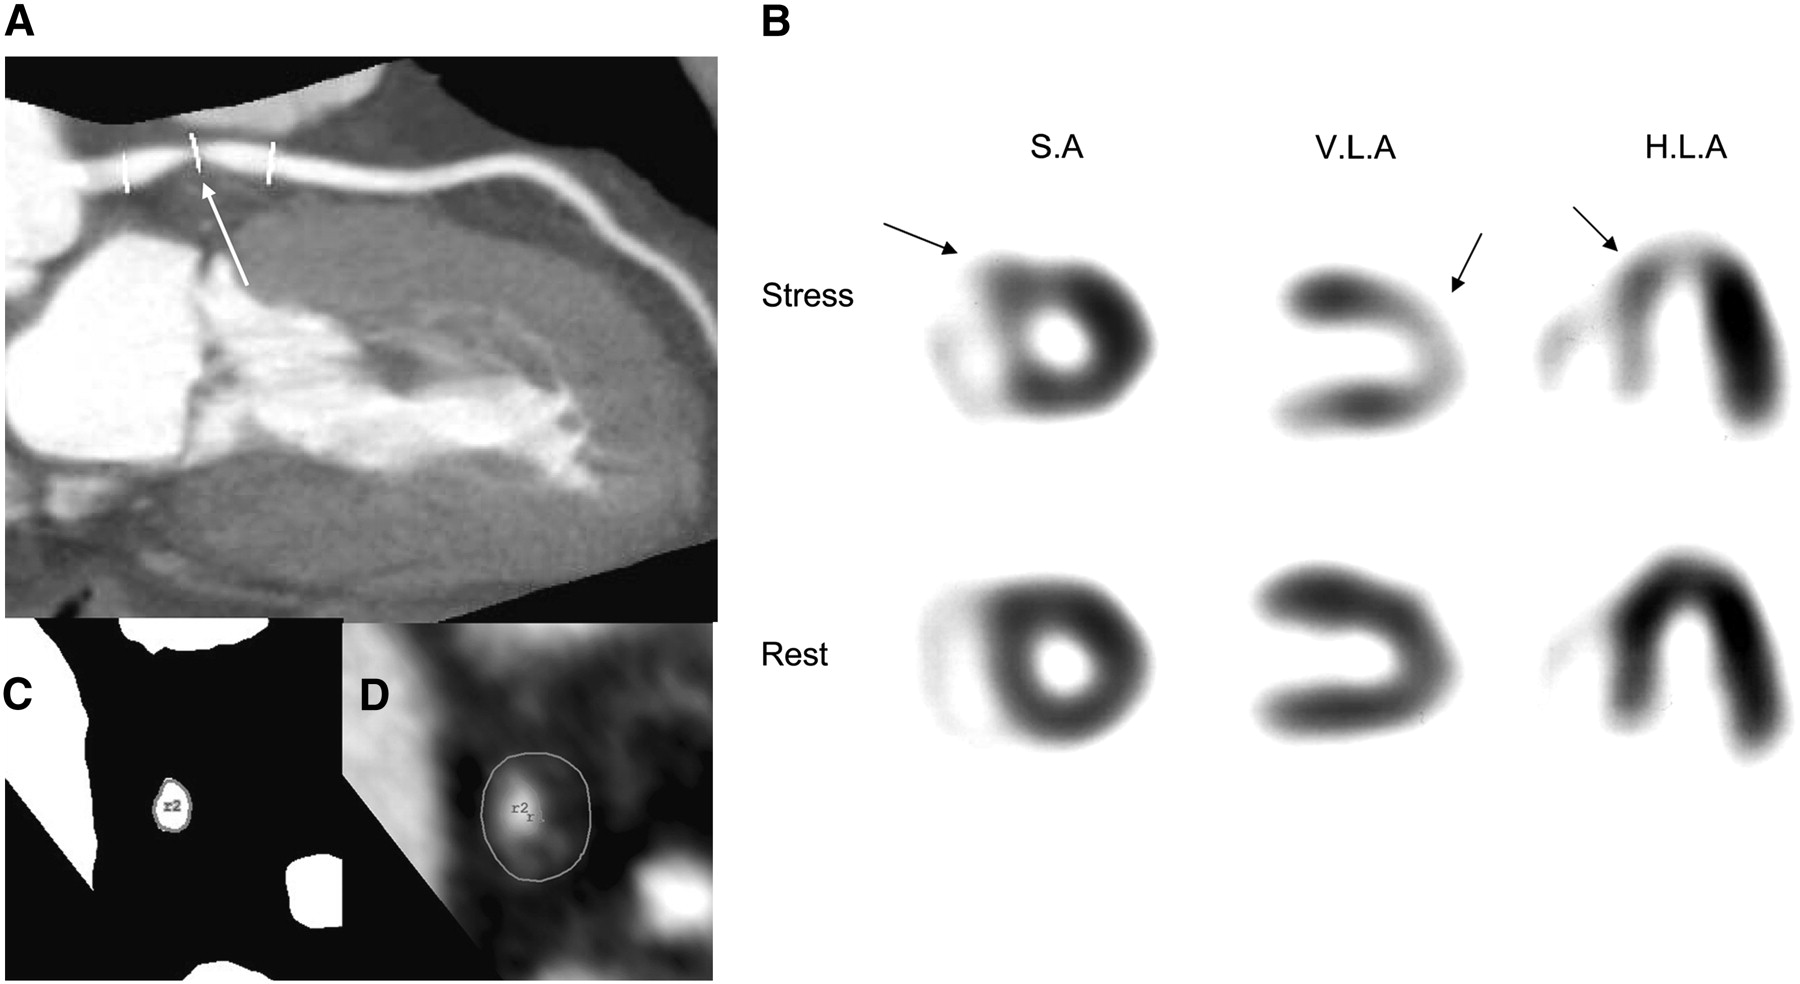
    A 65-y-old woman with chest pain. (A) CTA image using maximum-intensity projection reveals presence of significant stenosis in proximal left anterior descending artery (arrow). (C) Minimal luminal CSA is 2.6 mm2. (D) Vessel CSA is 20.9 mm2. (B) Corresponding tomograms show reversible perfusion abnormality in anterior, septal, and apical wall (arrows). S.A = short axis; V.L.A = vertical long axis; H.L.A = horizontal long axis.

  • FIGURE 3. 
    • Download figure
    • Open in new tab
    • Download powerpoint
    FIGURE 3. 

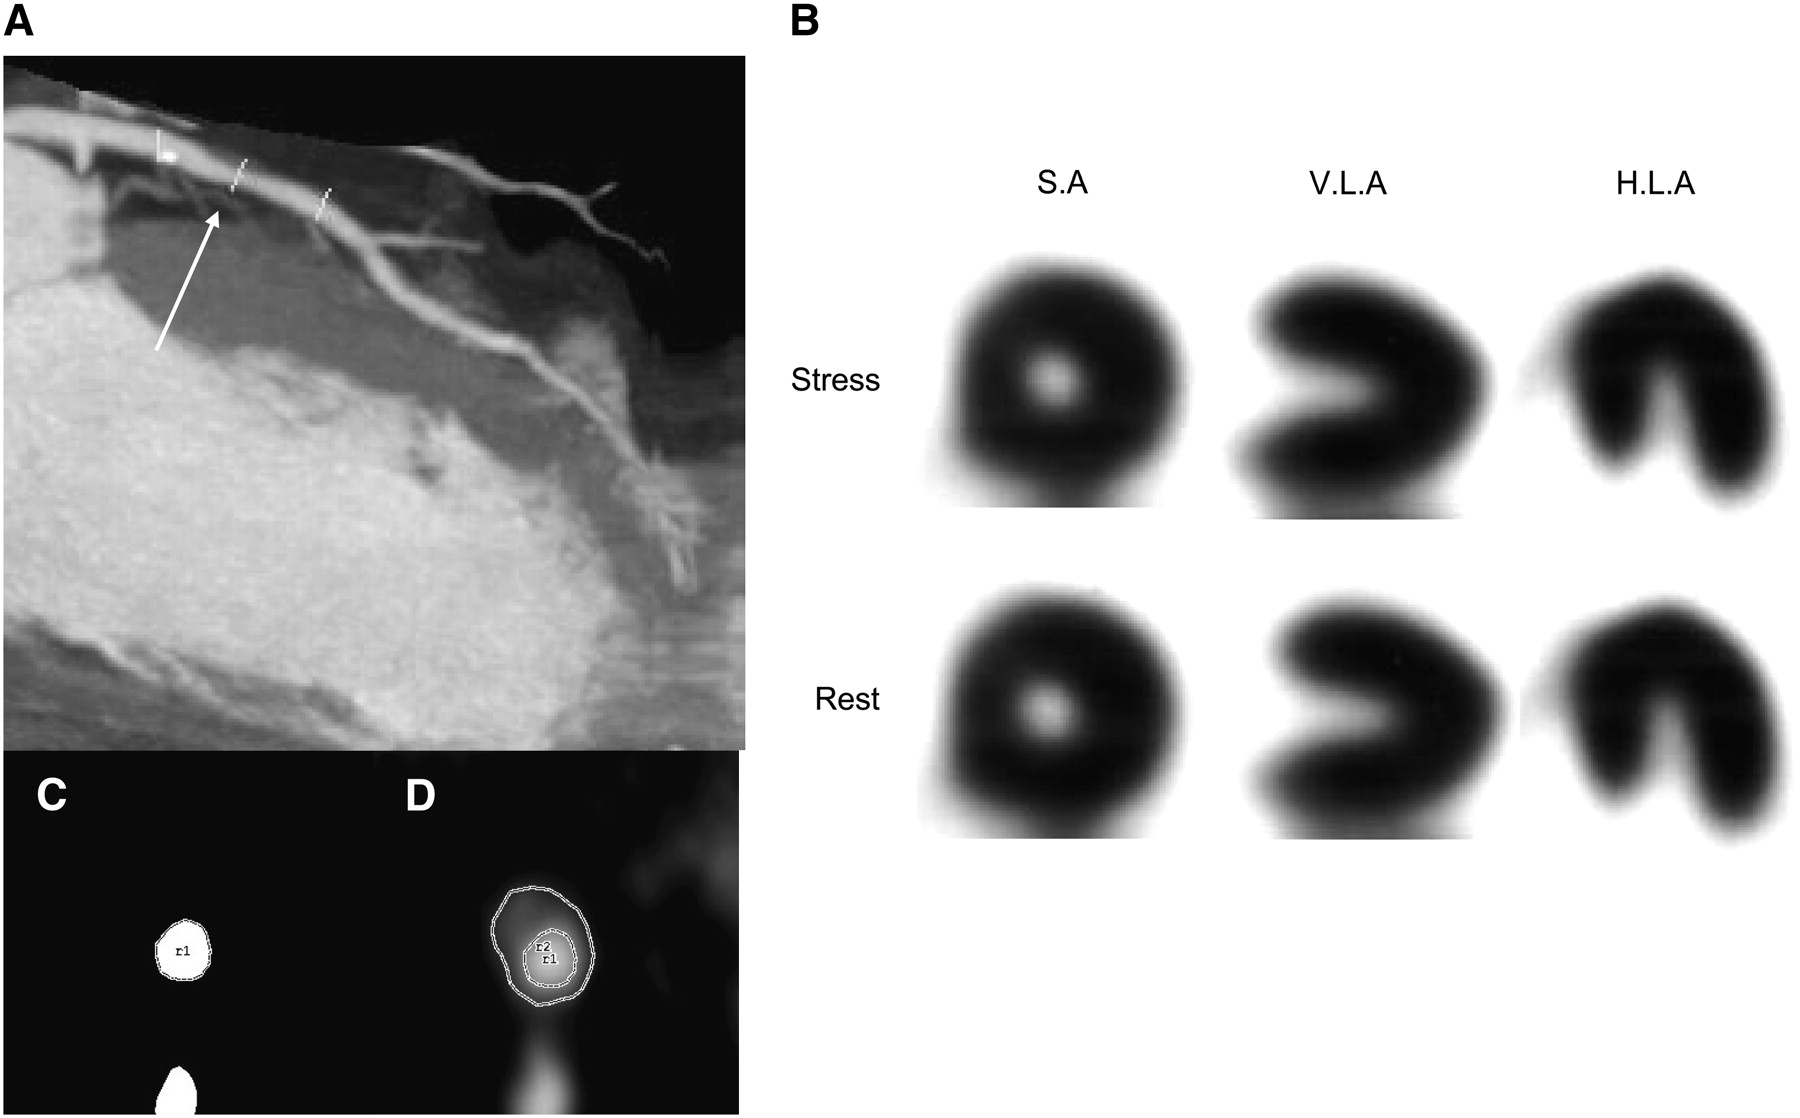
    A 63-y-old man with chest pain. (A) CTA image using maximum-intensity projection shows noncalcified plaque in left anterior descending artery (arrow). (C) Minimal luminal CSA is 4.2 mm2. (D) Vessel CSA is 12.5 mm2. (B) Corresponding tomograms show normal perfusion at peak exercise and rest. S.A = short axis; V.L.A = vertical long axis; H.L.A = horizontal long axis.
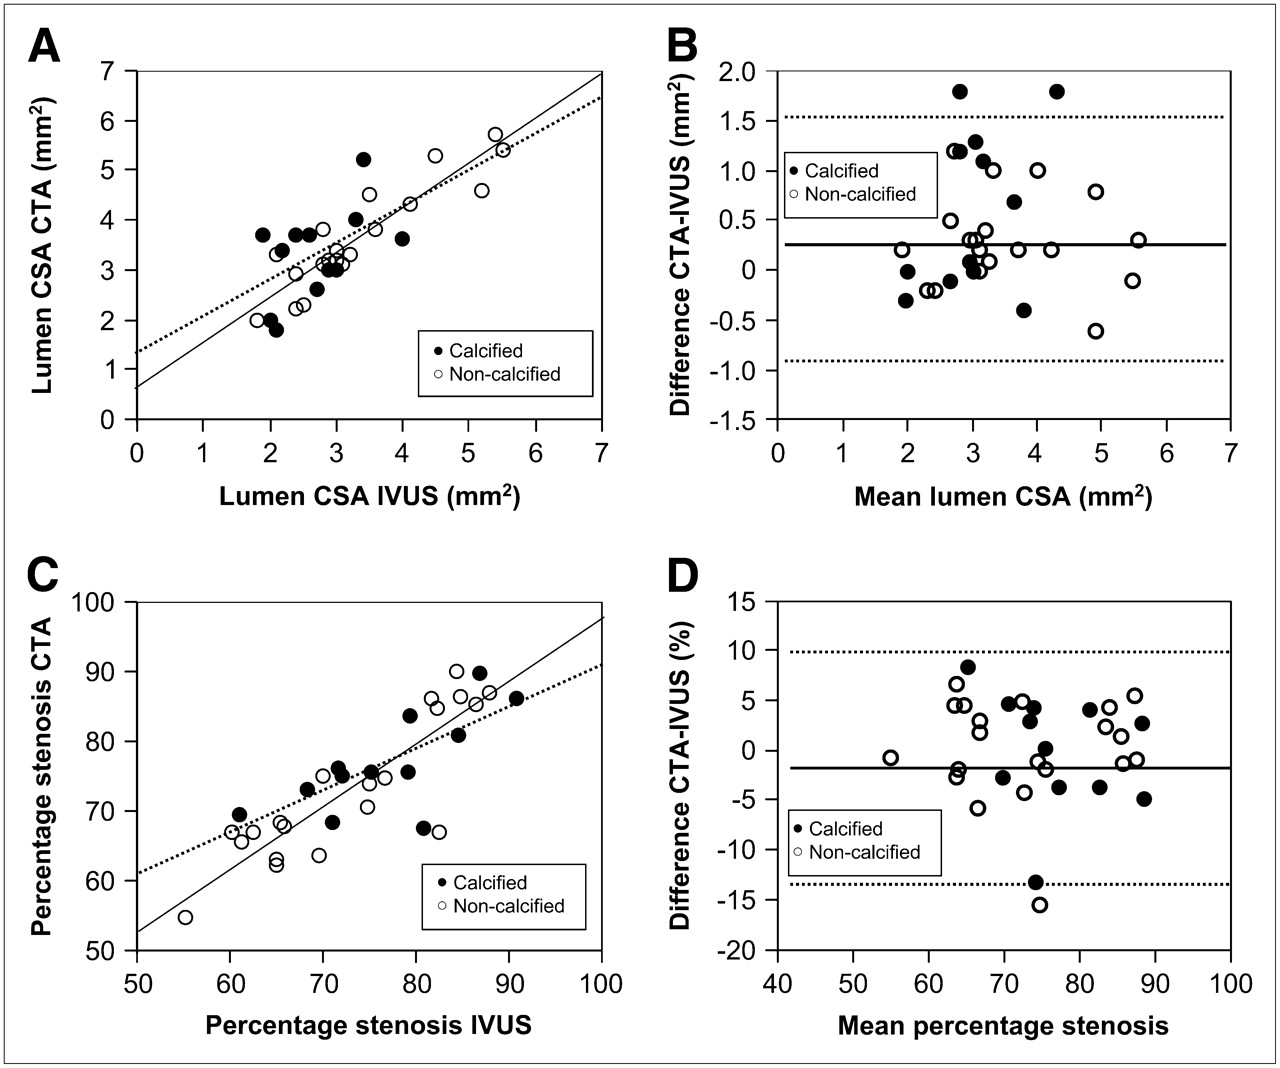
  • FIGURE 4. 
    • Download figure
    • Open in new tab
    • Download powerpoint
    FIGURE 4. 

    (A) Correlation between lumen CSAs measured by 64-slice CTA and IVUS (n = 32). Dashed lines correspond to correlation of calcified plaques (n = 12, y = 0.74x + 1.34, r = 0.55, P = 0.09), whereas solid lines correspond to correlation of noncalcified plaques (n = 20, y = 0.88x + 0.66, r = 0.91, P < 0.0001). (B) Bland–Altman analysis of differences between the lumen CSAs (mean difference, 0.27 ± 0.64 mm2). Dashed lines correspond to mean ± 2 SDs (−1.01 to 1.55 mm2). (C) Correlations between percentage stenosis measured by 64-slice CTA and IVUS (n = 32). Dashed lines correspond to correlation of calcified plaques (n = 12, y = 0.61x + 30.1, r = 0.73, P = 0.0069), whereas solid lines correspond to correlation of noncalcified plaques (n = 20, y = 0.88x + 8.43, r = 0.87, P < 0.0001). (D) Bland–Altman analysis of differences between percentage stenosis (mean difference, −0.22% ± 11%). Dashed lines correspond to mean ± 2 SDs (−11.2% to 10.7%). Open circles indicate noncalcified plaques, whereas solid circles indicate calcified plaques.

  • FIGURE 5. 
    • Download figure
    • Open in new tab
    • Download powerpoint
    FIGURE 5. 

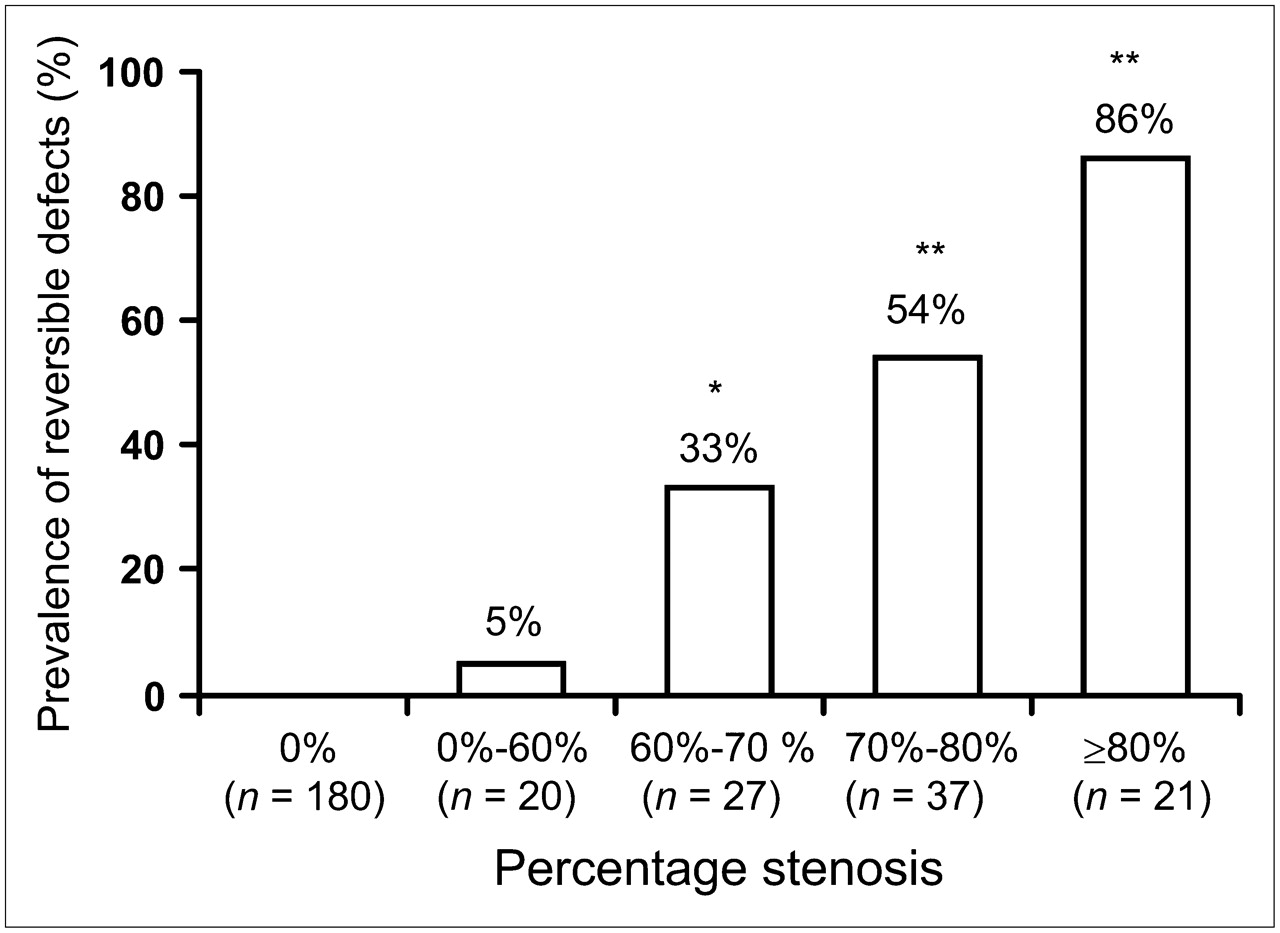
    Prevalence of reversible defects evaluated by SPECT in study groups defined according to percentage stenosis obtained by CTA. Numbers under the bars represent number of vessels. *P = 0.018. **P < 0.0001 vs. percentage stenosis of 0%–60%.

  • FIGURE 6. 
    • Download figure
    • Open in new tab
    • Download powerpoint
    FIGURE 6. 

    (A) Quantitative perfusion defects in relation to percentage stenosis by CTA. (B) Quantitative perfusion defects in relation to minimal luminal CSA. Open circles indicate negative SPECT, and solid circles indicate positive SPECT.

  • FIGURE 7. 
    • Download figure
    • Open in new tab
    • Download powerpoint
    FIGURE 7. 

    Diagnostic value of CTA measurements for assessment of functionally significant coronary artery stenosis using stress 201Tl SPECT. ROC curves of lesion luminal CSA (A) and lesion percentage stenosis (B).

Tables

  • Figures
    • View popup
    TABLE 1

    Characteristics of Patients (n = 104)

    CharacteristicValue
    Age (y)66.9 ± 11
    Male/female76/28
    Hypertension (%)55 (53%)
    Hyperlipidemia (%)57 (55%)
    Diabetes (%)41 (39%)
    Smoking (%)47 (45%)
    BMI (kg/m2), median (IQR)23.8 (21.1–25.6)
    Symptoms
     Anginal chest pain65 (62%)
     Atypical chest pain22 (21%)
    Pretest likelihood of CAD
     Low6 (6%)
     Intermediate78 (75%)
     High20 (19%)
    Resting ECG
     Negative T7 (7%)
     ST depression14 (13%)
     Left ventricular hypertrophy25 (24%)
    • BMI = body mass index; IQR = interquartile range.

    • View popup
    TABLE 2

    Comparison of 64-Slice CTA Measurements According to Stress 201Tl SPECT Results

    Lesion
    SPECT resultMinimal luminal CSA (mm2)Vessel CSA (mm2)Plaque CSA (mm2)Stenosis (%)
    (+) (n = 48)2.8 ± 0.6*13.5 ± 5.810.6 ± 5.576.6 ± 7.9*
    (−) (n = 57)4.9 ± 1.414.0 ± 4.29.2 ± 3.764.1 ± 10.8
    • ↵* P < 0.0001 vs. SPECT (−).

    • View popup
    TABLE 3

    Diagnostic Accuracy of Functionally Significant Coronary Artery Stenosis According to Stenosis Severity by 64-Slice CTA

    Stenosis criterion (%)Sensitivity (%)Specificity (%)PPV (%)NPV (%)
    Vessels for analysis only with evaluable vessels
    >6098845599
    >7079926696
    >8038988689
    All vessels for analysis with positive nonevaluable vessels
    >6098774699
    >7081845196
    >8043904889
PreviousNext
Back to top

In this issue

Journal of Nuclear Medicine: 49 (4)
Journal of Nuclear Medicine
Vol. 49, Issue 4
April 2008
  • Table of Contents
  • Table of Contents (PDF)
  • About the Cover
  • Index by author
Print
Download PDF
Article Alerts
Sign In to Email Alerts with your Email Address
Email Article

Thank you for your interest in spreading the word on Journal of Nuclear Medicine.

NOTE: We only request your email address so that the person you are recommending the page to knows that you wanted them to see it, and that it is not junk mail. We do not capture any email address.

Enter multiple addresses on separate lines or separate them with commas.
Quantitative Measures of Coronary Stenosis Severity by 64-Slice CT Angiography and Relation to Physiologic Significance of Perfusion in Nonobese Patients: Comparison with Stress Myocardial Perfusion Imaging
(Your Name) has sent you a message from Journal of Nuclear Medicine
(Your Name) thought you would like to see the Journal of Nuclear Medicine web site.
Citation Tools
Quantitative Measures of Coronary Stenosis Severity by 64-Slice CT Angiography and Relation to Physiologic Significance of Perfusion in Nonobese Patients: Comparison with Stress Myocardial Perfusion Imaging
Akira Sato, Michiaki Hiroe, Mieko Tamura, Hirokazu Ohigashi, Toshihiro Nozato, Hiroyuki Hikita, Atsushi Takahashi, Kazutaka Aonuma, Mitsuaki Isobe
Journal of Nuclear Medicine Apr 2008, 49 (4) 564-572; DOI: 10.2967/jnumed.107.042481

Citation Manager Formats

  • BibTeX
  • Bookends
  • EasyBib
  • EndNote (tagged)
  • EndNote 8 (xml)
  • Medlars
  • Mendeley
  • Papers
  • RefWorks Tagged
  • Ref Manager
  • RIS
  • Zotero
Share
Quantitative Measures of Coronary Stenosis Severity by 64-Slice CT Angiography and Relation to Physiologic Significance of Perfusion in Nonobese Patients: Comparison with Stress Myocardial Perfusion Imaging
Akira Sato, Michiaki Hiroe, Mieko Tamura, Hirokazu Ohigashi, Toshihiro Nozato, Hiroyuki Hikita, Atsushi Takahashi, Kazutaka Aonuma, Mitsuaki Isobe
Journal of Nuclear Medicine Apr 2008, 49 (4) 564-572; DOI: 10.2967/jnumed.107.042481
Twitter logo Facebook logo LinkedIn logo Mendeley logo
  • Tweet Widget
  • Facebook Like
  • Google Plus One
Bookmark this article

Jump to section

  • Article
    • Abstract
    • MATERIALS AND METHODS
    • RESULTS
    • DISCUSSION
    • CONCLUSION
    • Footnotes
    • References
  • Figures & Data
  • Info & Metrics
  • PDF

Related Articles

  • This Month in JNM
  • PubMed
  • Google Scholar

Cited By...

  • Coronary Microvascular Dysfunction: Clinical Considerations and Noninvasive Diagnosis
  • SNMMI/ASNC/SCCT Guideline for Cardiac SPECT/CT and PET/CT 1.0
  • Reply
  • Impact of Coronary Plaque Composition on Cardiac Troponin Elevation After Percutaneous Coronary Intervention in Stable Angina Pectoris: A Computed Tomography Analysis
  • 64-slice CT angiography for the detection of functionally significant coronary stenoses: comparison with stress myocardial perfusion imaging
  • Quantitative Relationship Between the Extent and Morphology of Coronary Atherosclerotic Plaque and Downstream Myocardial Perfusion
  • Quantification of Coronary Arterial Stenoses by Multidetector CT Angiography in Comparison With Conventional Angiography: Methods, Caveats, and Implications
  • Comparison of the Extent and Severity of Myocardial Perfusion Defects Measured by CT Coronary Angiography and SPECT Myocardial Perfusion Imaging
  • ACCF/ACR/AHA/NASCI/SAIP/SCAI/SCCT 2010 Expert Consensus Document on Coronary Computed Tomographic Angiography: A Report of the American College of Cardiology Foundation Task Force on Expert Consensus Documents
  • ACCF/ACR/AHA/NASCI/SAIP/SCAI/SCCT 2010 Expert Consensus Document on Coronary Computed Tomographic Angiography: A Report of the American College of Cardiology Foundation Task Force on Expert Consensus Documents
  • Cardiac PET Imaging for the Detection and Monitoring of Coronary Artery Disease and Microvascular Health
  • Risk Assessment and Predictive Value of Coronary Artery Disease Testing
  • Is Computed Tomography Coronary Angiography the Most Accurate and Effective Noninvasive Imaging Tool to Evaluate Patients With Acute Chest Pain in the Emergency Department?: CT Coronary Angiography Is the Most Accurate and Effective Noninvasive Imaging Tool for Evaluating Patients Presenting With Chest Pain to the Emergency Department: Antagonist Viewpoint
  • The Year in Cardiac Imaging
  • Noninvasive Diagnosis and Prognosis Assessment in Chronic Coronary Artery Disease: Stress Testing With and Without Imaging Perspective
  • Google Scholar

More in this TOC Section

  • Feasibility of Ultra-Low-Activity 18F-FDG PET/CT Imaging Using a Long–Axial-Field-of-View PET/CT System
  • Cardiac Presynaptic Sympathetic Nervous Function Evaluated by Cardiac PET in Patients with Chronotropic Incompetence Without Heart Failure
  • Validation and Evaluation of a Vendor-Provided Head Motion Correction Algorithm on the uMI Panorama PET/CT System
Show more Clinical Investigations

Similar Articles

SNMMI

© 2025 SNMMI

Powered by HighWire