
Main menu

  • Home
  • Content
    • Current
    • Ahead of print
    • Past Issues
    • JNM Supplement
    • SNMMI Annual Meeting Abstracts
    • Continuing Education
    • JNM Podcasts
  • Subscriptions
    • Subscribers
    • Institutional and Non-member
    • Rates
    • Journal Claims
    • Corporate & Special Sales
  • Authors
    • Submit to JNM
    • Information for Authors
    • Assignment of Copyright
    • AQARA requirements
  • Info
    • Reviewers
    • Permissions
    • Advertisers
  • About
    • About Us
    • Editorial Board
    • Contact Information
  • More
    • Alerts
    • Feedback
    • Help
    • SNMMI Journals
  • SNMMI
    • JNM
    • JNMT
    • SNMMI Journals
    • SNMMI

User menu

  • Subscribe
  • My alerts
  • Log in
  • My Cart

Search

  • Advanced search
Journal of Nuclear Medicine
  • SNMMI
    • JNM
    • JNMT
    • SNMMI Journals
    • SNMMI
  • Subscribe
  • My alerts
  • Log in
  • My Cart
Journal of Nuclear Medicine

Advanced Search

  • Home
  • Content
    • Current
    • Ahead of print
    • Past Issues
    • JNM Supplement
    • SNMMI Annual Meeting Abstracts
    • Continuing Education
    • JNM Podcasts
  • Subscriptions
    • Subscribers
    • Institutional and Non-member
    • Rates
    • Journal Claims
    • Corporate & Special Sales
  • Authors
    • Submit to JNM
    • Information for Authors
    • Assignment of Copyright
    • AQARA requirements
  • Info
    • Reviewers
    • Permissions
    • Advertisers
  • About
    • About Us
    • Editorial Board
    • Contact Information
  • More
    • Alerts
    • Feedback
    • Help
    • SNMMI Journals
  • View or Listen to JNM Podcast
  • Visit JNM on Facebook
  • Join JNM on LinkedIn
  • Follow JNM on Twitter
  • Subscribe to our RSS feeds
OtherBASIC SCIENCE INVESTIGATIONS

PET Imaging of VPAC1 Expression in Experimental and Spontaneous Prostate Cancer

Kaijun Zhang, Mohan R. Aruva, Nylla Shanthly, Christopher A. Cardi, Satish Rattan, Chirag Patel, Christopher Kim, Peter A. McCue, Eric Wickstrom and Mathew L. Thakur
Journal of Nuclear Medicine January 2008, 49 (1) 112-121; DOI: https://doi.org/10.2967/jnumed.107.043703
Kaijun Zhang
  • Find this author on Google Scholar
  • Find this author on PubMed
  • Search for this author on this site
Mohan R. Aruva
  • Find this author on Google Scholar
  • Find this author on PubMed
  • Search for this author on this site
Nylla Shanthly
  • Find this author on Google Scholar
  • Find this author on PubMed
  • Search for this author on this site
Christopher A. Cardi
  • Find this author on Google Scholar
  • Find this author on PubMed
  • Search for this author on this site
Satish Rattan
  • Find this author on Google Scholar
  • Find this author on PubMed
  • Search for this author on this site
Chirag Patel
  • Find this author on Google Scholar
  • Find this author on PubMed
  • Search for this author on this site
Christopher Kim
  • Find this author on Google Scholar
  • Find this author on PubMed
  • Search for this author on this site
Peter A. McCue
  • Find this author on Google Scholar
  • Find this author on PubMed
  • Search for this author on this site
Eric Wickstrom
  • Find this author on Google Scholar
  • Find this author on PubMed
  • Search for this author on this site
Mathew L. Thakur
  • Find this author on Google Scholar
  • Find this author on PubMed
  • Search for this author on this site
  • Article
  • Figures & Data
  • Supplemental
  • Info & Metrics
  • PDF
Loading

Article Figures & Data

Figures

  • Tables
  • Additional Files
  • FIGURE 1. 
    • Download figure
    • Open in new tab
    • Download powerpoint
    FIGURE 1. 

    Schematic presentation of Cu-TP3939 (A) and HPLC eluates of 64Cu-TP3939 at 6.7 min and free 64Cu at 3.9 min (B). Diagonal line represents gradient.
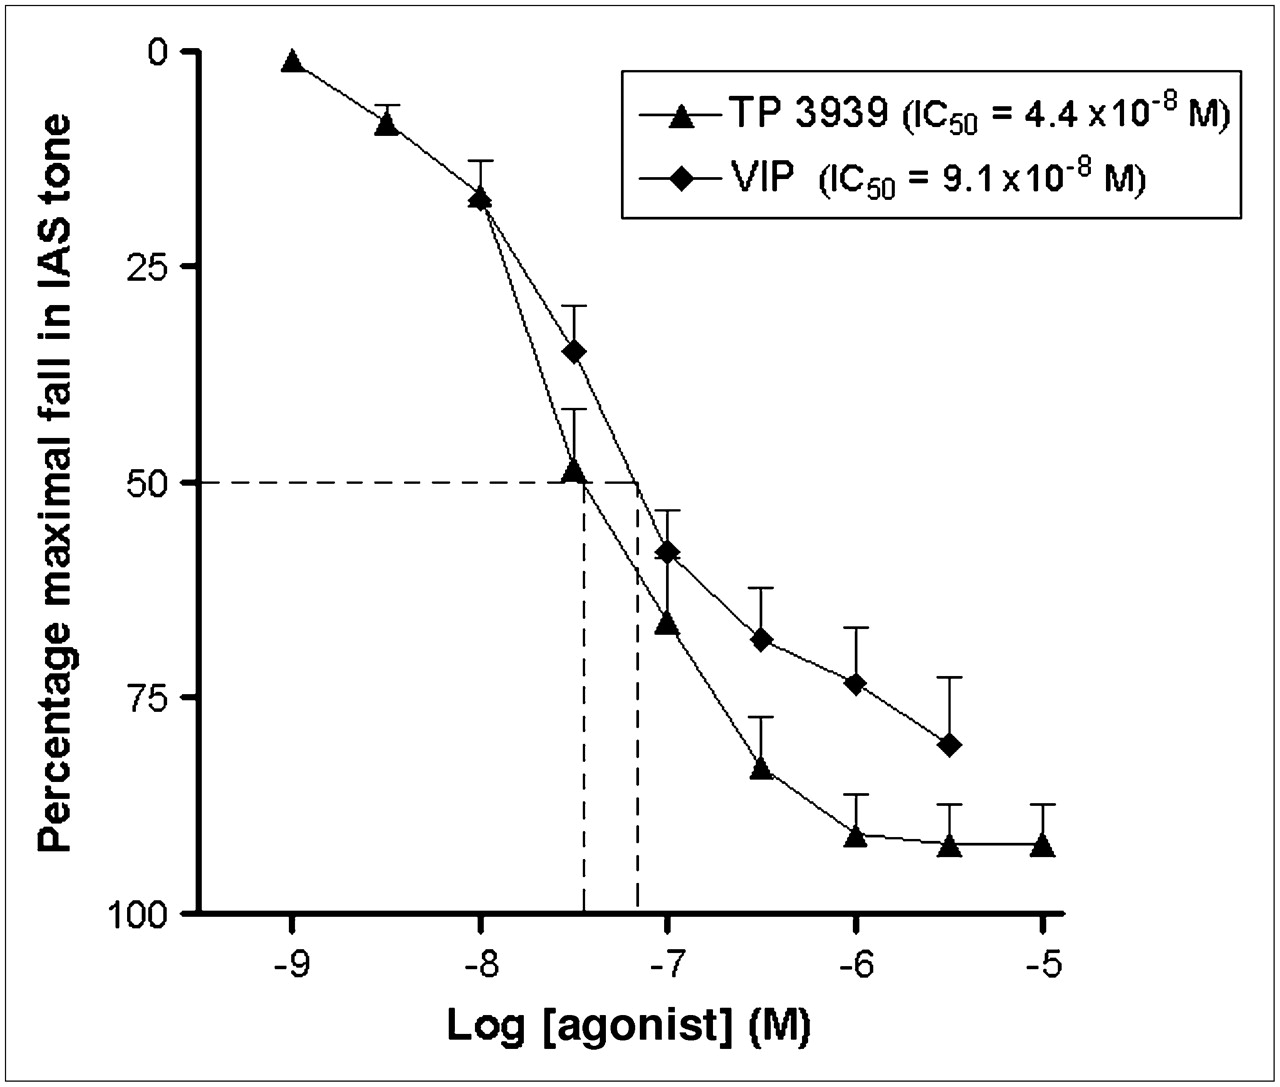
  • FIGURE 2. 
    • Download figure
    • Open in new tab
    • Download powerpoint
    FIGURE 2. 

    Muscle relaxivity assays as function of concentration for VIP28 and its analogue TP3939. IC50 values are calculated as concentration at which 50% relaxivity occurred.

  • FIGURE 3. 
    • Download figure
    • Open in new tab
    • Download powerpoint
    FIGURE 3. 

    Scatchard plots for 99mTc-TP3939 binding to PC3 cells known to express VPAC1 oncogene receptors. Kd value was 0.77 × 10⁻⁹ M.
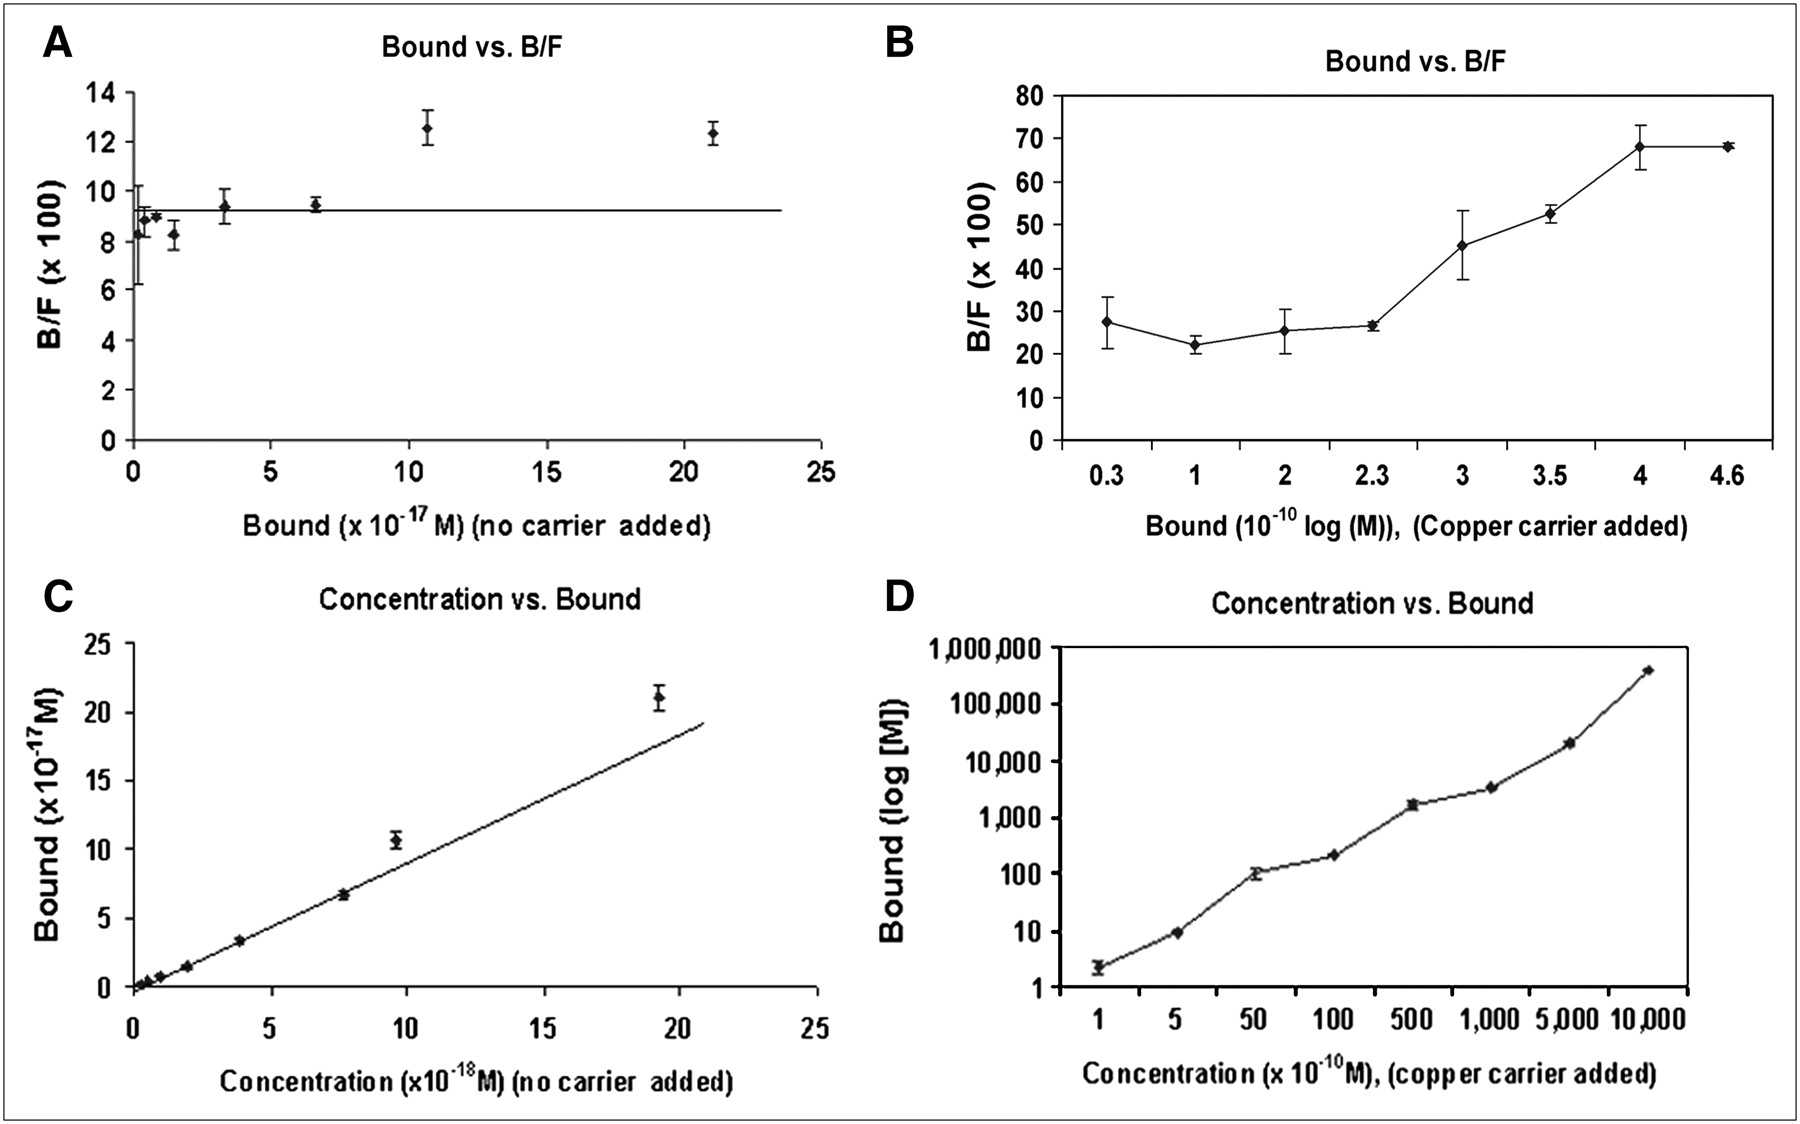
  • FIGURE 4. 
    • Download figure
    • Open in new tab
    • Download powerpoint
    FIGURE 4. 

    64CuCl2 binding assays for PC3 cells performed with added copper carrier (B and D) and with no 64CuCl2 carrier added (A and C). In either case, data reveal nonsaturable, nonspecific binding.
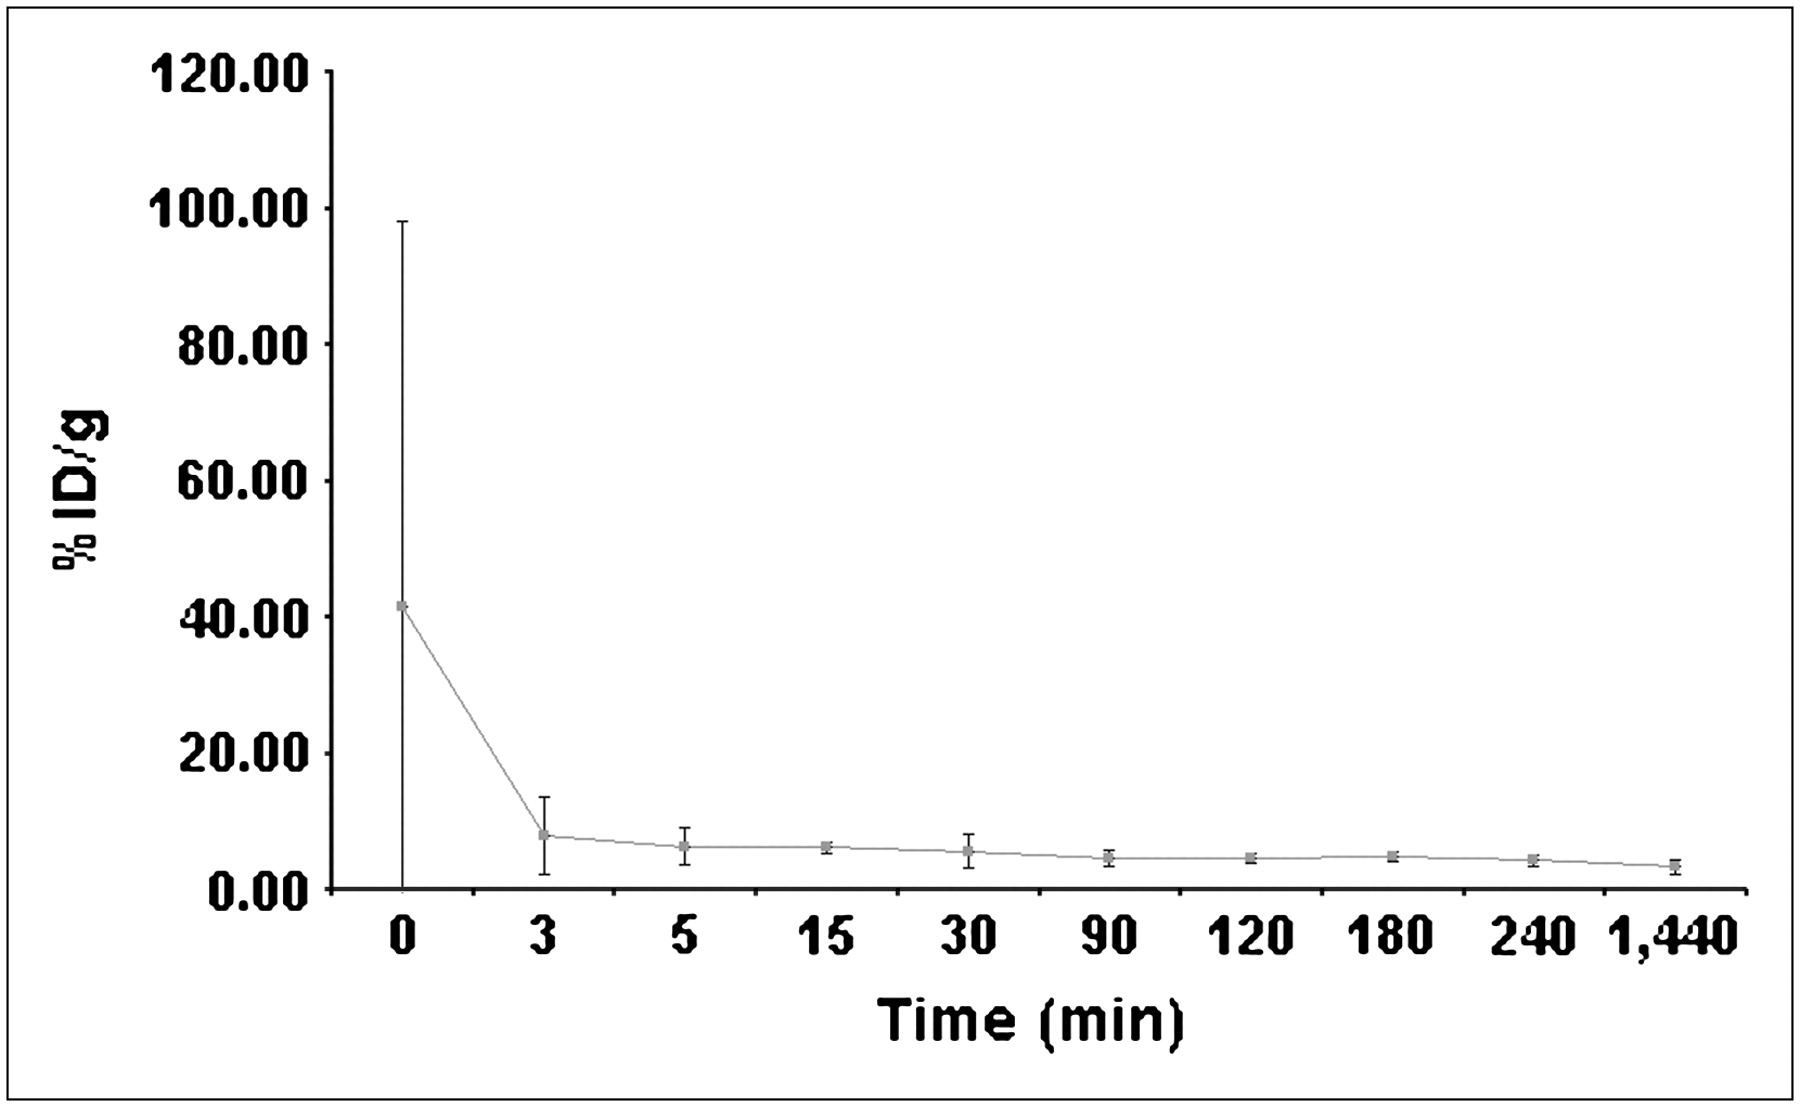
  • FIGURE 5. 
    • Download figure
    • Open in new tab
    • Download powerpoint
    FIGURE 5. 

    Blood clearance curve of 64Cu-TP3939 in athymic nude mice (n = 3).
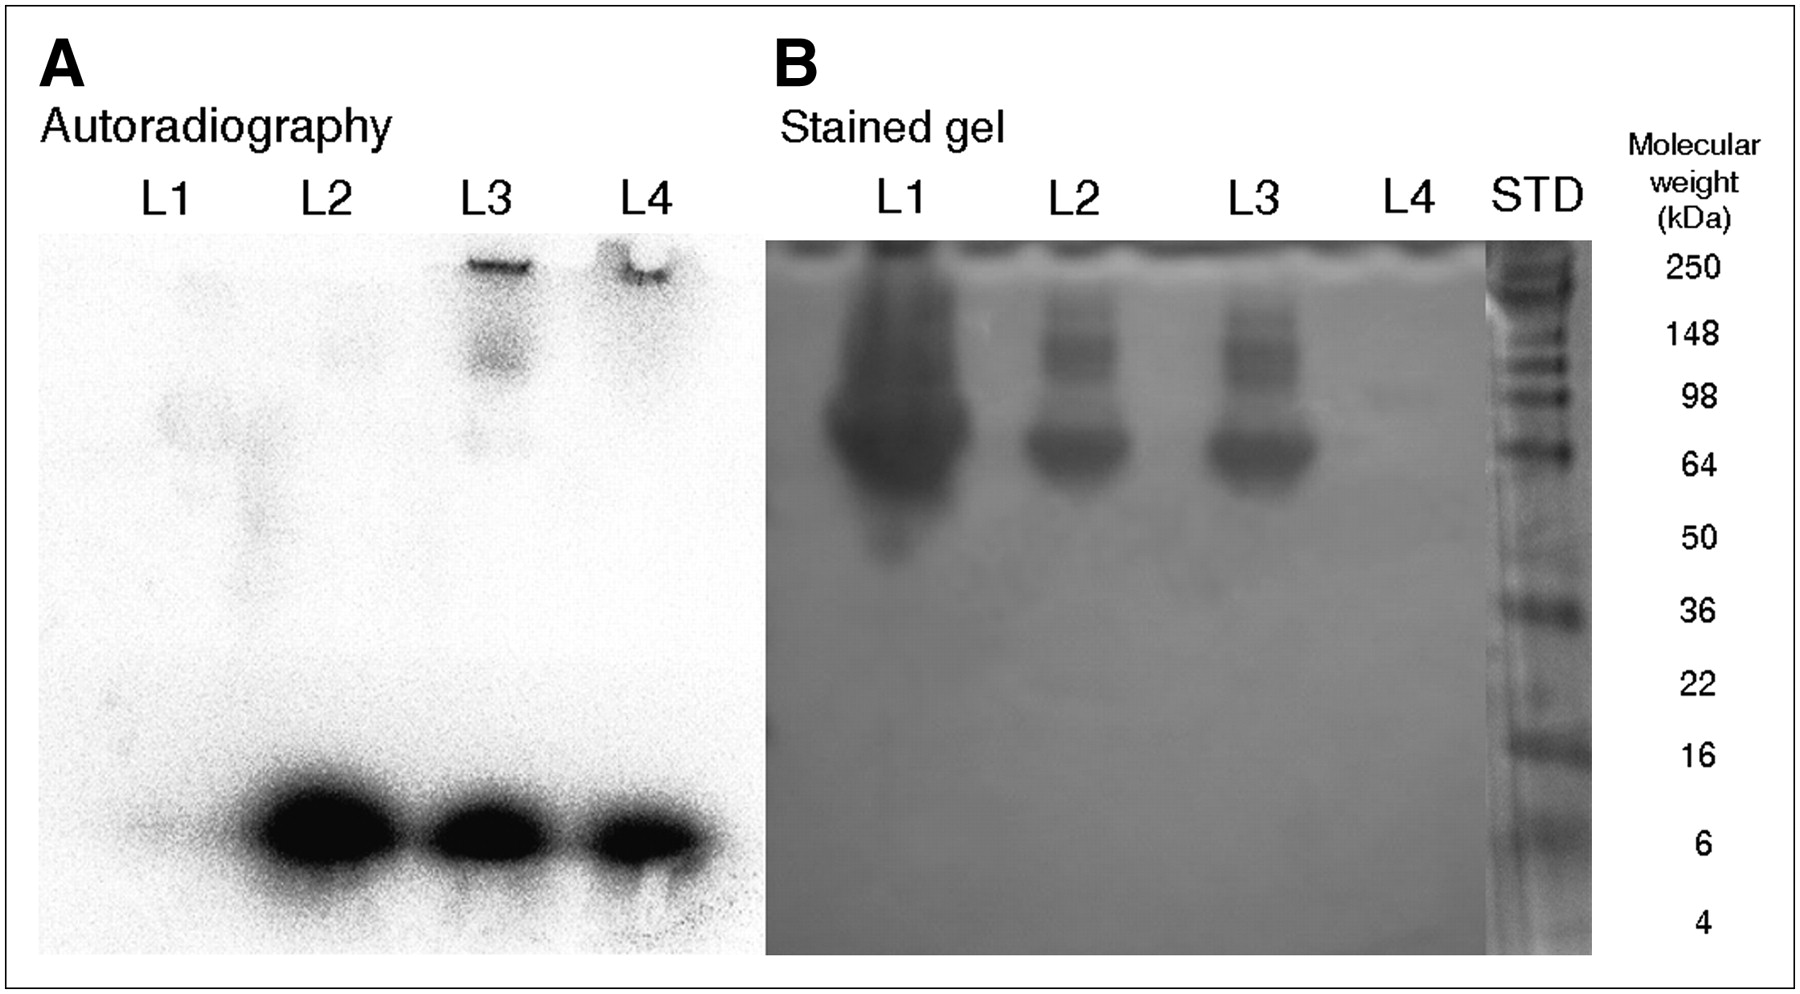
  • FIGURE 6. 
    • Download figure
    • Open in new tab
    • Download powerpoint
    FIGURE 6. 

    Autoradiography (A) and gel stained with Coomassie blue (B) after PAGE analysis of serum isolated from mouse after intravenous administration of 64Cu-TP3939. Lane 1 (L1) = 64Cu-TP3939 in mouse serum; lane 2 (L2) = 64Cu-TP3939 with human serum albumin; lane 3 (L3) = 64CuCl2 with human serum albumin; lane 4 (L4) = 64CuCl2; STD = molecular weight standard.

  • FIGURE 7. 
    • Download figure
    • Open in new tab
    • Download powerpoint
    FIGURE 7. 

    (A) Transaxial PET images demonstrate high uptake of 64Cu-TP3939 in xenografted PC3 tumor in right flank of athymic nude mouse (dashed arrows). Images were taken 4 and 24 h after injection of 64Cu-TP3939. (B) Presented from left to right are composite of 18F-FDG, CT, and 64Cu-TP3939 images obtained from TRAMP I and TRAMP II transgenic mice and histology of their corresponding prostate glands. One-hour 18F-FDG images show only bladder activity (solid arrow). In 4-h CT images, dashed and solid arrows show prostate and bladder, respectively. Four-hour 64Cu-TP3939 transaxial PET images show only colon activity (oval-head arrow) in TRAMP I, whereas in TRAMP II, significant PC uptake (dashed arrow) and negligible colon uptake are seen. Prostate histology (×40) indicates grade II and grade IV prostate intraepithelial neoplasia in TRAMP I and TRAMP II, respectively (black arrows). Tumor with histology grade IV is visible with 64Cu-TP3939 but not with 18F-FDG.

Tables

  • Figures
  • Additional Files
    • View popup
    TABLE 1

    IC50 and Kd Values

    PeptideIC50Kd
    TP39394.4 × 10−8 M0.77 × 10−9 M
    VIP289.1 × 10−8 M15.0 × 10−9 M
    • View popup
    TABLE 2

    PAGE Analysis: Estimated Molecular Weights and % Radioactivity Associated with Them

    Molecular weight (kDa)Lane 1: 64Cu-TP3939 in serum (in vivo) (%)Lane 2: 64Cu-TP3939 with HAS (%)Lane 3: 64CuCl2 with HAS (%)Lane 4: 64CuCl2 (%)
    >9810.080.472.252.46
    50–644.030.250.170.38
    6–161.230.090.160.45
    <4–483.9199.1997.4296.74
    • HSA = human serum albumin.

    • View popup
    TABLE 3

    Tissue Distribution (%ID/g) of 64Cu-TP3939 in PC3 Tumor-Bearing Nude Mice (n = 5)

    Tissue4 h24 hP
    Muscle1.94 ± 0.851.15 ± 0.180.17
    Intestine11.00 ± 1.647.67 ± 2.480.06
    Heart9.13 ± 5.634.14 ± 0.650.19
    Lungs34.31 ± 9.7619.93 ± 5.560.06
    Blood3.85 ± 1.142.38 ± 0.260.07
    Spleen19.22 ± 9.133.56 ± 0.380.03
    Kidneys18.38 ± 9.9510.06 ± 0.420.21
    Liver55.00 ± 12.6227.58 ± 2.180.01
    Tumor7.48 ± 3.635.78 ± 0.660.47
    T/M ratio3.98 ± 1.435.17 ± 1.320.29
    T/B ratio1.94 ± 0.662.46 ± 0.450.28
    • View popup
    TABLE 4

    Tissue Distribution (%ID/g) of 64CuCl2 in PC3 Tumor-Bearing Nude Mice (n = 5)

    Tissue4 h24 hP
    Muscle0.69 ± 0.210.86 ± 0.100.14
    Intestine8.84 ± 1.304.58 ± 0.760.00
    Heart3.66 ± 0.433.38 ± 0.280.25
    Lungs10.17 ± 1.956.32 ± 1.570.01
    Blood1.73 ± 0.301.32 ± 0.140.03
    Spleen2.26 ± 0.211.84 ± 0.320.04
    Kidneys9.18 ± 0.798.38 ± 1.470.32
    Liver19.30 ± 4.3719.95 ± 4.520.82
    Tumor4.79 ± 0.344.03 ± 0.830.10
    T/M ratio7.40 ± 1.714.73 ± 1.190.02
    T/B ratio2.81 ± 0.333.04 ± 0.430.37
    • View popup
    TABLE 5

    Tissue Distribution (%ID/g) of 64Cu-TP3939 in Mice Bearing PC3 Xenografts (n = 5, 24 h)

    TissueReceptors unblockedReceptors blockedP
    Muscle1.15 ± 0.180.65 ± 0.110.01
    Intestine7.67 ± 2.483.90 ± 0.500.01
    Heart4.14 ± 0.652.70 ± 0.640.02
    Lungs19.93 ± 5.567.01 ± 2.790.01
    Blood2.38 ± 0.261.35 ± 0.300.01
    Spleen3.56 ± 0.381.60 ± 0.240.01
    Kidneys10.06 ± 0.425.24 ± 0.960.01
    Liver27.58 ± 2.1812.44 ± 3.570.01
    Tumor5.78 ± 0.661.84 ± 0.440.01
    T/M ratio5.17 ± 1.322.91 ± 0.910.03
    T/B ratio2.46 ± 0.451.43 ± 0.560.04

Additional Files

  • Figures
  • Tables
  • Supplemental Data

    Files in this Data Supplement:

    • Supplemental Figure 1
PreviousNext
Back to top

In this issue

Journal of Nuclear Medicine: 49 (1)
Journal of Nuclear Medicine
Vol. 49, Issue 1
January 2008
  • Table of Contents
  • Table of Contents (PDF)
  • About the Cover
  • Index by author
Print
Download PDF
Article Alerts
Sign In to Email Alerts with your Email Address
Email Article

Thank you for your interest in spreading the word on Journal of Nuclear Medicine.

NOTE: We only request your email address so that the person you are recommending the page to knows that you wanted them to see it, and that it is not junk mail. We do not capture any email address.

Enter multiple addresses on separate lines or separate them with commas.
PET Imaging of VPAC1 Expression in Experimental and Spontaneous Prostate Cancer
(Your Name) has sent you a message from Journal of Nuclear Medicine
(Your Name) thought you would like to see the Journal of Nuclear Medicine web site.
Citation Tools
PET Imaging of VPAC1 Expression in Experimental and Spontaneous Prostate Cancer
Kaijun Zhang, Mohan R. Aruva, Nylla Shanthly, Christopher A. Cardi, Satish Rattan, Chirag Patel, Christopher Kim, Peter A. McCue, Eric Wickstrom, Mathew L. Thakur
Journal of Nuclear Medicine Jan 2008, 49 (1) 112-121; DOI: 10.2967/jnumed.107.043703

Citation Manager Formats

  • BibTeX
  • Bookends
  • EasyBib
  • EndNote (tagged)
  • EndNote 8 (xml)
  • Medlars
  • Mendeley
  • Papers
  • RefWorks Tagged
  • Ref Manager
  • RIS
  • Zotero
Share
PET Imaging of VPAC1 Expression in Experimental and Spontaneous Prostate Cancer
Kaijun Zhang, Mohan R. Aruva, Nylla Shanthly, Christopher A. Cardi, Satish Rattan, Chirag Patel, Christopher Kim, Peter A. McCue, Eric Wickstrom, Mathew L. Thakur
Journal of Nuclear Medicine Jan 2008, 49 (1) 112-121; DOI: 10.2967/jnumed.107.043703
Twitter logo Facebook logo LinkedIn logo Mendeley logo
  • Tweet Widget
  • Facebook Like
  • Google Plus One
Bookmark this article

Jump to section

  • Article
    • Abstract
    • MATERIALS AND METHODS
    • RESULTS
    • DISCUSSION
    • CONCLUSION
    • Acknowledgments
    • Footnotes
    • References
  • Figures & Data
  • Supplemental
  • Info & Metrics
  • PDF

Related Articles

  • This Month in JNM
  • PubMed
  • Google Scholar

Cited By...

  • Reduced 64Cu Uptake and Tumor Growth Inhibition by Knockdown of Human Copper Transporter 1 in Xenograft Mouse Model of Prostate Cancer
  • VPAC1 Receptors for Imaging Breast Cancer: A Feasibility Study
  • Design and Evaluation of Novel Radiolabelled VIP Derivatives for Tumour Targeting
  • New Agents and Techniques for Imaging Prostate Cancer
  • Humanized Radioiodinated Minibody For Imaging of Prostate Stem Cell Antigen-Expressing Tumors
  • Google Scholar

More in this TOC Section

  • How Sensitive Is the Upper Gastrointestinal Tract to 90Y Radioembolization? A Histologic and Dosimetric Analysis in a Porcine Model
  • 11C-Methionine PET of Myocardial Inflammation in a Rat Model of Experimental Autoimmune Myocarditis
  • Counting Rate Characteristics and Image Distortion in Preclinical PET Imaging During Radiopharmaceutical Therapy
Show more Basic Science Investigations

Similar Articles

SNMMI

© 2025 SNMMI

Powered by HighWire