


Abstract
The kinetics of 1-(2′-deoxy-2′-fluoro-β-d-arabinofuranosyl)thymine (FMAU) were studied using PET to determine the most appropriate and simplest approach to image acquisition and analysis. The concept of tumor retention ratio (TRR) is introduced and validated. Methods: Ten patients with brain (n = 4) or prostate (n = 6) tumors were imaged using 18F-FMAU PET (mean dose, 369 MBq). Sixty-minute dynamic images were obtained; this was followed by whole-body images. Mean and maximum standardized uptake values (SUVmean and SUVmax, respectively) of each tumor were determined as the mean over 3 planes of each time interval. For kinetic analyses, blood activity was measured in 18 samples over 60 min. Samples were analyzed by high-performance liquid chromatography at 3 selected times to determine tracer metabolites. FMAU kinetics were measured using a 3-compartment model yielding the flux (K1 × k3/(k2 + k3)) (K1, k2, and k3 are rate constants) and compared with TRR measurements. TRR was calculated as the tumor 18F-FMAU uptake area under the curve divided by the product of blood 18F-FMAU AUC and time. A similar analysis was performed using muscle to estimate 18F-FMAU delivery. Results: SUVmean measurements obtained from 5 to 11 min correlated with those obtained from 30 to 60 min (r2 = 0.92, P < 0.0001) and 50 to 60 min (r2 = 0.92, P < 0.0001) due to the rapid clearance of 18F-FMAU. Similar results were obtained using SUVmax measurements (r2 = 0.93, P < 0.0001; r2 = 0.88, P < 0.0001, respectively). The measurement of TRR using either blood or muscle activity over 11 min provided results comparable to those of 60-min dynamic imaging and a 3-compartment model. This analysis required only 5 blood samples drawn at 1, 2, 3, 5, and 11 min without metabolite correction to produce comparable results. Conclusion: Tissue retention ratio measurements obtained over 11 min can replace flux measurements in 18F-FMAU imaging. The SUVmean and the SUVmax in 5–11 min images correlated well with those of images obtained at 50–60 min. The quality of the images and tissue kinetics in 11 min of imaging makes it a desirable and shorter tumor imaging option.
PET is an analytic molecular imaging technique, which is frequently used in oncology to detect and stage viable and proliferating tumor (1–5). A whole-body static image is generally obtained for this purpose. Another important application of PET is in pharmacokinetics, which includes tracing labeled compounds in the body with quantitative measurements of the tracers in tissues. This application can be used for tissue specificity analysis and needs dynamic image data (6).
One of the newer compounds used for imaging tumor proliferation is 1-(2′-deoxy-2′-fluoro-β-d-arabinofuranosyl)thymine (FMAU). FMAU is an analog of thymidine with fluorine at the 2′ position of deoxyribose, which stabilizes the structure against biodegradation and also can be used for labeling with 18F. This compound was first introduced as an antiviral and antineoplastic agent, but because of neurotoxic side effects it was not approved for clinical use (7). Cell culture studies showed it is incorporated into DNA (8). Later, it was labeled with 11C to be used as a PET agent (9) and was tested in mice (10). A method for synthesis for 18F-FMAU was developed (11–13), and this agent was studied in dogs, rats, and human subjects (14–16). Compared with dogs, mice, and rats, the tracer is cleared much more rapidly in humans because of uptake in the liver (10,14–16).
The initial procedure for tumor imaging with 18F-FMAU PET takes >2 h starting with a 1-h dynamic image acquisition after intravenous injection of the labeled compound and a 1-h whole-body (static) image acquisition. To collect enough data for kinetic analyses, 18 venous blood samples are taken during dynamic imaging, and selected samples are analyzed with high-performance liquid chromatography (HPLC) to correct for metabolism of the compound in the blood (15,16).
Previous work demonstrated that blood activity in patients injected with 18F-FMAU drops quickly in about 11 min (15). This suggests a shorter imaging time may be possible due to the short time of tracer supply to the tumor. Shortening the 18F-FMAU PET time will decrease the cost of imaging, especially using PET/CT machines, and simplifies the clinical and analytic procedures. It may be possible to use the 11C-labeled compound instead of 18F along with a lower dose of injection and radiation exposure.
The rapid clearance time of 18F-FMAU prompted the scheme to define shortened imaging times and introduces the concept of tumor retention ratio (TRR). This study compares the images and tumor uptake values and kinetics at early, middle, and late time points to demonstrate and validate shorter tumor imaging with 18F-FMAU. This study also validates the TRR with 5 blood samples for kinetic measurements.
MATERIALS AND METHODS
Radiochemistry and Patient Imaging
18F-FMAU was synthesized with purity greater than 98% and specific activity greater than 111 GBq/mol as previously described (13) and intravenously injected into patients (range, 349–386 MBq; mean, 369 MBq) over 60 s as described earlier (15). Dynamic PET was performed for 60 min, with a series of timed images (4 × 20, 4 × 40, 4 × 60, 4 × 180, and 8 × 300 s) with a 15-cm field of view over the area of the tumors (skull or pelvic region) followed by a whole-body image using an Exact/HR tomograph (Siemens Medical Solutions USA, Inc.).
Regions of interest (ROIs) were defined with a semiautomated method described before. Briefly, they were defined on the plane with the most active area of the tumor and the next adjacent planes, using isocontours with activity half way between the background and highest pixels to delineate the edges on the images of 5–11, 30–60, and 50–60 min. The ROIs were drawn independently on each of these sets of images. The 18F-FMAU uptake in the ROI was quantified both as μCi/mL and the mean and maximum standardized uptake value (SUVmean and SUVmax), defined as the mean and maximum activity per gram in the tissue divided by the total injected activity per gram of the whole-body weight.
Ten patients with brain (n = 4) or prostate (n = 6) tumors participated in the study before treatment. The basic clinical results of imaging with 18F-FMAU had been reported previously for 7 of these patients and are included here because we had full dynamic and blood data available (15). Three additional patients with prostate cancer were also included in our present analysis. The human subject protocol for this study was approved by the Human Investigation Committee of Wayne State University and the Radioactive Drug Research Committee of Michigan. All patients signed a written informed consent before each study.
Blood Samples
For each subject, eighteen 2-mL blood samples were drawn into heparinized syringes from an intravenous catheter on the opposite side of tracer injection. Samples were drawn after injection at various intervals starting at 15 s up to 60 min (15, 30, 45, 60, 75, 90, 105 s, and 2, 3, 4, 5, 11, 15, 20, 30, 40, 50, 60 min). Whole blood was measured for the total activity by a sodium iodide (NaI) well counter (Cobra II; Packard), quantified as μCi/mL, and then decay corrected for use in the kinetic program.
For metabolite analysis, blood samples at 5, 11, and 60 min from each subject were analyzed by HPLC using a Hypersil ODS (C18) 10-μm column (Thermo Hypersil-Keystone), with 6% acetonitrile and 94% 10 mM sodium acetate as the mobile phase with a flow rate of 1 mL/min.
Kinetic Analysis
18F-FMAU time–activity curves were fitted using a 3-compartment model, yielding the rate constants K1, k2, and k3. The parameter K1 (mL/g/min) represents the unidirectional transport of FMAU from blood into tissue, parameter k2 (min−1) represents the reverse transport, and parameter k3 (min−1) characterizes metabolic conversion of FMAU to FMAU phosphate. Starting values for the fit were K1 = 0.2 mL/g/min, k2 = 0.1 min−1, and k3 = 0.1 min−1. Because dephosphorylation of FMAU phosphate back to FMAU is negligible in the initial 60 min after injection, the rate constant k4 (min−1) was explicitly set to zero. To decrease the number of parameters and improve identification of the parameter vector, the blood volume parameter was preset to 5%. Finally, the flux of FMAU into tissue was calculated as K1 × k3/(k2 + k3), and the correlation between flux and K1 was assessed.
TRR
TRR was defined as the tumor 18F-FMAU activity area under the curve (AUC), divided by the product of 18F-FMAU blood activity AUC and time. Initially, blood activity was corrected for the level of metabolites determined from HPLC analysis. The total blood activity (without metabolite correction) was used for comparison. For calculating AUC, GraphPad Prism version 4b (GraphPad Software Inc.) was used, which calculates AUC by the trapezoid method. In the TRR calculation with muscle, rather than blood AUC, muscle AUC over the same period of time as tumor AUC was used. Because of the noise in the images, the first 5 min were excluded from tumor and muscle AUC.
Metabolite Analysis and Limited Sampling
HPLC was performed on the 5-, 11-, and 60-min blood samples. Samples taken at 60 min had very low activity and <0.1% was detectable as 18F-FMAU. Time versus the natural logarithm of the percentage of activity of intact 18F-FMAU at time 0 (set at 100%), 5, 11, and 60 min was plotted. Because of the negligible activity at 60 min, the natural logarithm was set at −6, the lower limit of the program. The percentage of 18F-FMAU at the other imaging time points was interpolated between these points. To determine whether the number of samples needed for kinetic measurements could be reduced and whether HPLC analysis is needed, the transfer rate results in the simplified sampling were compared with full blood sampling with metabolite correction using HPLC at 5, 11, and 60 min. In the simplified analysis, the whole-blood activity in 5 blood samples, collected at 1, 2, 3, 5, and 11 min, without metabolite correction was used.
Statistical Methods
The statistical relationship of one PET parameter to another was explored with linear regression models, fit by ordinary least-squares estimation of the slope and intercept parameters. The goodness of fit of these models was assessed via the r2 value and by graphic examination of model residuals. Regression models were fit and assessed with the GraphPad Prism version 4b software.
RESULTS
SUV Measurements
Tumor uptake was relatively stable after 11 min and up to 60 min, especially in brain tumors (Table 1). The SUVmean at 5–11 min correlated with the measurements at 30–60 min (r2 = 0.92, slope = 0.82, P < 0.0001). The SUVmean at 5–11 min also correlated with the measurements at 50–60 min (r2 = 0.92, slope 0.78, P < 0.0001) (Table 1; Fig. 1A).

Scatter plots of tumor SUV at 50–60 min images compared with 5–11 min images. (A) SUVmean. (B) SUVmax. Solid line represents linear regression model. Dashed lines represent 90% confidence limits for predicted mean value of SUV from 50–60 min images for a given value of SUV from 5–11 min images.
Tumor Activity: Measured by SUVmean and SUVmax at Different Time Intervals
SUVmax measurements at 5–11 min showed correlation with measurements at 30–60 min (r2 = 0.93, slope = 0.97, P < 0.0001) and 50–60 min (r2 = 0.88, slope = 0.92, P < 0.0001) (Fig. 1B).
The images of 5–11 min (Fig. 2A) and 50–60 min (Fig. 2B) in prostate and brain tumors were visually indistinguishable. The quality of tumor images and background also appeared comparable. The main difference in the images was the volume of the bladder, which was smaller at earlier images in the prostate tumor patients.
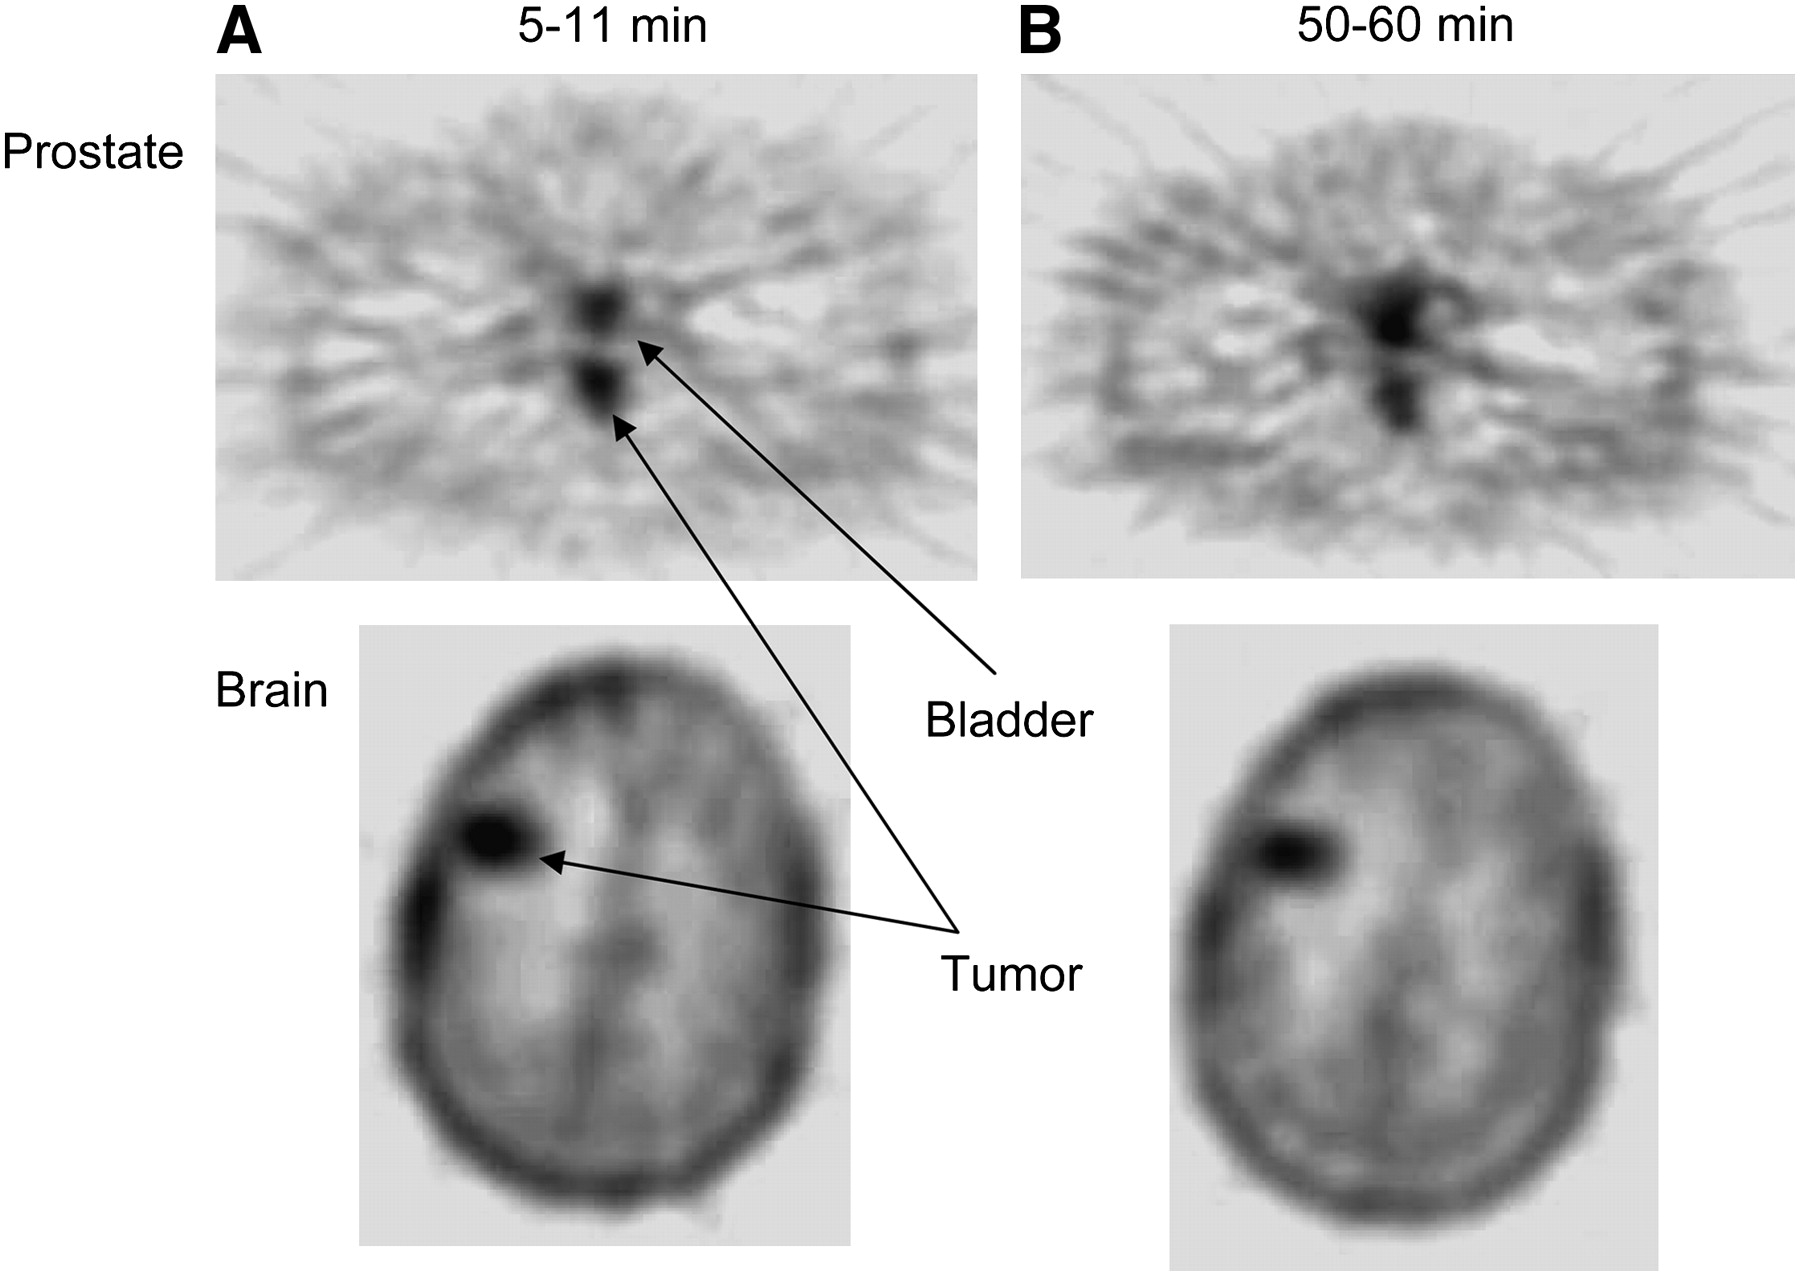
18F-FMAU images of prostate and brain tumors. (A) 5–11 min. (B) 50–60 min.
Blood Metabolite Analysis
At 5 min after injection, total blood activity was, on average, 24.6% of the peak level, with an average of 95.2% present as intact 18F-FMAU by HPLC analysis.
At 11 min after injection, total blood activity was, on average, 8.3% of the peak level, with an average 78.6% as the parent compound (18F-FMAU) on HPLC analysis (Fig. 3) .
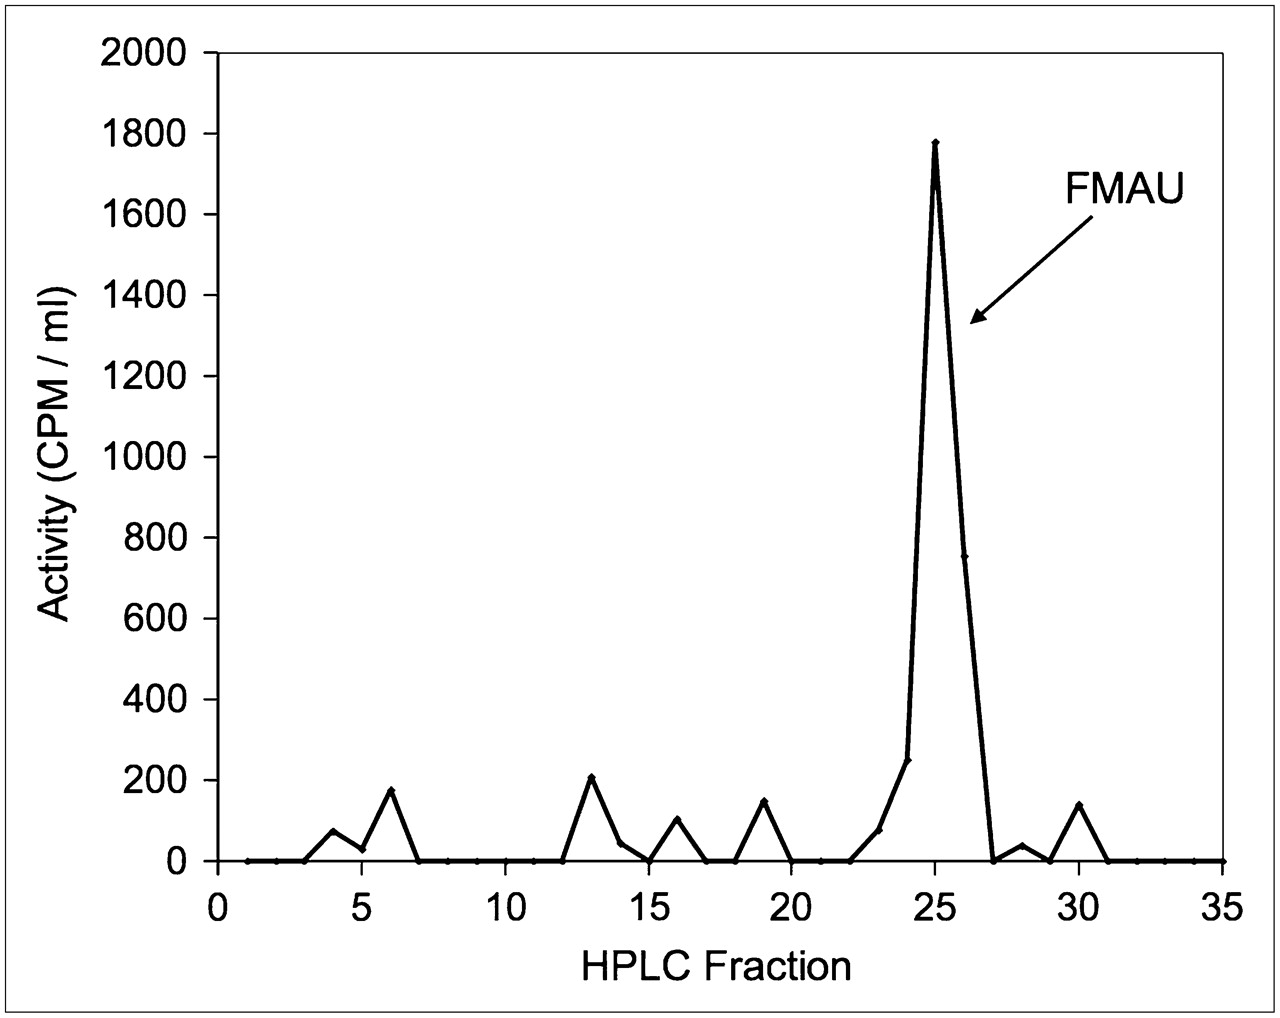
Plasma analysis HPLC chromatogram depicts activity of each 30-s fraction. Sample is collected at 11 min after injection.
Blood AUC with and without metabolite correction had a significant correlation (r2 = 0.94, P < 0.0001). Blood AUC over 11 min correlated well with AUC over 60 min (r2 = 0.99, slope = 0.91, P < 0.0001).
Kinetic and TRR
There was a strong correlation between the flux calculated using 60 min of dynamic imaging with all 18 blood samples and corrected for metabolites and the simple TRR measured over 60 min (r2 = 0.99, P < 0.0001). The correlation between 60-min flux and TRR in 11 min had r2 = 0.94 and P < 0.0001.
Correlation between flux rate in 60 min and TRR in 11 min, using total activity of 5 blood samples drawn at 1, 2, 3, 5 and 11 min, without HPLC correction, had r2 = 0.91 and P < 0.0001, demonstrating that extended imaging added little information to kinetic assessment (Table 2; Fig. 4A). Muscle activity, when visible in body scans (n = 6), was also used as a method to estimate FMAU delivery to the tissue in lieu of measurement of the blood level of 18F-FMAU. A good correlation was demonstrated between flux rate over 60 min and TRR in 11 min using the muscle AUC (r2 = 0.89, P = 0.004) (Fig. 4B). There was also a good correlation between TRR using either blood or muscle (r2 = 0.92, P = 0.003). Average muscle uptake was stable from 5 to 60 min and correlated with the AUC of the blood (r2 = 0.92, P = 0.002).
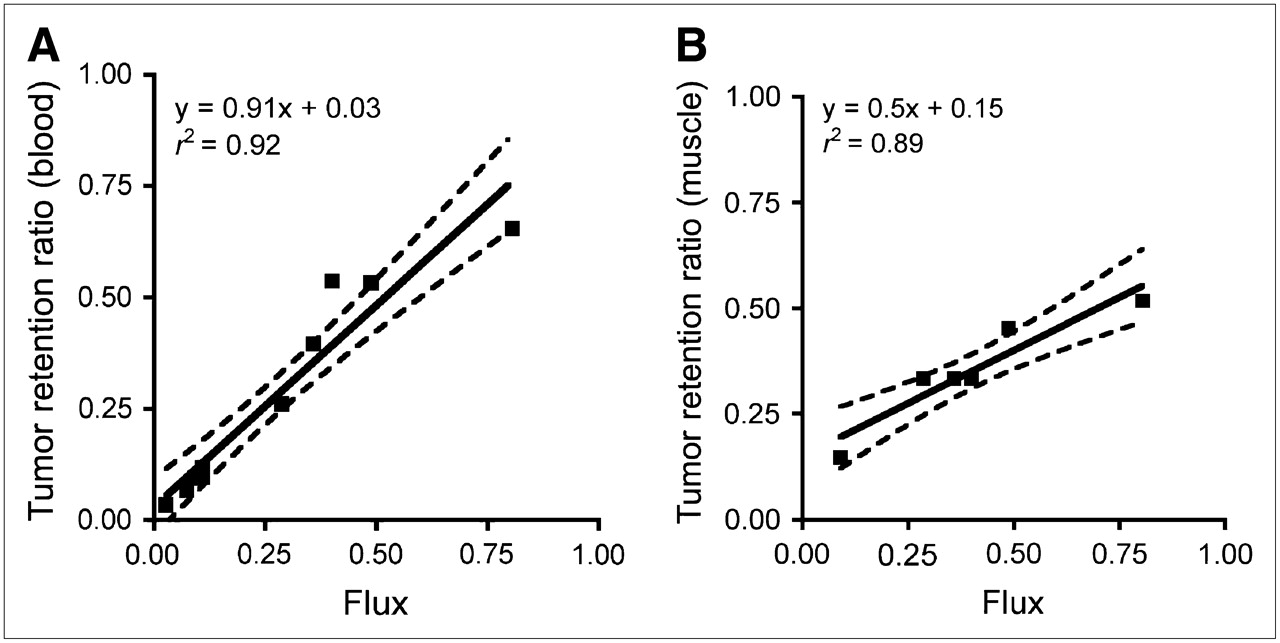
Scatter plots comparing TRR and 3-compartment flux. (A) TRR from 11 min images, simplified method using blood vs. flux. (B) TRR from 11 min images using muscle vs. flux. Solid line represents linear regression model. Dashed lines represent 90% confidence limits for predicted mean TRR for a given level of flux.
Flux and TRRs
The flux rate over 60 min and tumor SUVmean at 5–11 min were also correlated (r2 = 0.75, P = 0.001).
DISCUSSION
With the new generation of PET/CT devices, it is possible to take advantage and combine both metabolic and anatomic images of organs and tissues. At present, the only agent routinely used for imaging cancer is 18F-FDG. To take full advantage of PET, new tracers must be developed to measure other and specific metabolic pathways. Deoxynucleosides and their analogs have found increasing applications in treatment of viral diseases and cancer as antimetabolites as well as in PET studies. Many nucleoside analogs require phosphorylation to get trapped in the cells or become activated and interfere with cellular or viral metabolism. Some of them, including 3′-deoxy-3′-fluorothymidine (FLT) and FMAU, have been used for the noninvasive PET studies of tumor imaging (10,15–18).
In vitro studies, as well as animal studies, have shown that FMAU can incorporate into the DNA and suggest that this compound may have the potential for DNA synthesis imaging. It is also shown in human subjects that this compound is quickly cleared from the blood, suggesting that the imaging time can be similarly reduced, thus reducing imaging costs. The original imaging approach used involved 60 min of dynamic imaging, which was followed by another 60 min to obtain a whole-body image. This study examines the use of much shorter imaging times, in which one could potentially obtain dynamic and whole-body images in about 40 min using PET/CT.
In patients injected with 18F-FMAU, blood activity drops very quickly in the first 11 min after injection. Although early tumor uptake suggests that intensity of the tumor should be good in early images, comparing the quality of the images revealed that images taken before 5 min after injection have relatively high background activity and low contrast. In addition, the tumor time–activity curves were relatively unstable before 5 min after injection. Thus, the beginning of these imaging comparisons was set at 5 min and the image of 5–11 min was found to be comparable to images obtained from 50–60 min, greatly shortening the imaging period.
SUVs and tumor uptake ratios were used to semiquantitatively assess 18F-FMAU tumor uptake. The mean tumor uptake, measured by SUVmean, as well as SUVmax, gave comparable results whether obtained at 5–11 min, 30–60 min, or 5–60 min. It should be noted that this study also analyzed SUVmean and SUVmax measurements using images obtained from 8 to 14 min and did not find any improvement by extending the imaging time beyond 11 min (data not shown). The comparable quality of the images and correlation between tumor uptake measurements in early and later images raised the question of whether it is possible to use limited dynamic imaging for kinetic analysis.
Furthermore, as thymidine analogs can be trapped in cells after phosphorylation, a 3-compartment model was used to measure FMAU flux rate. This model has already been used as a kinetic model for FDG and FLT (19–22). FMAU flux rate was assessed using 60 min of kinetic data. These results showed a close correlation between flux rates and TRRs over 60 min. As 18F-FMAU blood activity rapidly drops after injection and is close to 0 after about 11 min, the AUC of blood does not change appreciably after this time. Because of the low metabolism of 18F-FMAU in blood during the initial 11 min, most of the blood activity during that time interval is due to unmetabolized 18F-FMAU (95.2% at 5 min and 78.6% at 11 min). It is noteworthy that activity of blood at 11 min is about 8.3% of the peak activity, with metabolites being 21.6% of that. This means that all metabolites make only 1.7% of the peak activity, and this activity is divided between many small peaks (Fig. 3). This explains why metabolite correction with HPLC analysis does not change kinetic measurements and allows application of a simplified model without metabolite correction. These results indicate that this simplified model (not requiring HPLC analysis) performs well, showing a high correlation (r2 = 0.91) with the full 60-min flux calculation. One clear limitation of this comparison is that the flux (19) calculations are compromised by the rapid clearance of the tracer. 18F-FMAU is rapidly cleared from the blood; therefore, for part of this study, blood activity was excluded from the calculations by comparing tumor SUVmean and flux rate. As expected, there is less correlation between SUVmean and flux, compared with the correlation between flux and TRR. This correlation shows that SUVmean may be used as a suggestive value for a rough estimate of flux. To make a better estimate of the flux by using tumor uptake values, correction by the muscle uptake, which is exposed to the similar variable plasma concentrations, seems to be a reasonable option. TRR using muscle AUC instead of blood AUC had a better correlation with flux than tumor SUVmean alone, suggesting that muscle retention can be used as a correction factor to measure flux by tumor uptake values. This helps eliminate the need for blood samples in flux measurements.
Although, in general, kinetic modeling of time–activity curves is considered the gold standard for quantification of tracer uptake in tissue, the special characteristics of the 18F-FMAU tracer might make this approach suboptimal. Because of the rapid blood clearance of 18F-FMAU, after the initial 10 min the tissue activity remains virtually constant, resulting in relatively poor identification of the parameter vector. In contrast, these same characteristics make this tracer well suited for a simplified, more robust approach, such as the tumor uptake ratio. Whereas the flux macroparameter is known to be a robust estimate of unidirectional tracer uptake, individual rate constants were found to be less stable. Despite the fact that the scale parameter for FMAU is expected to highly correlate with flux, the correlation between flux and K1 was found to be relatively low (r2 = 0.42; P = 0.04). Thus, it appears that a simplified approach requiring only a fraction of the data needed for kinetic modeling might be a better choice to characterize FMAU kinetic in tumors.
One limitation here is that only brain and prostate tumor patients are included in this study. To generalize this technique, studies are needed with a wider range of tumors and with a larger number of patients in each group.
For the purpose of imaging, these data suggest that images taken 11 min versus up to 1 h after injection can have reasonably comparable quality and can be used interchangeably. Also, for shorter imaging studies, it may allow one to more easily use 11C-FMAU instead of 18F, which has been used in longer imaging techniques.
CONCLUSION
The quality of 5–11 min images is comparable to that of 50–60 min images. SUVmean and SUVmax from 5–11 min images correlate well with those from 50–60 min images and also with those from 30–60 min images due to the rapid clearance of 18F-FMAU. Considering these data, it is possible to obtain reasonable images any time after 5 min following injection. For kinetic measurements, flux can be replaced by the tissue retention ratio. Because of the low metabolism of 18F-FMAU in the first 11 min, using whole-blood activity in 5 blood samples in the first 11 min is enough for plasma–tissue flux measurements in brain and prostate tumors in 18F-FMAU PET. Muscle can replace blood to calculate TRR. Finally, 11-min 18F-FMAU tumor imaging is a reasonably simple imaging option with regard to the quality of the images and tissue kinetic data.
Acknowledgments
This work was partially supported by funding from National Cancer Institute grant CA 83131 and the U.S. Department of Defense award W81XWH-04-1-0140.
Footnotes
-
COPYRIGHT © 2007 by the Society of Nuclear Medicine, Inc.
References
- Received for publication April 13, 2007.
- Accepted for publication June 8, 2007.


