


Article Figures & Data
Figures
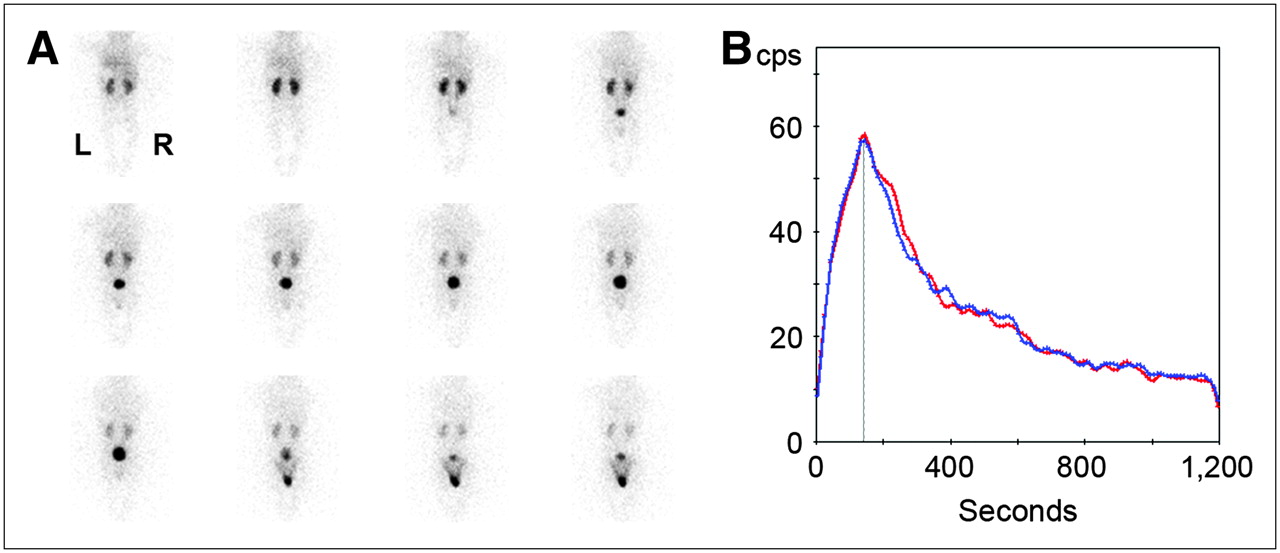
- FIGURE 1.
Diuretic renography (F+0) in 6-mo-old boy who had febrile UTI by age of 2 mo. Renal sonography and VCUG had normal findings. (A) One-minute posterior views demonstrate normal tracer uptake by both kidneys and rapid washout, with bladder activity visible from third minute after injection and spontaneous micturition occurring at minute 10. (B) Left (red) and right (blue) renal time–activity curves show symmetric relative function (left, 50%; right, 50%) and normal time to peak (<180 s).
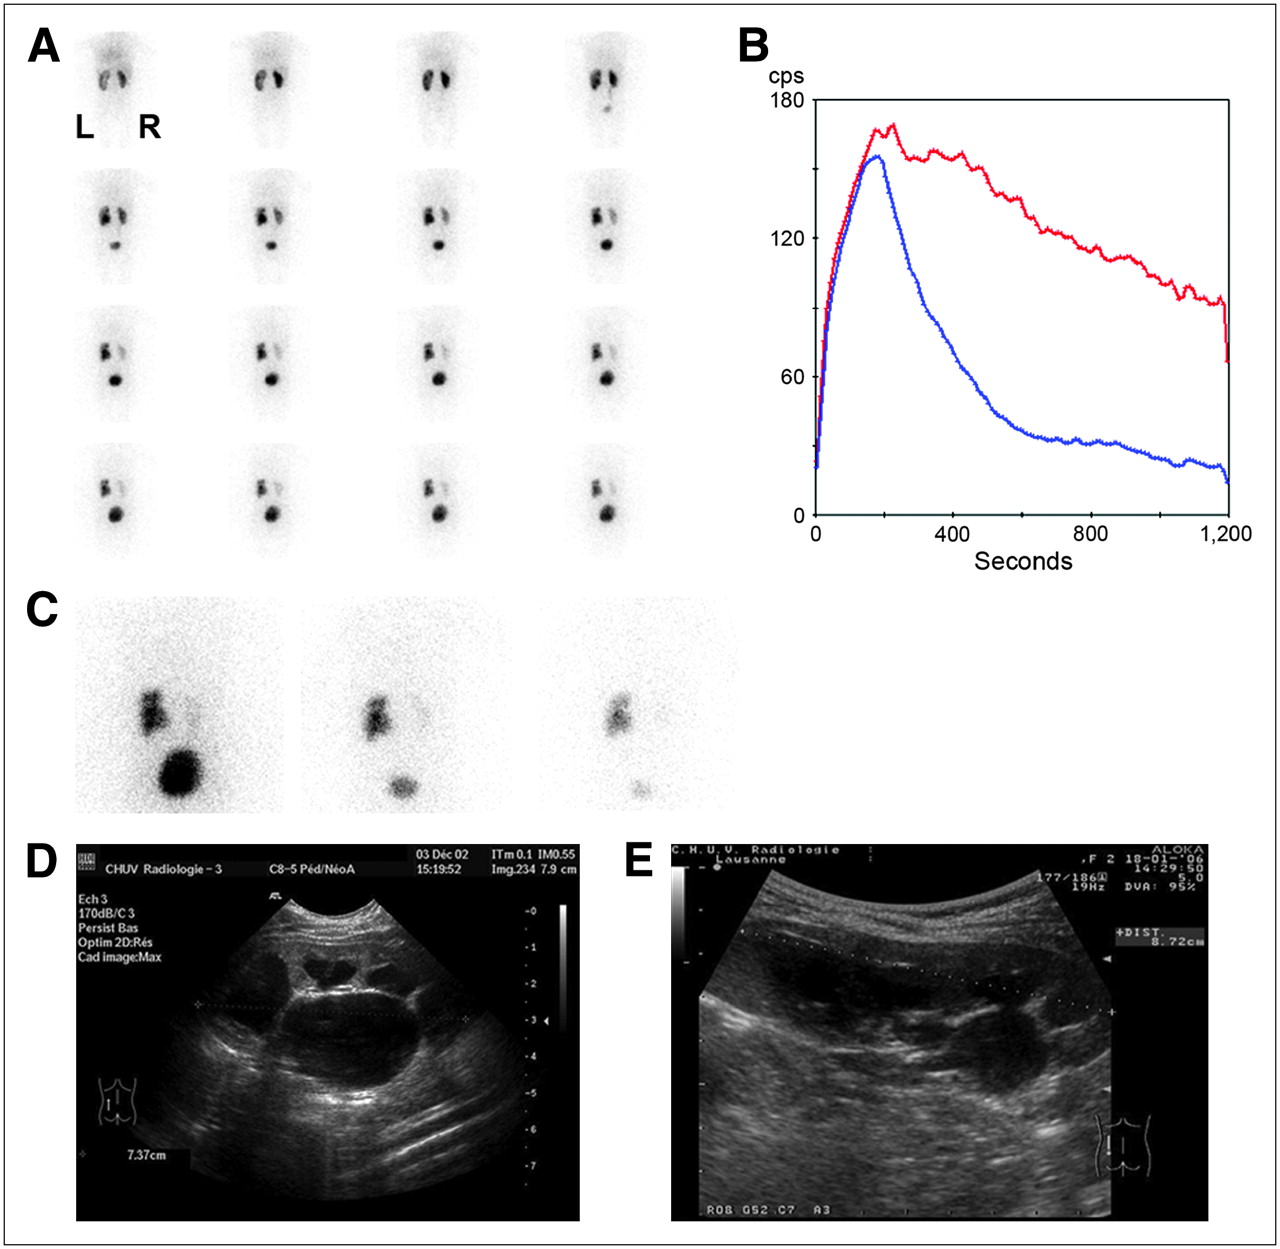
- FIGURE 2.
Bilateral duplex kidney diagnosed in 9-y-old boy after febrile UTI. (A) VCUG shows bilateral pyeloureteral reflux with opacification of incomplete systems, suggesting duplication. (B) Coronal T2-weighted MRI scan confirms presence of duplex kidneys bilaterally. Lower pyelocaliceal systems are dilated (arrows) even when upper ones remain thin (arrowheads). (C) Sagittal sonographic view of right upper quadrant shows enlarged kidney with broad layer of parenchyma on upper pole (arrowhead) and atrophic lower pole (arrow). (D) One-minute parenchymal view shows decreased tracer uptake by left lower system and parenchymal defects at both poles of right kidney. (E) Images obtained 1, 4, 9, and 15 min (from left to right) after injection show delayed urinary flow in lower moiety of left kidney due to loss of parenchymal function. (F) Renograms of left and right kidneys show symmetric function (left, 49%; right, 51%) and no significant impairment of urinary flow under furosemide. (G) Indirect radionuclide cystography demonstrate VUR in both left and right lower systems.
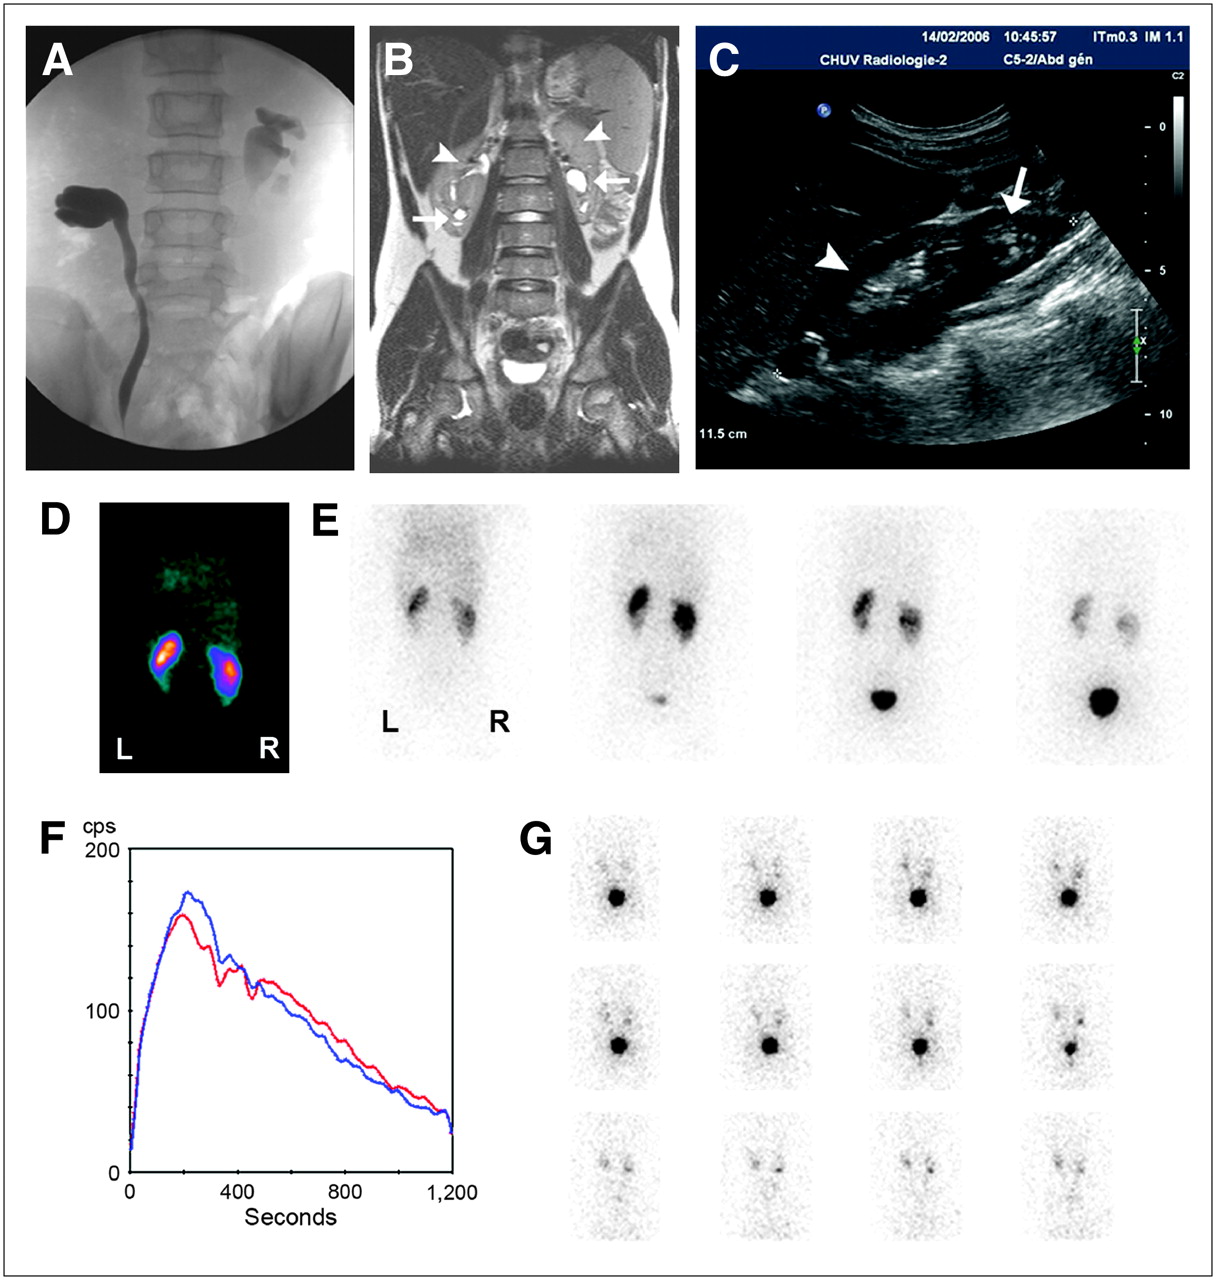
- FIGURE 3.
Diuretic renography (F+0) obtained during follow-up of 4-y-old girl treated conservatively for left pelviureteric junction stenosis detected prenatally. (A) One-minute posterior views show dilated left kidney with preserved parenchymal function despite impaired urinary drainage above pelviureteric junction. Right kidney is normal. (B) Left (red) and right (blue) renograms confirm symmetric (left, 51%; right, 49%) and normal tracer extraction by both kidneys and abnormal urinary flow out of left kidney. (C) Images obtained 20 min after injection (left), after miction (middle), and 50 min after injection (right) show residual activity within left renal pelvis after miction and 50 min after injection. (D) Initial sonographic sagittal view of left kidney shows enlargement of pyelocaliceal system. (E) Follow-up sonogram obtained at same time as diuretic renography shows persistent enlargement, with satisfactory growth of left kidney.
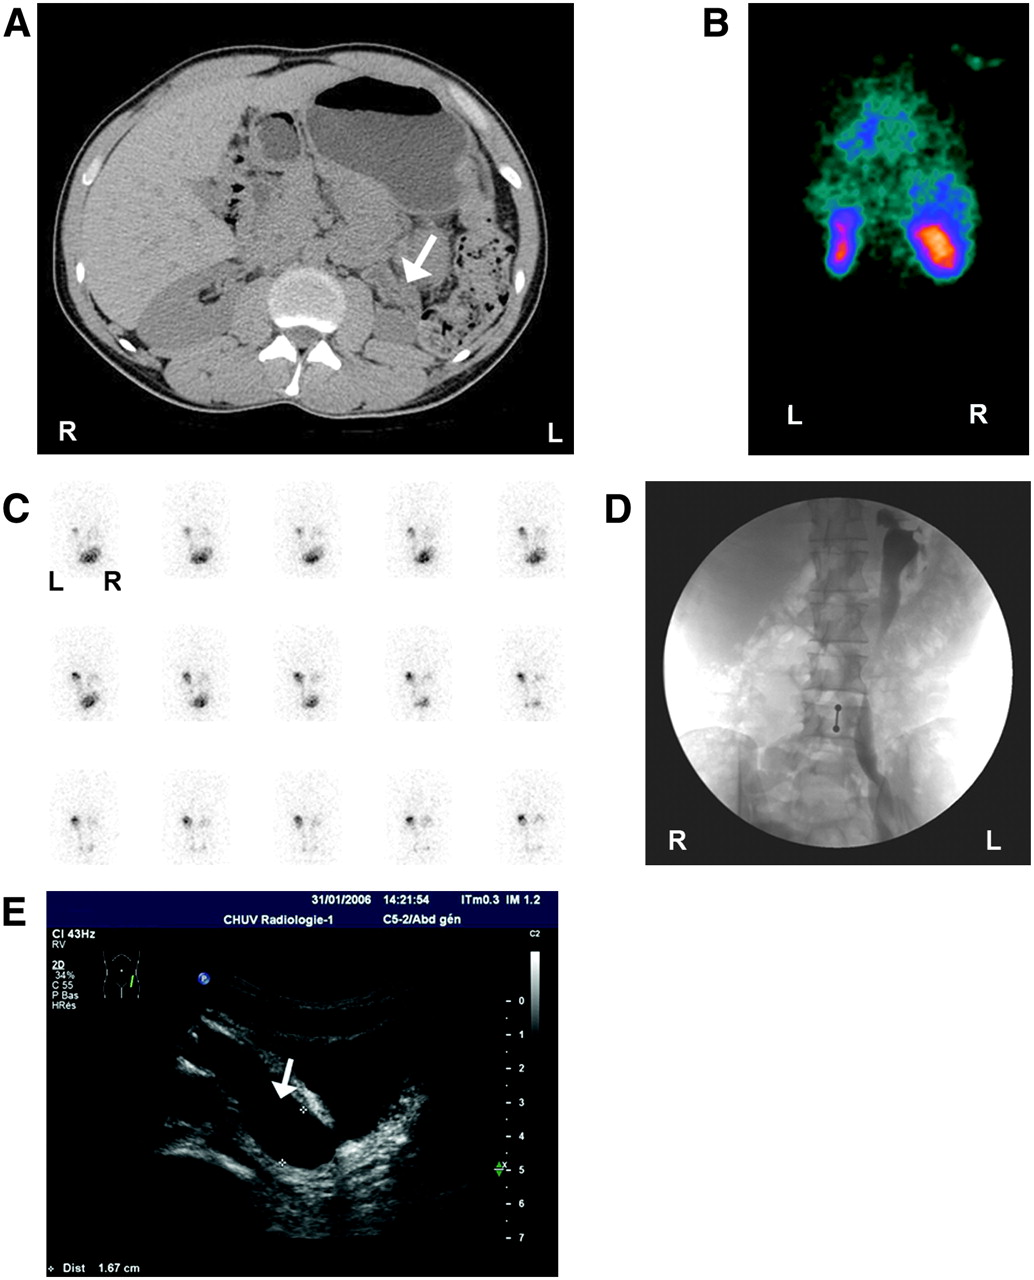
- FIGURE 4.
25-y-old patient with chronic renal insufficiency due to reflux nephropathy. (A) CT scan shows atrophic left kidney (arrow) with dilated pelvis. (B) First-minute parenchymal image shows small scarred left kidney and also upper and lower parenchymal defects of right kidney (differential renal function: left, 31%; right, 69%). (C) Indirect radionuclide cystography shows massive left VUR. (D) VCUG shows massive left pyeloureteral reflux. (E) Sagittal sonogram shows dilatation of distal left ureter (arrow).
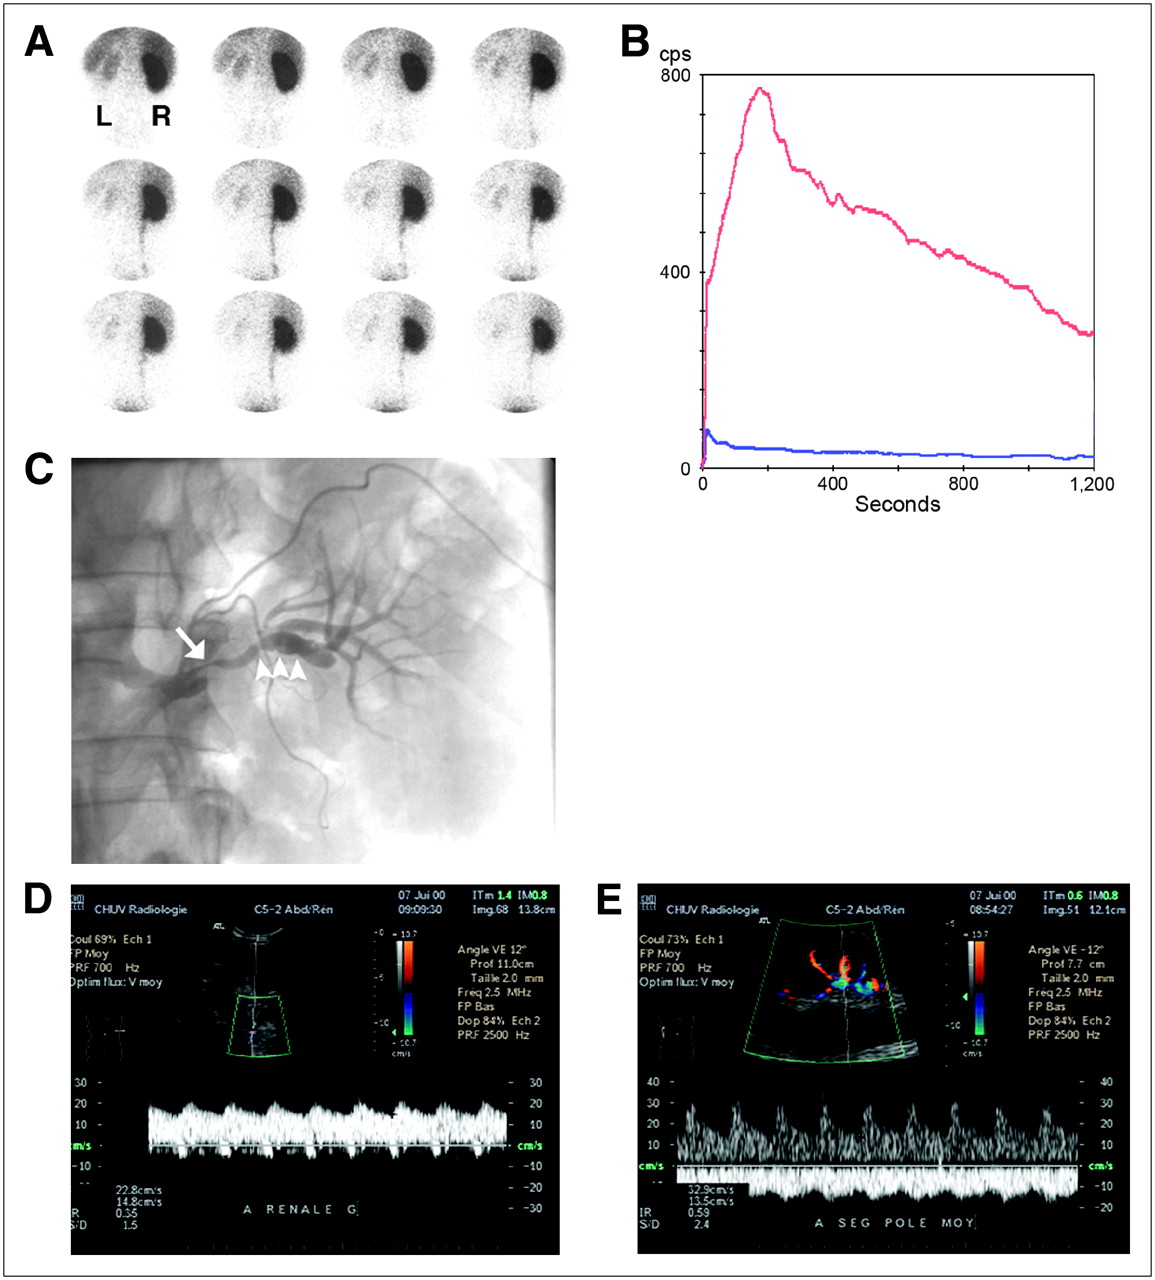
- FIGURE 5.
Stenosis related to FMD in 35-y-old man. (A) ACE inhibitor renography shows 1-min images of radiotracer uptake (99mTc-MAG3). Right kidney is performing 95% of the renal function, which was decreased (tubular extraction rate, 160 mL/min/1.73 m2). (B) Time–activity curves of left (blue) and right (red) kidneys show almost no participation of the left kidney to renal function. (C) Angiogram shows irregular stenosis (arrow) and beading (arrowheads). (D) Color Duplex sonography of peripheral artery of left kidney demonstrates parvus–tardus pattern with collapsed resistance index (0.35). (E) In contrast, right kidney shows normal Doppler spectrum.
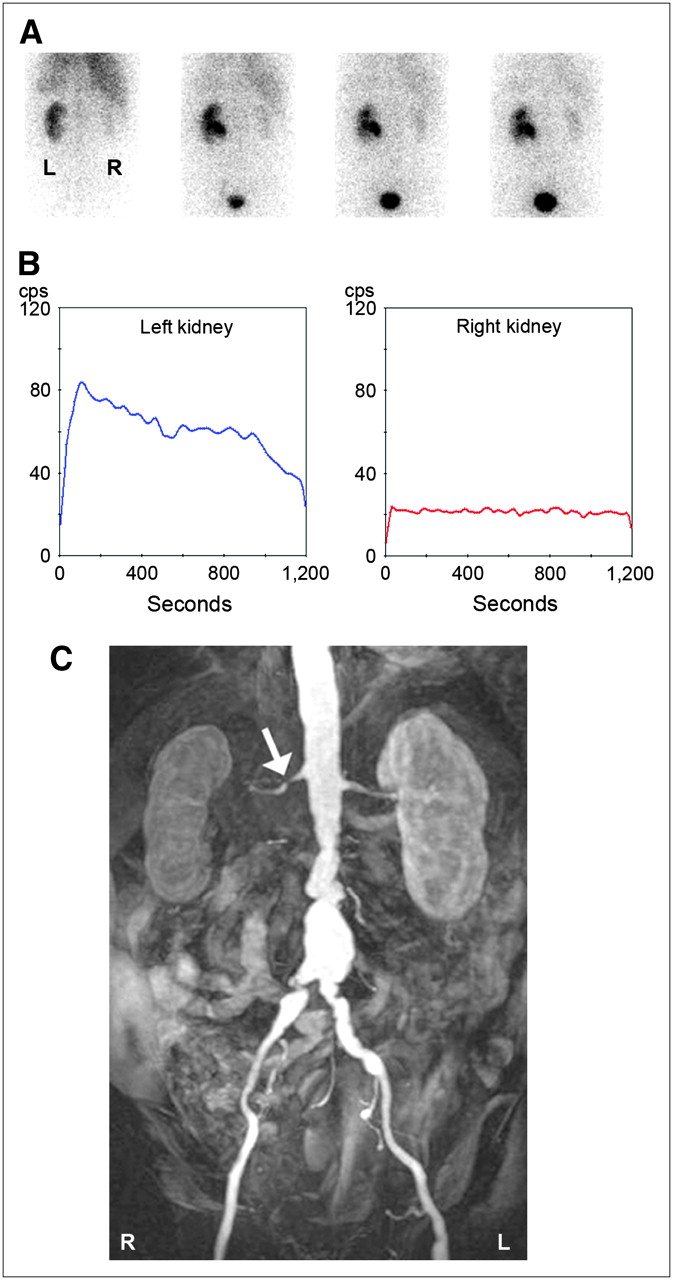
- FIGURE 6.
RAS in 63-y-old man with chronic renal insufficiency (creatinine clearance, 40 mL/min) and subrenal aortic inflammatory aneurysm with right renal hydronephrosis due to ureter compression. (A) On ACE inhibitor renography with 123I-OIH, images obtained at 1, 6, 11, and 16 min (from left to right) after injection show poor function of right kidney, assuming only 10% of total renal function. (B) Time–activity renal curves were identical to baseline (not shown). (C) Coronal 3-dimensional MRA image demonstrates short stenosis on right renal artery (arrow).
- FIGURE 7.
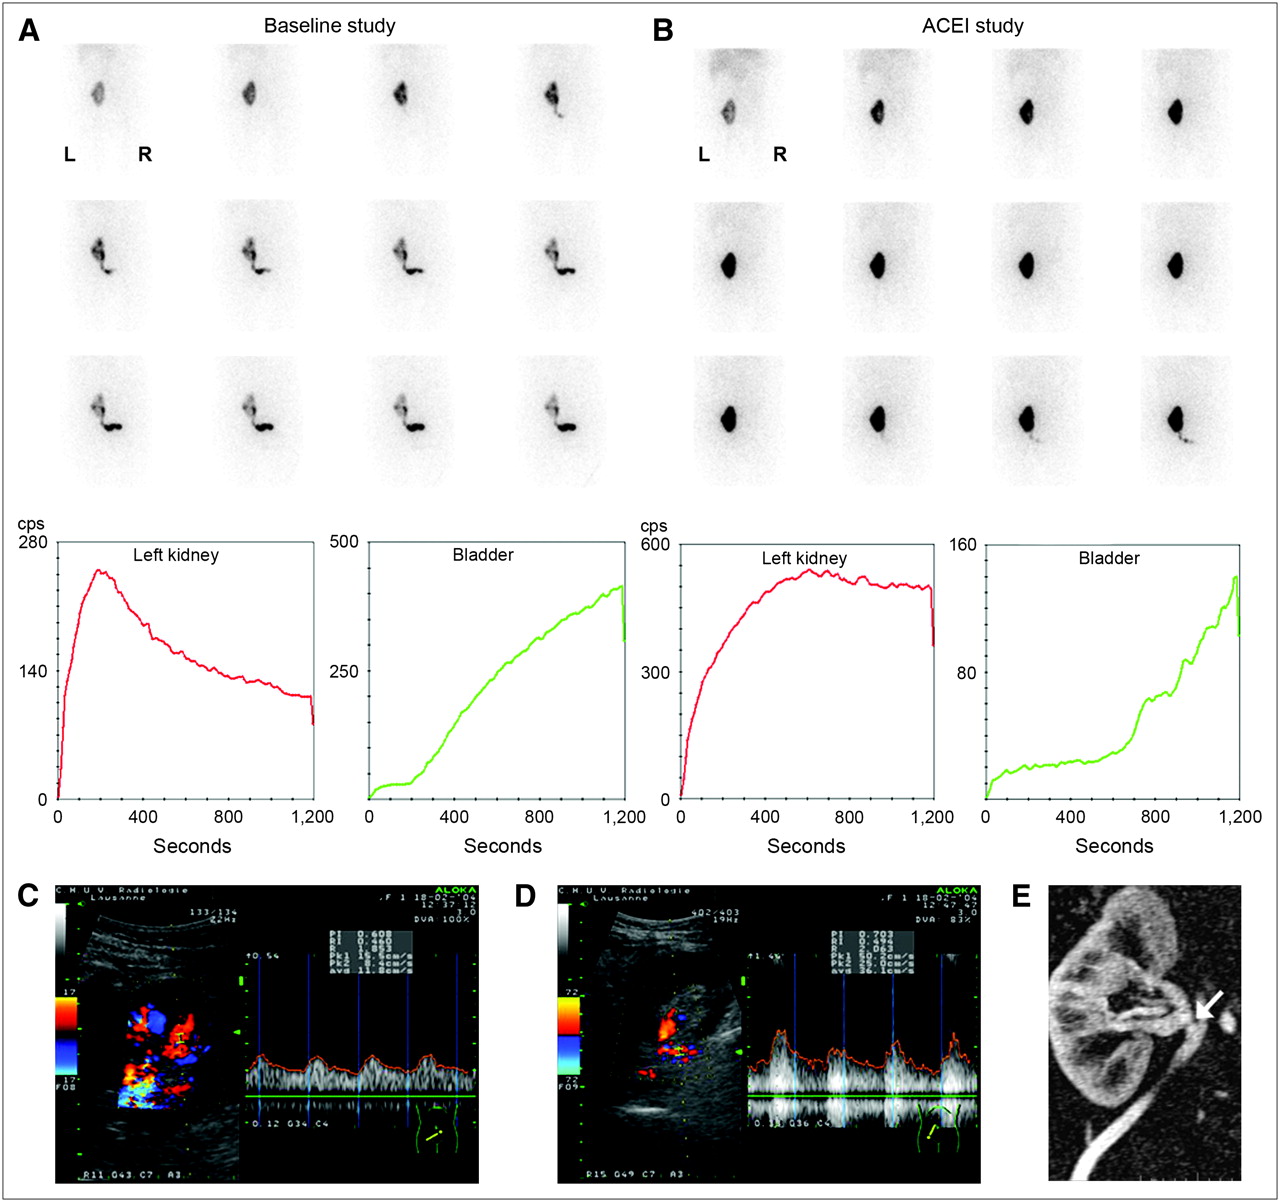
RAS due to atherosclerosis in 75-y-old woman. Baseline renography with 123I-OIH (A) and ACE inhibitor renography (B) show delayed renal parenchymal uptake in right kidney, as compared with baseline (images taken at 1, 6, 11, and 16 min [from left to right] after injection). (C) Angiogram shows narrow stenosis at ostium of right renal artery (arrow). (D) Angiogram performed after angioplasty demonstrates successful dilatation of vessel (arrow). (E) Coronal 3-dimensional CT shows regular-sized reshaped vessel, with presence of stent (arrow). ACEI = ACE inhibitor.
- FIGURE 8.
Graft dysfunction 1 d after transplantation in 41-y-old woman. Baseline renography (A) and ACE inhibitor renography (B) show prolonged tracer transit in renal parenchyma on images and on renal and bladder curves, as compared with baseline. (C) Color duplex sonographic assessment of intrarenal vessels shows parvus–tardus pattern. (D) Color duplex sonographic exploration of renal artery demonstrates disturbance of flow. (E) Coronal 3-dimensional MRA image shows short narrowing of renal artery (arrow) at site of anastomosis. Laparotomy revealed kinking of renal artery graft. ACEI = ACE inhibitor.
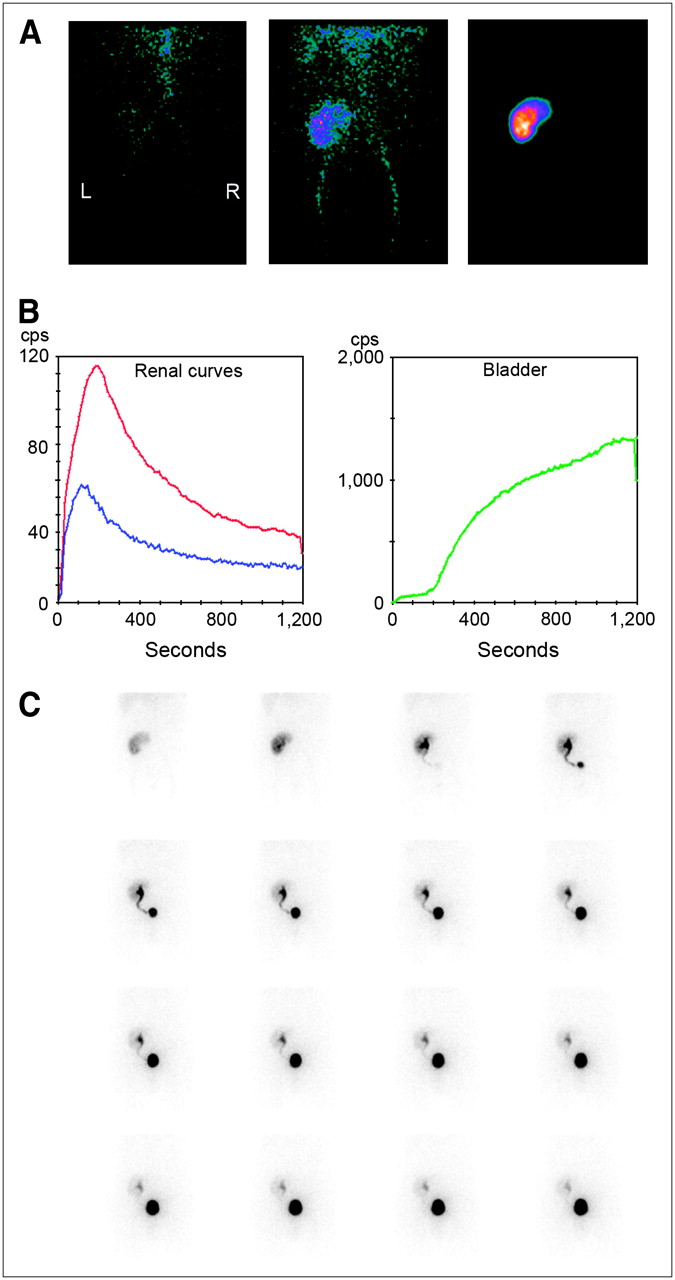
- FIGURE 9.
Normal camera-based renography findings 5 d after transplantation of related-donor kidney: the first two 10-s perfusion images (left and middle) and the 1-min parenchymal image (right; upper pole irregularity is due to graft position) (A); whole kidney (red), cortical kidney (blue), and bladder curves (B); and sequential 1-min images (C). Somewhat prolonged visualization of ureter is due to postoperative hypotony, frequently observed during first days after transplantation.
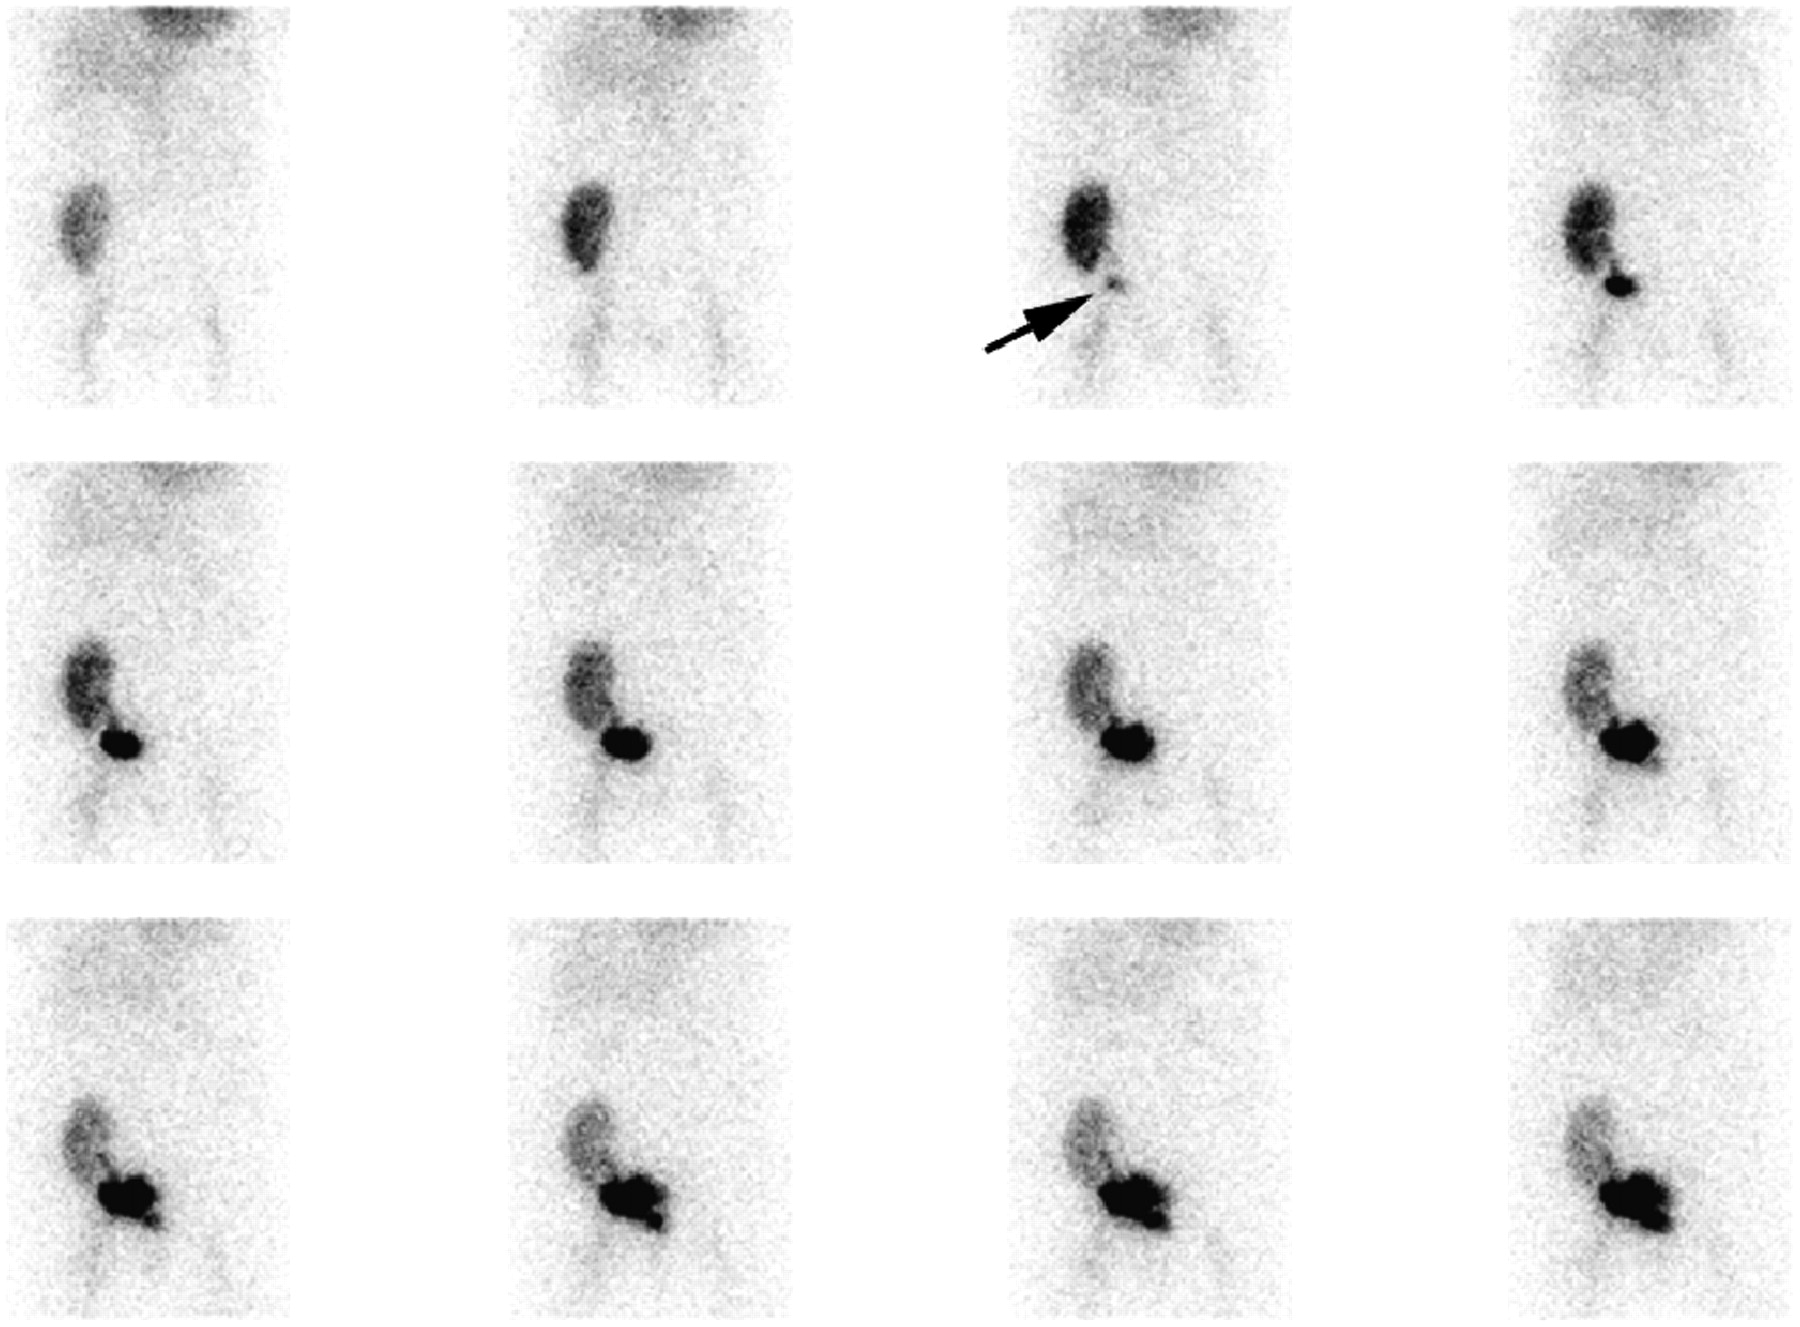
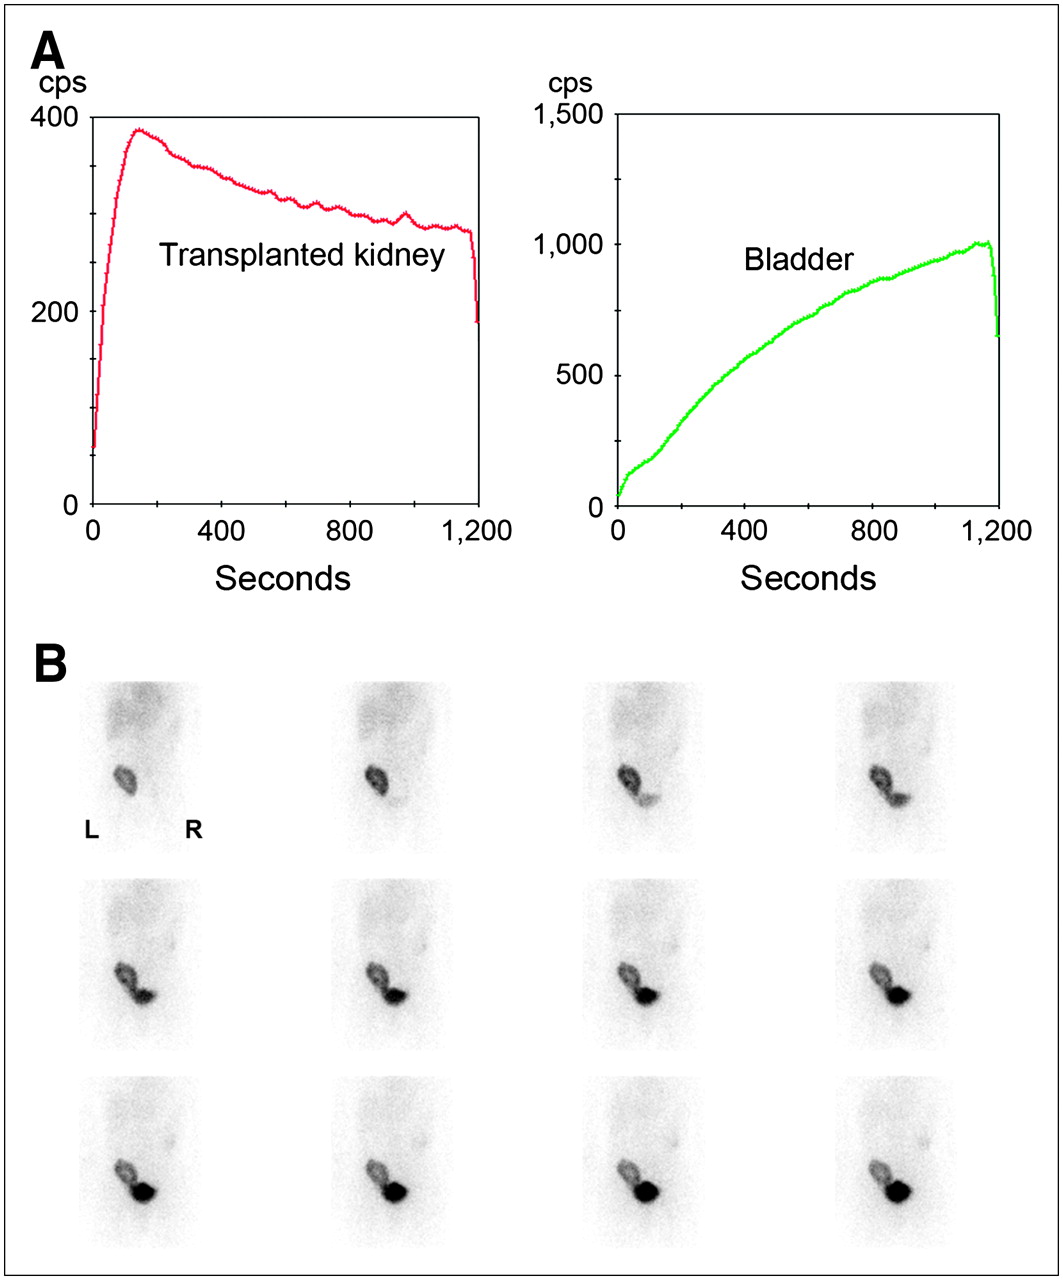
- FIGURE 10.
One-minute images after injection of 99mTc-MAG3. Images were obtained 6 d after transplantation because of sudden anuria and abdominal pain. Starting with third image, irregularly shaped urinary collection suggestive of urinary leak appears (arrow). Reintervention revealed necrosis of distal ureter and confirmed urinary leak. After resection and reanastomosis of ureter, course was uneventful.
- FIGURE 11.
Patient with decreased graft function 5 mo after transplantation of living-donor kidney. Creatinine level was 219 μmol/L. (A) Renogram shows an 123I-OIH accumulation within normal limits, a normal peak, but delayed elimination. Normal uptake and peak are unlikely to be seen in acute rejection. (B) Corresponding 1-min images reveal tracer retention in parenchyma without outflow impairment, suggesting potential calcineurin inhibitor toxicity; normal Doppler sonography findings made RAS unlikely. Biopsy showed thrombotic microangiopathy. After change of immunosuppressive therapy from tacrolimus to sirolimus, creatinine returned to baseline level (140 μmol/L).


Tables
Source Limitation/pitfall Patient Hydration status Bladder emptying Renal function insufficiency Acquisition Patient position, movements Radiopharmaceutical Timing of furosemide administration Change of position, postvoiding/late images Processing Regions of interest, background subtraction Quantitative parameters used to assess urinary drainage Renal function measurement Reporting Parenchymal aspect and renal function Response to furosemide, change of position and voiding Level of urinary drainage impairment Grade* Central renal complex (pelvis) Renal parenchymal thickness 0 Intact Normal I Mild splitting = dilatation Normal II Moderate splitting, but complex, confined to renal border Normal III Marked splitting, pelvis dilated outside renal border, and calices dilated Normal IV Further caliceal dilatation Thin ↵* Proposed by the Society of Fetal Urology (20).
Grade* Description I Reflux into ureter, no dilatation II Level of kidney, no dilatation III Mild to moderate dilatation, minimal caliceal blunting IV Moderate dilatation, loss of angles and fornices, papillary impression in calices still visible V Gross dilatation and tortuosity, impressions of papillae no longer present ↵* Proposed by the International Reflux Study Committee (46).
Method Strength Limitation Doppler sonography (±captopril enhancement) (58) Is reasonably expensive and widely available Is operator dependent (more reliable in centers with dedicated radiologists) Measures renal length Has high rate of unsuccessful studies (10%–20% due to obesity or bowel gas) Can monitor recurrent stenosis after corrective therapy Is less useful than MRI or CT angiography for diagnosing abnormalities in FMD or accessory renal arteries Is effective in classifying patients as responders or nonresponders to therapy (renal resistance index ≥ 80%) MRA (59) Does not expose patient to ionizing radiation or nephrotoxic contrast agents Poorly reveals distal segments and small accessory renal arteries Is useful in patients with renal failure Is affected by respiratory artifacts, intestinal peristalsis, stents, or claustrophobia in the patient Has high negative predictive value (98%) Is costly and of limited availability Seems best diagnostic tool for atherosclerotic RAS Has low positive predictive value even in selected population MRI (±captopril enhancement) (60) Does not expose patient to ionizing radiation Has same advantages as MRA May allow identification of responders to percutaneous renal angioplasty CT angiography (59) Has higher spatial resolution than that of MRA Uses nephrotoxic contrast agent and high radiation dose Shows calcium content of atherosclerotic lesions before treatment Poorly reveals distal segments and small accessory renal arteries Does not have artifacts caused by stents CT (58) Measures cortical thickness and renal length, which are decreased in unilateral RAS Uses nephrotoxic contrast agent and high radiation dose Is not yet fully developed Captopril-enhanced renography (61) Is reasonably expensive; safe Is less accurate in cases of renal function impairment, bilateral stenosis, or unilateral stenosis in a patient with only 1 kidney Identifies patients whose blood pressure will improve after RAS correction Excludes RVH if findings are normal Renal angiography (62) Is most accurate test for anatomic RAS (gold standard) Uses nephrotoxic contrast agent and high radiation dose Allows use of less contrast agent with digital subtraction angiography Can be affected by interobserver variability Period Indication Shortly after surgery Delayed graft function Acute tubular necrosis in cadaver kidney Acute rejection Vascular complications Urinary complications Drug toxicity Change of graft function improvement Acute rejection Vascular complications Urinary complications Drug toxicity Abdominal pain not explained by sonographic examination Acute rejection Vascular complications Urinary complications Nonrenal complications Longer after surgery Unexplained decrease of graft function Chronic allograft nephropathy Drug toxicity RAS UTI/functional impairment Hypertension Uropathy Obstruction VUR Postvoiding residue


