
Main menu

  • Home
  • Content
    • Current
    • Ahead of print
    • Past Issues
    • JNM Supplement
    • SNMMI Annual Meeting Abstracts
    • Continuing Education
    • JNM Podcasts
  • Subscriptions
    • Subscribers
    • Institutional and Non-member
    • Rates
    • Journal Claims
    • Corporate & Special Sales
  • Authors
    • Submit to JNM
    • Information for Authors
    • Assignment of Copyright
    • AQARA requirements
  • Info
    • Reviewers
    • Permissions
    • Advertisers
  • About
    • About Us
    • Editorial Board
    • Contact Information
  • More
    • Alerts
    • Feedback
    • Help
    • SNMMI Journals
  • SNMMI
    • JNM
    • JNMT
    • SNMMI Journals
    • SNMMI

User menu

  • Subscribe
  • My alerts
  • Log in
  • Log out
  • My Cart

Search

  • Advanced search
Journal of Nuclear Medicine
  • SNMMI
    • JNM
    • JNMT
    • SNMMI Journals
    • SNMMI
  • Subscribe
  • My alerts
  • Log in
  • Log out
  • My Cart
Journal of Nuclear Medicine

Advanced Search

  • Home
  • Content
    • Current
    • Ahead of print
    • Past Issues
    • JNM Supplement
    • SNMMI Annual Meeting Abstracts
    • Continuing Education
    • JNM Podcasts
  • Subscriptions
    • Subscribers
    • Institutional and Non-member
    • Rates
    • Journal Claims
    • Corporate & Special Sales
  • Authors
    • Submit to JNM
    • Information for Authors
    • Assignment of Copyright
    • AQARA requirements
  • Info
    • Reviewers
    • Permissions
    • Advertisers
  • About
    • About Us
    • Editorial Board
    • Contact Information
  • More
    • Alerts
    • Feedback
    • Help
    • SNMMI Journals
  • View or Listen to JNM Podcast
  • Visit JNM on Facebook
  • Join JNM on LinkedIn
  • Follow JNM on Twitter
  • Subscribe to our RSS feeds
Research ArticleCLINICAL INVESTIGATIONS

Quantification of Protein Synthesis in the Human Brain Using l-[1-11C]-Leucine PET: Incorporation of Factors for Large Neutral Amino Acids in Plasma and for Amino Acids Recycled from Tissue

Senthil K. Sundaram, Otto Muzik, Diane C. Chugani, Fanrong Mu, Thomas J. Mangner and Harry T. Chugani
Journal of Nuclear Medicine November 2006, 47 (11) 1787-1795;
Senthil K. Sundaram
  • Find this author on Google Scholar
  • Find this author on PubMed
  • Search for this author on this site
Otto Muzik
  • Find this author on Google Scholar
  • Find this author on PubMed
  • Search for this author on this site
Diane C. Chugani
  • Find this author on Google Scholar
  • Find this author on PubMed
  • Search for this author on this site
Fanrong Mu
  • Find this author on Google Scholar
  • Find this author on PubMed
  • Search for this author on this site
Thomas J. Mangner
  • Find this author on Google Scholar
  • Find this author on PubMed
  • Search for this author on this site
Harry T. Chugani
  • Find this author on Google Scholar
  • Find this author on PubMed
  • Search for this author on this site
  • Article
  • Figures & Data
  • Info & Metrics
  • PDF
Loading

Article Figures & Data

Figures

  • Tables
  • FIGURE 1. 
    • Download figure
    • Open in new tab
    • Download powerpoint
    FIGURE 1. 

    (A) Time course of 11C concentration associated with total plasma, unmetabolized l-[1-11C]-leucine, and l-[1-11C]-leucine in plasma protein. (B) Fraction of unmetabolized free l-[1-11C]-leucine relative to total 11C concentration in plasma fitted with a 3-parameter (offset, α, β) sigmoidal function. Parameter values that best fit data are reported. Fitted curve explains more than 90% of variance in data.
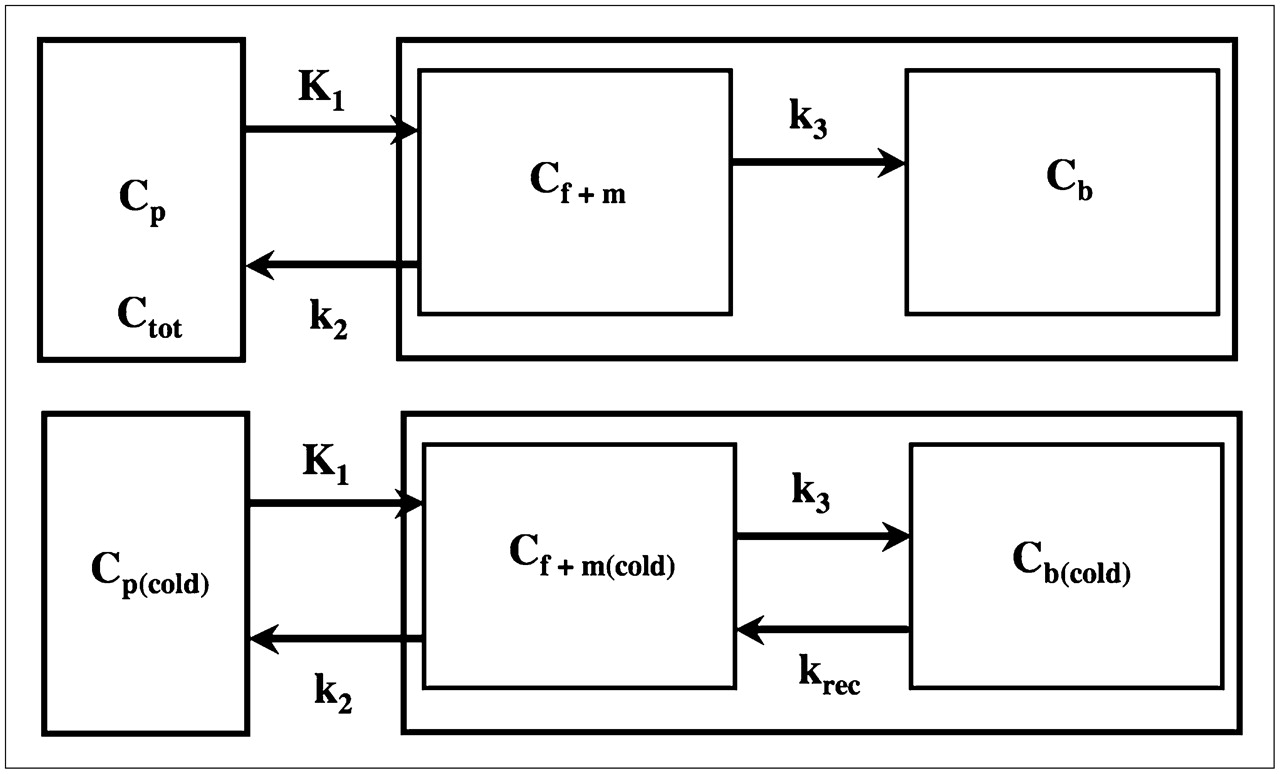
  • FIGURE 2. 
    • Download figure
    • Open in new tab
    • Download powerpoint
    FIGURE 2. 

    (Top) Simplified 2-tissue-compartment model for labeled leucine, with k2 representing effective loss of 11C tracer from tissue and k3 representing effective incorporation of l-[1-11C]-leucine into protein. Tracer concentration in combined free and metabolic compartment is denoted as Cf+m, and tracer concentration in protein pool is denoted as Cb. (Bottom) Simplified 2-tissue-compartment model for unlabeled leucine, with krec representing recycled leucine as product of brain protein breakdown. Models describing l-[1-11C]-leucine and unlabeled leucine differ only with respect to krec, which is zero for l-[1-11C]-leucine.
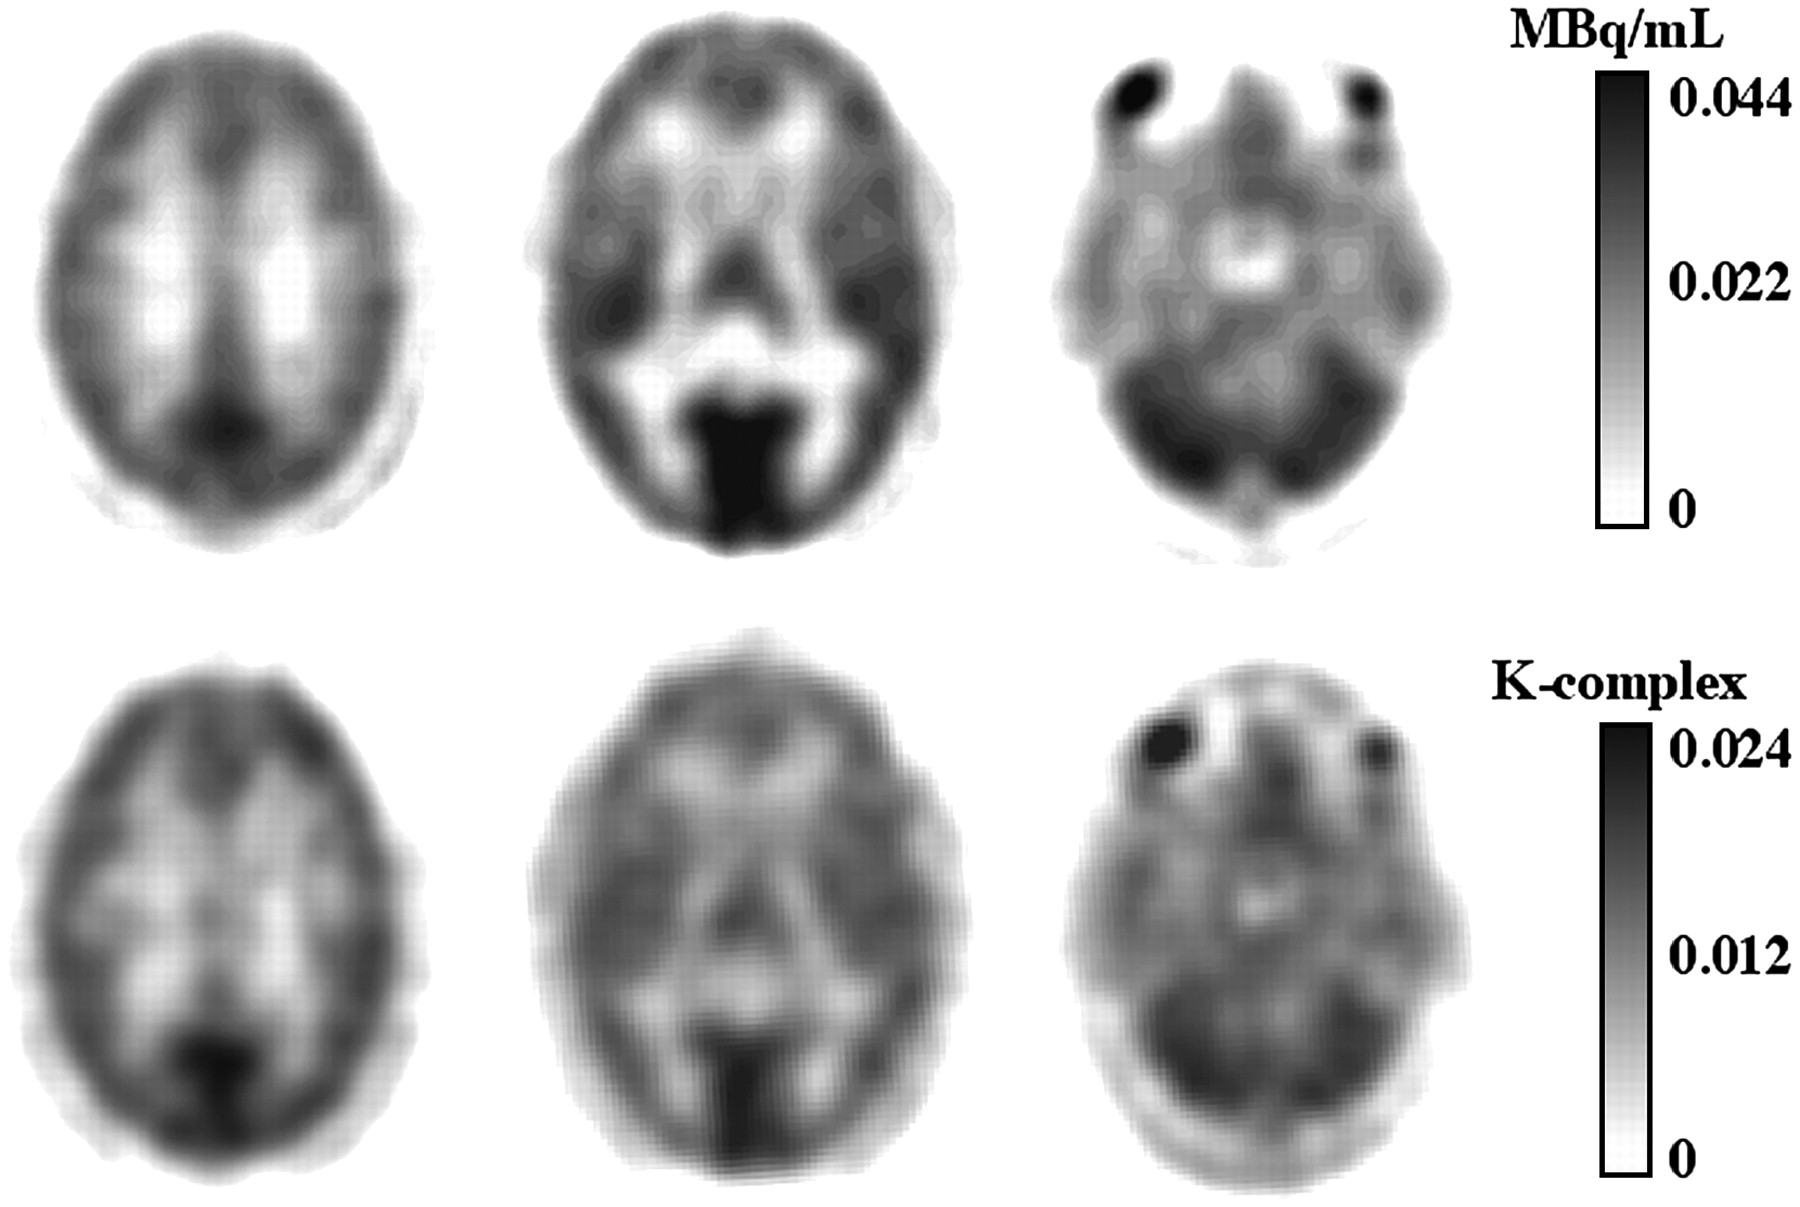
  • FIGURE 3. 
    • Download figure
    • Open in new tab
    • Download powerpoint
    FIGURE 3. 

    (Top) Averaged images representing Kcplx macroparameter from 20 to 60 after injection at 3 levels through brain. (Bottom) Corresponding parametric images obtained from representative subject. Kcplx values derived from parametric images agreed within 3% with those derived from compartmental analysis of time–activity curves.
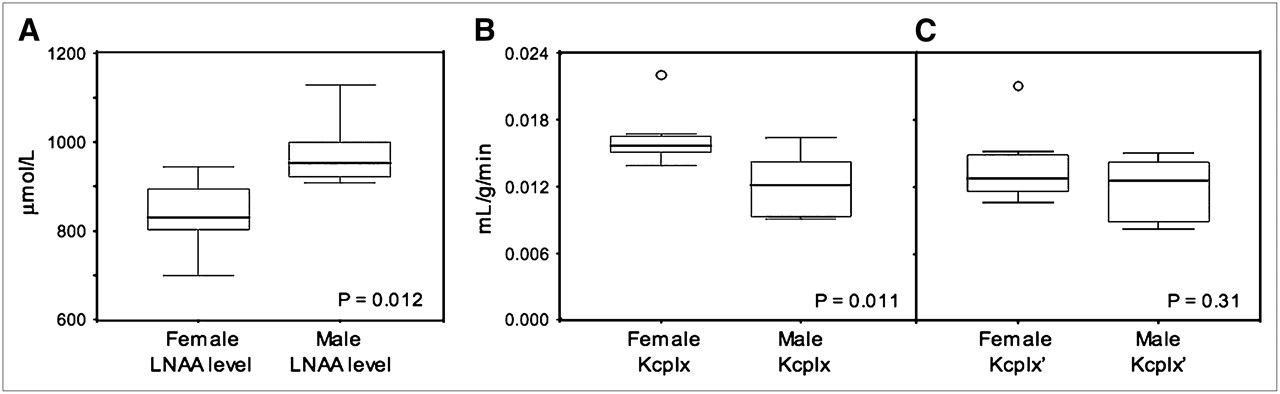
  • FIGURE 4. 
    • Download figure
    • Open in new tab
    • Download powerpoint
    FIGURE 4. 

    Box plot showing inverse relationship between plasma concentration of sum of all LNAAs (A) and Kcplx macroparameter (B). Box itself contains middle 50% of data, with line in box indicating median value. Ends of vertical lines, representing maximum and minimum data values, and points outside this range are considered outliers. The significantly lower total LNAA levels found in women (P = 0.012) appear related to significantly higher estimates of Kcplx macroparameter in women than in men (P = 0.011). (C) Kcplx macroparameter value for men and women after normalization to standard total plasma LNAA concentration of 1,000 μmol/L.
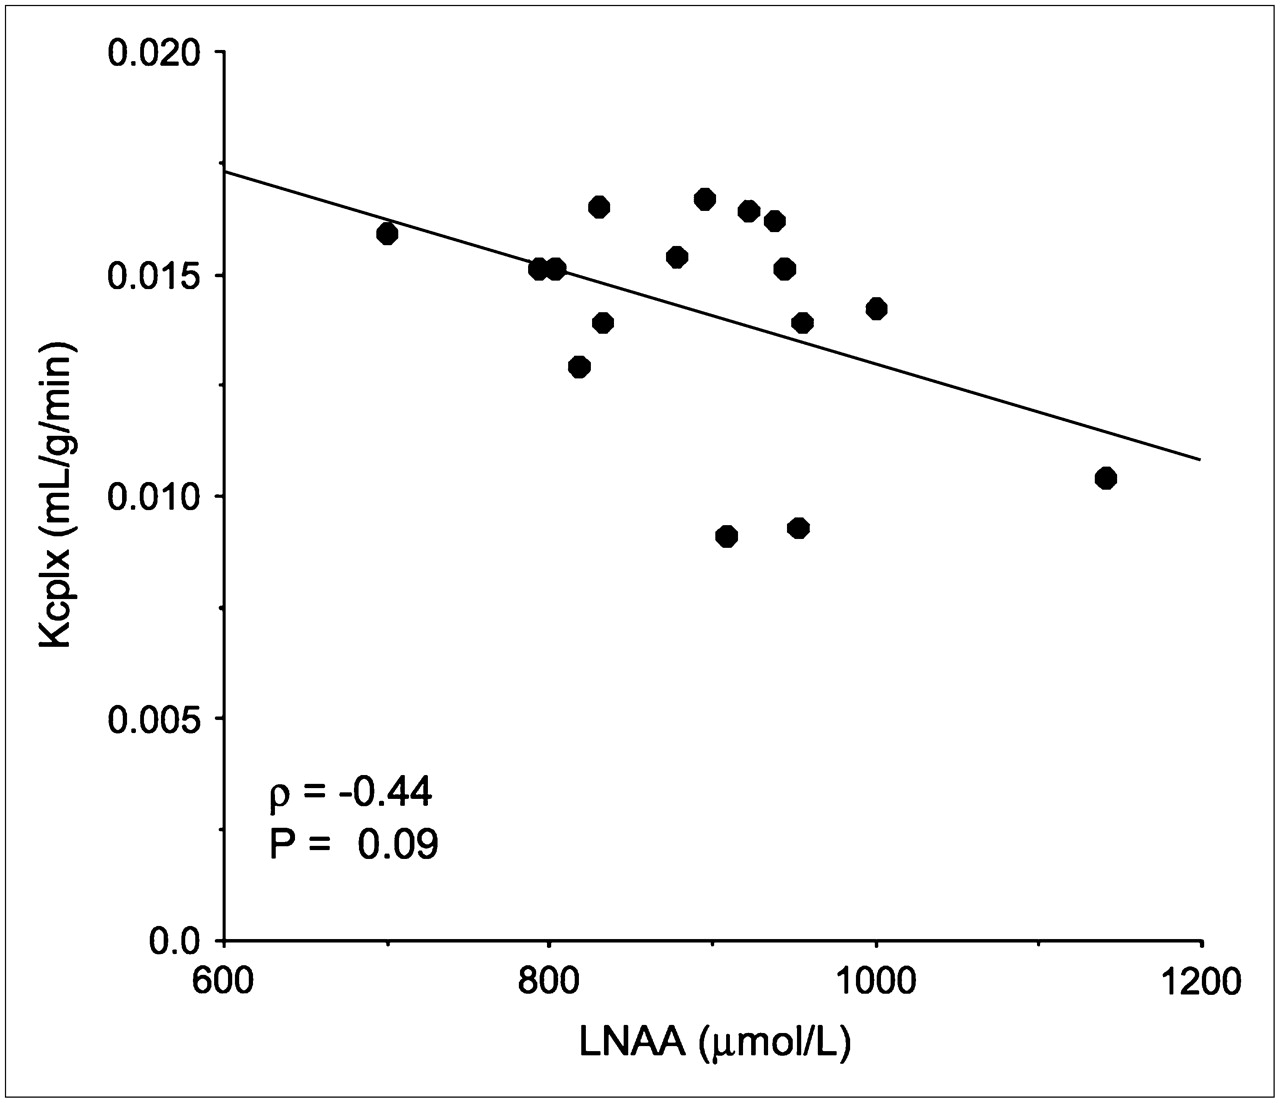
  • FIGURE 5. 
    • Download figure
    • Open in new tab
    • Download powerpoint
    FIGURE 5. 

    Inverse relationship between estimated Kcplx macroparameter (mL/g/min) and measured plasma total LNAA concentration (μmol/L). Correlation analysis suggests statistical trend between these 2 variables.
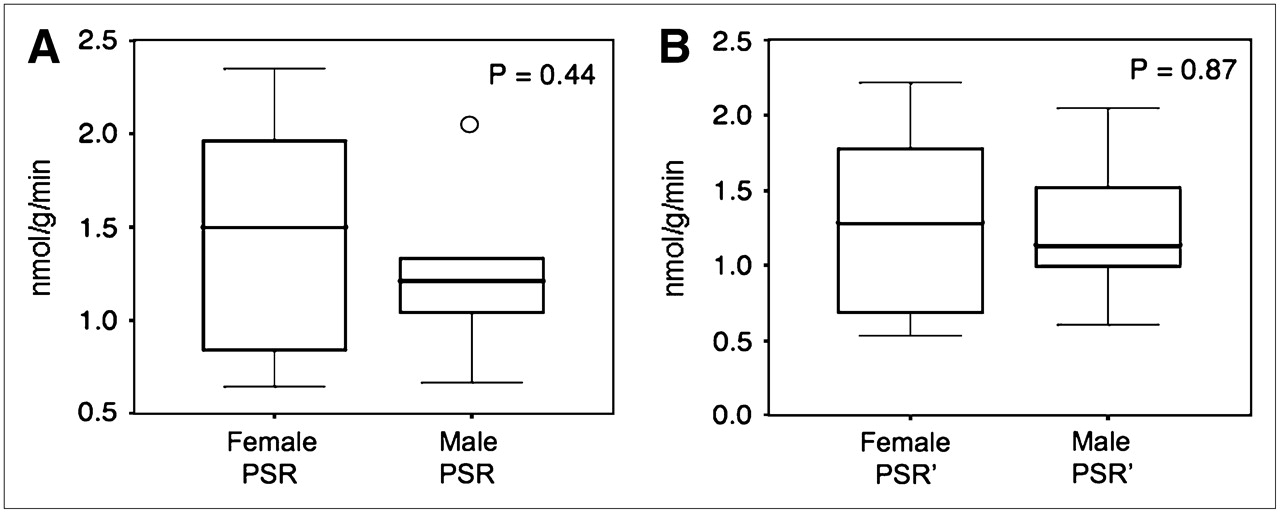
  • FIGURE 6. 
    • Download figure
    • Open in new tab
    • Download powerpoint
    FIGURE 6. 

    Box-plot comparison of whole-brain PSR values obtained for men and women. Middle 50% of data lie within box, with ends of vertical lines representing maximum and minimum data values. Points outside minimum and maximum values are considered outliers. (A) PSR values calculated on basis of leucine kinetics without correction for plasma total sum of LNAAs. (B) PSR values after normalization of plasma total sum of LNAAs to standard value of 1,000 μmol/L (PSR′). Although neither measure of PSR is significantly different between the sexes, correction for plasma total sum of all LNAAs results in smaller difference between mean male and female PSRs, indicating a small effect of total plasma LNAA levels on PSR measure.
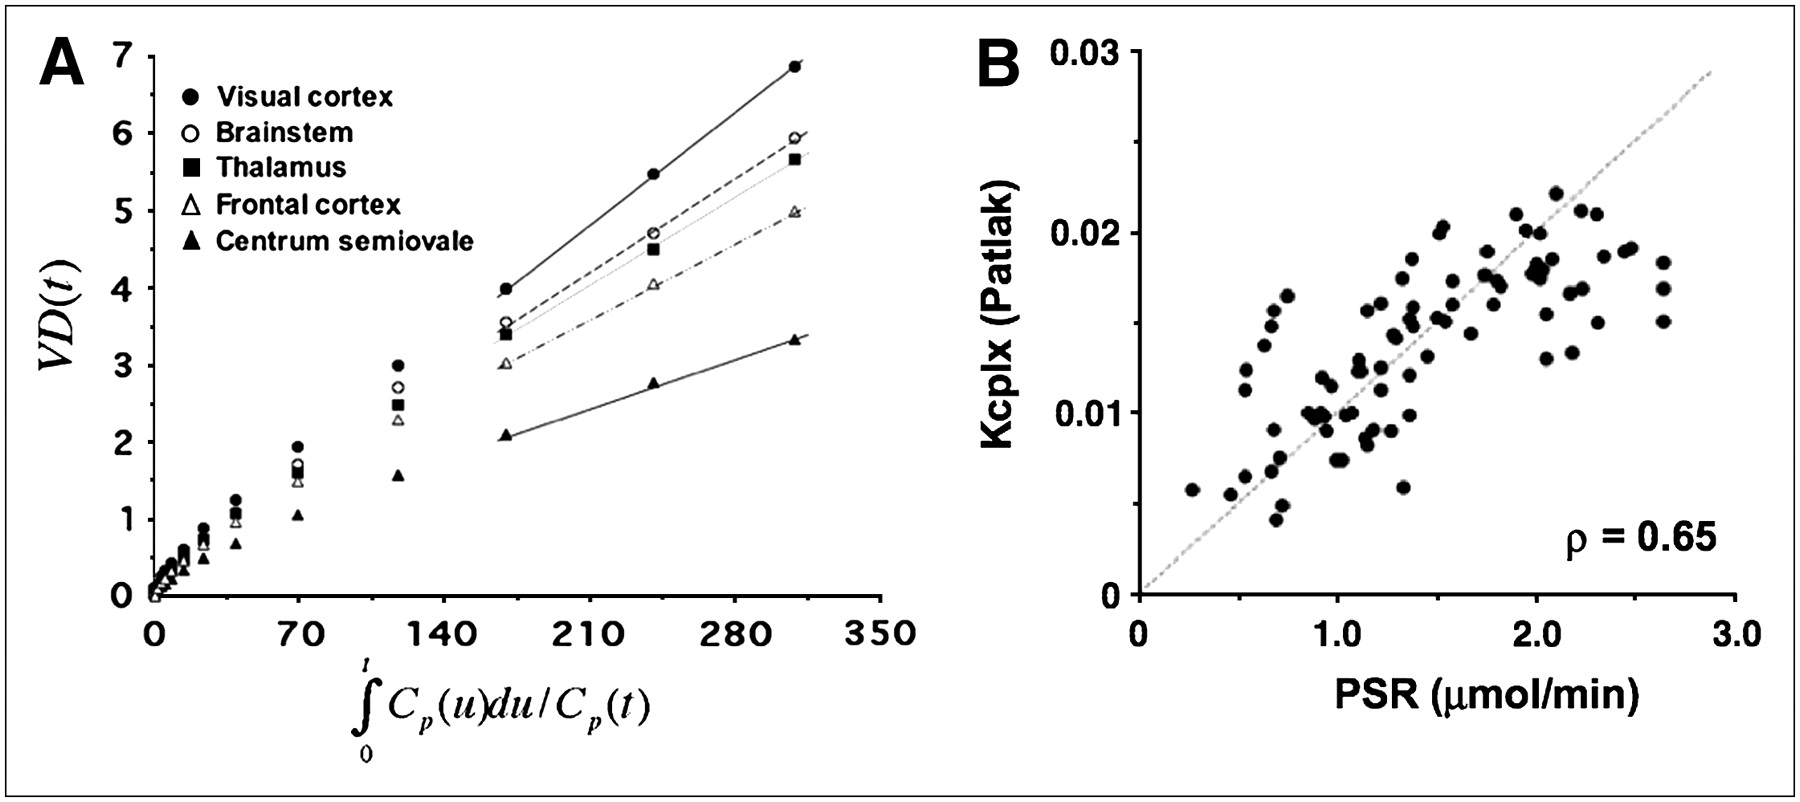
  • FIGURE 7. 
    • Download figure
    • Open in new tab
    • Download powerpoint
    FIGURE 7. 

    (A) Patlak plot obtained from representative subject showing linear behavior of transformed curves at times later than 30 min after injection. Slope of fitted lines represents Kcplx estimates, which closely correspond to Kcplx values derived using compartmental model. (B) Relationship between regional PSR values and Kcplx macroparameter determined using Patlak graphical analysis. Brain regions include visual cortex, brain stem, cerebellar thalamus, frontal cortex, and white matter. Line of identity is displayed as dotted line. Plot shows excellent correlation between these 2 measures of PSR (ρ = 0.65).

Tables

  • Figures
    • View popup
    TABLE 1

    Regional Values of Kcplx (Normalized to Standard Plasma Total LNAA Concentration)

    ROIAllWomenMenP
    Visual cortex0.0176 (22)0.0189 (18)0.0154 (23)0.08
    Brain stem0.0165 (24)0.0175 (22)0.0148 (23)0.18
    Cerebellum0.0161 (23)0.0172 (21)0.0143 (25)0.13
    Thalamus0.0151 (23)0.0160 (22)0.0136 (24)0.20
    Frontal cortex0.0140 (20)0.0147 (19)0.0128 (21)0.20
    White matter0.0085 (23)0.0088 (25)0.0079 (16)0.34
    Whole brain0.0131 (23)0.0138 (22)0.0119 (24)0.21
    • Data, in mL/g/min, were determined from all subjects in whom total plasma LNAA concentrations were determined (6 men and 10 women). Values in parentheses represent coefficient of variation (SD/mean × 100) determined from all subjects. P value indicates significance of sex difference.

    • View popup
    TABLE 2

    Fraction of Brain Leucine Originating from Exogenous Sources

    ROIAllWomenMen
    Cerebellum0.68 (4)0.68 (4)0.68 (6)
    White matter0.67 (3)0.67 (2)0.67 (5)
    Thalamus0.67 (5)0.67 (4)0.65 (5)
    Visual cortex0.65 (3)0.65 (2)0.64 (3)
    Frontal cortex0.63 (5)0.64 (4)0.63 (7)
    Brain stem0.62 (5)0.62 (5)0.62 (5)
    Whole brain0.64 (4)0.64 (3)0.64 (6)
    • Data were derived from all subjects (11 men and 16 women). Regional values for λ were confined to narrow range between 0.6 and 0.7. Values in parentheses represent coefficient of variation.

    • View popup
    TABLE 3

    Regional PSR, PSR Normalized to PSR′, Kcplx and Kcplx′ Derived from Compartmental Model, and Kcplx Derived Using Patlak Graphical Method

    ROIPSR (nmol/g/min)PSR′ (nmol/g/min)Kcplx (mL/g/min)Kcplx′ (mL/g/min)Kcplx, Patlak (mL/g/min)
    Visual cortex1.85 (36)1.68 (39)0.0198 (24)0.0176 (22)0.0174 (22)
    Brain stem1.74 (39)1.59 (42)0.0185 (24)0.0165 (24)0.0163 (26)
    Cerebellum1.71 (39)1.56 (41)0.0181 (23)0.0161 (23)0.0160 (21)
    Thalamus1.60 (38)1.45 (42)0.0169 (23)0.0151 (23)0.0152 (19)
    Frontal cortex1.48 (38)1.35 (42)0.0157 (20)0.0140 (20)0.0140 (23)
    Centrum semiovale0.91 (41)0.83 (44)0.0095 (22)0.0085 (22)0.0078 (29)
    Whole brain1.39 (40)1.27 (42)0.0147 (22)0.0131 (23)0.0133 (23)
    • Data were determined from all subjects in whom total plasma LNAA concentrations were determined (6 men and 10 women). Regional rank order is preserved in all 3 measures of PSR. Values in parentheses represent coefficient of variation (SD/mean × 100).

PreviousNext
Back to top

In this issue

Journal of Nuclear Medicine: 47 (11)
Journal of Nuclear Medicine
Vol. 47, Issue 11
November 2006
  • Table of Contents
  • Table of Contents (PDF)
  • About the Cover
  • Index by author
Print
Download PDF
Article Alerts
Sign In to Email Alerts with your Email Address
Email Article

Thank you for your interest in spreading the word on Journal of Nuclear Medicine.

NOTE: We only request your email address so that the person you are recommending the page to knows that you wanted them to see it, and that it is not junk mail. We do not capture any email address.

Enter multiple addresses on separate lines or separate them with commas.
Quantification of Protein Synthesis in the Human Brain Using l-[1-11C]-Leucine PET: Incorporation of Factors for Large Neutral Amino Acids in Plasma and for Amino Acids Recycled from Tissue
(Your Name) has sent you a message from Journal of Nuclear Medicine
(Your Name) thought you would like to see the Journal of Nuclear Medicine web site.
Citation Tools
Quantification of Protein Synthesis in the Human Brain Using l-[1-11C]-Leucine PET: Incorporation of Factors for Large Neutral Amino Acids in Plasma and for Amino Acids Recycled from Tissue
Senthil K. Sundaram, Otto Muzik, Diane C. Chugani, Fanrong Mu, Thomas J. Mangner, Harry T. Chugani
Journal of Nuclear Medicine Nov 2006, 47 (11) 1787-1795;

Citation Manager Formats

  • BibTeX
  • Bookends
  • EasyBib
  • EndNote (tagged)
  • EndNote 8 (xml)
  • Medlars
  • Mendeley
  • Papers
  • RefWorks Tagged
  • Ref Manager
  • RIS
  • Zotero
Share
Quantification of Protein Synthesis in the Human Brain Using l-[1-11C]-Leucine PET: Incorporation of Factors for Large Neutral Amino Acids in Plasma and for Amino Acids Recycled from Tissue
Senthil K. Sundaram, Otto Muzik, Diane C. Chugani, Fanrong Mu, Thomas J. Mangner, Harry T. Chugani
Journal of Nuclear Medicine Nov 2006, 47 (11) 1787-1795;
Twitter logo Facebook logo LinkedIn logo Mendeley logo
  • Tweet Widget
  • Facebook Like
  • Google Plus One
Bookmark this article

Jump to section

  • Article
    • Abstract
    • MATERIALS AND METHODS
    • RESULTS
    • DISCUSSION
    • CONCLUSION
    • Acknowledgments
    • Footnotes
    • References
  • Figures & Data
  • Info & Metrics
  • PDF

Related Articles

  • This Month in JNM
  • PubMed
  • Google Scholar

Cited By...

  • SLCs contribute to endocrine resistance in breast cancer: role of SLC7A5 (LAT1)
  • Google Scholar

More in this TOC Section

  • Feasibility of Ultra-Low-Activity 18F-FDG PET/CT Imaging Using a Long–Axial-Field-of-View PET/CT System
  • Cardiac Presynaptic Sympathetic Nervous Function Evaluated by Cardiac PET in Patients with Chronotropic Incompetence Without Heart Failure
  • Validation and Evaluation of a Vendor-Provided Head Motion Correction Algorithm on the uMI Panorama PET/CT System
Show more Clinical Investigations

Similar Articles

SNMMI

© 2025 SNMMI

Powered by HighWire