


Abstract
Dopamine transporter (DAT) ligands have been developed for in vivo imaging of the dopaminergic system in SPECT. Although the visual analysis of SPECT images is, in general, suitable for clinical assessment, the accurate quantification of the striatal uptake might increase the sensitivity of the technique and help in the early diagnosis, follow-up, and eventual treatment response of Parkinson’s disease (PD). This work is focused on assessment of the quantification of specific uptake of 99mTc-DAT ligands when compensation for all degrading phenomena is performed. Methods: The SimSET Monte Carlo (MC) code was used to generate a set of SPECT projections of a numeric striatal phantom with different specific uptake ratios (SURs). An absolute quantification method (AQM), which performs a MC-based scatter compensation and a fully 3-dimensional (3D) reconstruction, was implemented. The scatter estimate was included in the reconstruction algorithm. Results: The use of attenuation, point-spread-function (PSF), and scatter corrections resulted in an improvement in the value of the SUR of 37% on average with respect to the reconstruction without corrections. The magnitude of each improvement corresponded to 7% for the attenuation correction, 12% for the PSF correction using a 2-dimensional reconstruction algorithm and a further 11% for the PSF correction using a 3D reconstruction algorithm, and 7% for the scatter correction. Conclusion: Our findings indicate that the PSF correction plays a major role in the quantification of striatal uptake in comparison with the attenuation correction and the scatter correction. The implemented method also provides an absolute quantification procedure based on MC methods that do not depend on empiric approximations. The relative quantification results using the proposed AQM accounted for 96%–97% of the nominal SUR, whereas the limit achieved using only primary photons attained 98%–99%. The volumetric activity values obtained using the AQM converged toward the nominal values.
Parkinson’s disease (PD) is a neurologic disorder characterized by akinesia, bradykinesia, tremor, rigidity, and postural instability (1). Although the inductor mechanism is still unknown, PD is associated with the loss of dopaminergic neurons from the substantia nigra and with an important dopamine depletion in the striatum. Therefore, in vivo imaging of the nigrostriatal dopaminergic system could be a feasible quantitative biomarker of neuronal degeneration in idiopathic PD (2).
The dopamine transporter (DAT) has proved to be a sensitive target (3,4) and DAT ligands for PET and SPECT have been developed for in vivo imaging of dopaminergic systems (5). PET tracers are suitable biomarkers for studying the presynaptic dopaminergic terminal function (6) but, given the lower costs and wide access of SPECT, radioligands with affinity for DAT have emerged as an alternative. These DAT ligands include 123I-agents such as the N-ω-fluoropropyl-2β-carbomethoxy-3β-(4-iodophenyl)tropane (FP-CIT) and 99mTc-ligands such as TRODAT-1 (7).
Although the visual analysis of SPECT images is, in general, suitable for clinical assessment, the accurate quantification of the striatal uptake might increase sensitivity of the technique and help in early diagnosis (8,9), follow-up (10), and eventual treatment response of PD (9).
Accurate quantification in SPECT is impaired by several factors, including statistical noise, attenuation, scatter, and the spatially variant point spread function (PSF). Correction for these effects has been a research topic in nuclear medicine for the past 2 decades and several authors have highlighted the importance of correcting the associated degradations (11,12). Moreover, in neurotransmission SPECT, the small size of striatal cavities stresses the role of PSF correction (13). The PSF and attenuation may be corrected in a straightforward and efficient way by using iterative algorithms, which include the projection models for nonhomogeneous objects in the transition matrix. To accurately model the photon crosstalk between transaxial slices, fully 3-dimensional (3D) reconstruction is necessary. In contrast to 2-dimensional (2D) (slice-by-slice) reconstruction, fully 3D reconstruction uses large matrices that enable us to consider photons that are detected in out-of-slice projection pixels. This improves the accuracy of the reconstructions despite being time-consuming. Such accurate reconstructions can be performed many times faster with block-iterative methods, such as the ordered-subsets expectation maximization (OSEM) algorithm (14).
Some methods have been proposed for scatter correction (15,16). There are empiric models that estimate the scatter distribution based on the detected photons in adjacent energy windows (17,18), the modeling of a spatially invariant function (19), or the transmission measurement data (20). In general, these models provide an approximate estimation of the number and the spatial distribution of scattered photons.
A different approach is based on the Monte Carlo (MC) simulation, which enables a more realistic modeling of the scattering phenomena. However, the direct extension of the scatter correction using the inverse Monte Carlo methods (21) for fully 3D SPECT reconstruction becomes impractical because of the excessive computation time and memory required for precalculating and storing the scattering weights in the fully 3D transition matrix (22). Other efficient scatter compensation strategies have been developed incorporating a MC-based scatter estimate in different parts of the maximum-likelihood expectation maximization (MLEM) algorithm (23). The reconstruction-based strategy uses a MC-based scatter estimate in the denominator of the iterative algorithm as a constant additive term in the forward projector equation (24,25). In this study, we use this strategy to handle the scatter data. The advantage of such an approach is to provide a unified formal framework to feasibly combine the benefits of accurate iterative reconstruction methods with a general scatter correction method.
Thus, this work focused on 2 main objectives. The first objective was to develop an absolute quantification method (AQM), which includes a MC-based scatter correction and a fully 3D reconstruction algorithm. The second aim was to assess the accuracy of the quantification of specific uptake of DAT ligands with 99mTc when compensation for all degrading phenomena is performed.
MATERIALS AND METHODS
Numeric Phantom
A numeric phantom was implemented by using experimental data obtained from a CT image of an anthropomorphic striatal phantom (Radiology Support Devices, Inc.). The CT image was segmented to extract brain tissue, basal ganglia, and bone. Brain tissue and bone were automatically segmented by thresholding the CT image. The striatal nuclei were manually drawn over the corresponding slices. The nonuniform attenuation map was obtained by setting the attenuation coefficients to 0.143 cm−1 for brain and 0.304 cm−1 for bone to simulate the 99mTc-TRODAT-1 radiopharmaceutical.
Three activity maps were defined by assigning a constant background value of 14 kBq/mL to the brain tissue and volumetric activities of 98, 56, and 35 kBq/mL to the striatal structures. These activity values for the striatum took into account the fact that the striatal uptake corresponds to the sum of the specific and nonspecific uptake of the radioligand. The specific uptake ratio (SUR) is defined as (S-NS)/NS, where S is the mean of the volumetric activity in a striatal region (caudate or putamen) and NS is the volumetric activity in the occipital reference region. The resulting specific-to-nonspecific uptake ratios were 6, 3, and 1.5, respectively, in agreement with the results of clinical trials with TRODAT-1 in healthy volunteers and patients with different degrees of PD (26–28). Figure 1 shows the activity distribution of the 4 central axial slices of the numeric phantom for a SUR of 6.
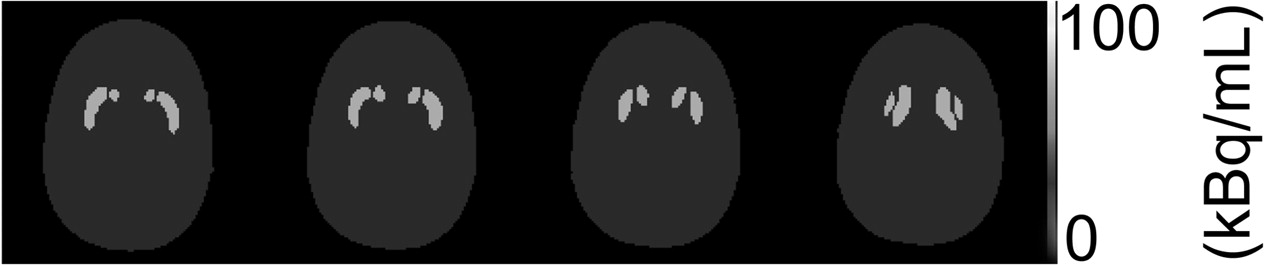
Activity map corresponding to 4 central slices of striatal phantom with SUR of 6. Volumetric activity was considered to be 14 kBq/mL in the background region (dark gray) and 98 kBq/mL in the striatum (gray). Scale of volumetric activity can be seen on right with values ranging from 0 (black) to 100 kBq/mL (white).
SimSET Simulation
The SimSET MC code (29) was used to obtain the projections. This simulation code includes all image degrading effects—that is, modeling of attenuation, fanbeam collimator response, and scattering for nonhomogeneous voxelized objects. SimSET allows a precise modeling of photon interactions by using one of the most accurate cross-section libraries (30). The simulation considered multiple scatter orders in the object but the scatter in the collimator/detector system was neglected because of the low-energy of photons of 99mTc-TRODAT-1 agents (31).
These simulations were performed on a Linux workstation with an Athlon MP processor at 1.4-GHz clock speed and with 2 GB of RAM. The simulation conditions used with the photon history generator module included (a) the numeric phantom of 128 × 128 × 12 voxels, with a voxel volume of 0.17 × 0.17 × 0.5 cm3; (b) simulation of a 99mTc-TRODAT SPECT study of 45 min in a γ-camera with 2 detector heads and a rotation radius of 13 cm; (c) importance sampling as a variance reduction technique; and (d) tracking of 8 × 10⁷ photons of 140 keV to obtain approximately 3.0 million detected photons in projections. The binning module included (i) 120 projections over 360°, 128 × 12 pixels each, pixel size 0.44 × 0.44 cm2; (ii) an energy window selecting photons ranging from 126 to 154 keV; and (iii) collection of scattered and primary photons in separate files. The collimator module incorporated a converging fanbeam cast collimator with focal length F = 35.5 cm, hexagonal hole side of width = 0.0866 cm, septal thickness s = 0.02 cm, length L = 4.0 cm, and field of view of 50 × 25 cm. The NaI detector was characterized in the detector module of SimSET by using the calibrated detection efficiency and the intrinsic energy resolution. This last function was modeled as a gaussian distribution with a full width at half maximum of 10% for 140 keV. To statistically assess the influence of noise, 10 noisy runs were performed for each nominal activity value.
Reconstruction Algorithm
In earlier studies, we implemented (32) a 2D iterative reconstruction algorithm based on the OSEM algorithm. In this work, an upgraded version, including fully 3D reconstruction, was developed to take into account the photon crosstalk effect between transaxial slices. This version allowed us to correct for attenuation and distance-dependent collimator response, which were incorporated into the transition matrix. To reduce the amount of memory, the transition matrix was split into the same number of partial submatrices as ordered subsets. Thus, each partial submatrix included the contribution of the object for each subset of projections. These submatrices were stored using optimization techniques for sparse matrices (33). At each iteration, the corresponding submatrix was loaded, the subset of projections was reconstructed, and the submatrix was unloaded. Despite the fact that reading each submatrix is time-consuming, this strategy constitutes a trade-off between computation time and RAM memory capacities. This 3D reconstruction algorithm based on OSEM using partial submatrices will be referred to as P3D-OSEM throughout the work. Fifteen subsets were chosen for reconstruction.
AQM
The AQM was designed to provide an absolute volumetric activity at each voxel of the image. The AQM consists of the P3D-OSEM reconstruction algorithm with a scatter compensation method. Hence, the recursive expression to obtain the image λi from the original total projections pj is (25):
 Eq. 1 where k is the iteration number, tji is the transition matrix, and sj is the scatter contribution estimated in bin j.
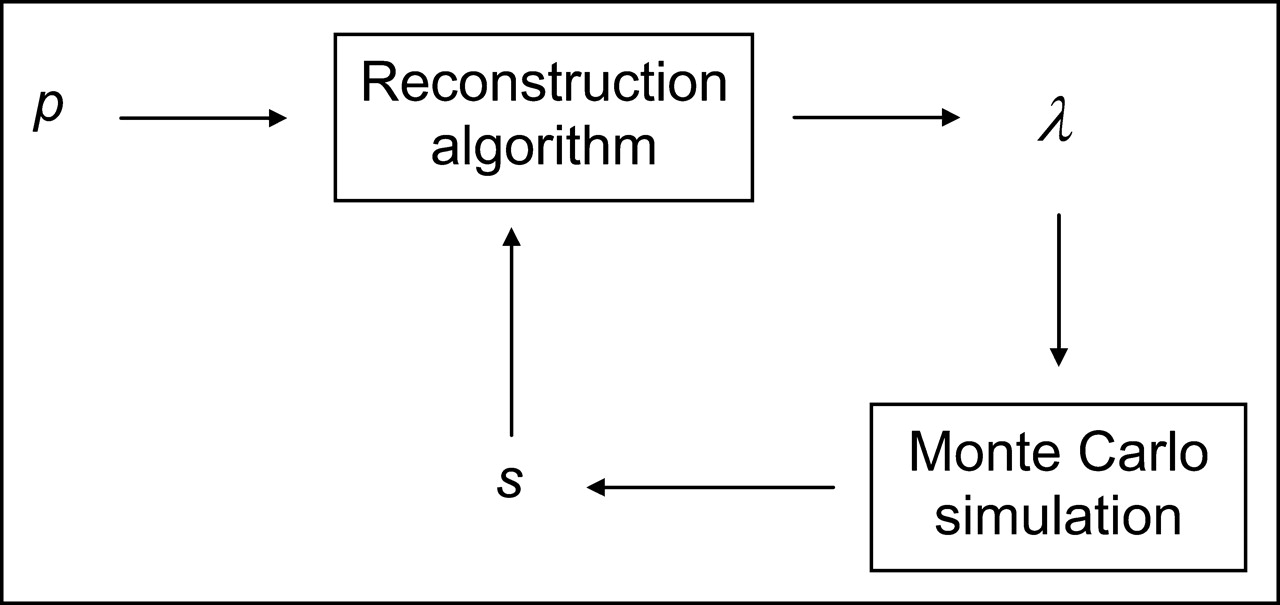
The scatter estimate (s) is calculated with the aid of the MC code SimSET. The input image for the MC simulation is obtained recursively as outlined in Figure 2, in which the reconstruction algorithm is that of Equation 1.

Scheme of reconstruction algorithm. Boxes represent implemented algorithms, whereas letters represent experimental projections (p), reconstructed images (λ), and estimated scatter distribution (s).
The reconstructed image at the first recursion (which we shall call loop zero L = 0) is obtained from Equation 1 by using the original projections (p) without any scatter compensation (s = 0). According to Equation 1, the reconstructed image may be calculated at an iteration number (k) defined by the user. In the light of earlier results for the dopaminergic system (34), the image at the first iteration was selected as the input activity distribution of the SimSET simulator to estimate the scatter distribution (s). This scatter estimate is used to generate the image for the next loop (L = 1). The resulting image is normalized by applying a factor matching the counts of the simulated and the original total projections. This procedure was repeated for N loops to determine which loop provided the most accurate scatter estimate. A low-noise scatter estimate was considered to facilitate the convergence of the algorithm (23). To this end, the number of simulated photons in the MC scatter estimation was increased by a factor of 10 with respect to the original total projections. Thus, the noise level diminished to 32% of the original noise level. To achieve this level, the MC simulation to generate the 120 projections took 12 h on the workstation described. The same simulation performed in a cluster of 10 processors at 1.5-GHz clock speed and with 1 GB of RAM took 1.3 h. To avoid any correlation between the estimated and the original scatter distributions, different seeds were used in the generation of random numbers for the simulation of the projections.
Quantification of Striatal Uptake
The quantification of SUR was performed by using volumetric regions of interest (ROIs) in caudate, putamen, and an occipital region, which was used as a reference area.
The specific putamen (SUR(P)) and caudate (SUR(C)) uptake ratios were calculated to assess the accuracy of the quantification in the 2 striatal structures individually. The results will be pre-sented as the mean of the right and left nuclei for each striatal structure. The normalized SUR for caudate or putamen (nSUR(P) or nSUR(C)) was obtained as the quotient between the calculated and the nominal value of SUR.
To assess the effect of the compensation for degradations in the relative quantification, we included the following corrections in the reconstruction algorithm: nAnPnS (no corrections), AnPnS (only attenuation correction), A2DPnS (attenuation and PSF with 2D reconstruction), A3DPnS (attenuation and PSF with 3D reconstruction), A3DPS (the AQM), and A3DPp (all corrections using only primary photons). Note that the PSF is a 1-dimension function when the 2D reconstruction is performed or a 2-dimension function when the 3D reconstruction is implemented.
The AQM provides the absolute volumetric activity values at each voxel of the reconstructed image. The absolute uptake values in caudate (U(C)) and putamen (U(P)) were calculated as the average of the volumetric activity values in each ROI. To evaluate the effect of statistical noise in the absolute quantification, the mean and the SD of U(C) and U(P) were calculated over the set of 10 simulations.
RESULTS
MC Scattering Estimate
To assess the goodness of the proposed method, the scattering distribution estimate was compared with the original scatter projection dataset. Table 1 shows the results of the Student t test of such a comparison for the 3 values of SUR. These results show that the MC-based scatter correction method yields an accurate estimate of the spatial distribution of the scattered events.
Results of Student t Test of Comparison Between Estimated and Nominal Scatter Projection Dataset for 3 Values of SUR
Table 2 compares the number of counts of the estimate and nominal scatter distributions. The number of scatter events diminished slightly as the SUR decreased. A slight underestimation is observed.
Nominal and Estimated Scattered Events for 3 Values of SUR
Table 3 shows the nominal and estimated scatter events obtained at a different number of loops. The scatter estimate did not change significantly as the number of loops increased. Therefore, the scatter estimate in the AQM needs to be generated only once and does not need to be updated.
Nominal and Estimated Scatter Events Obtained at Different Number of Loops in AQM Algorithm for a SUR of 6
Relative Quantification
The results for the mean of the normalized SURs for caudate and putamen (nSUR(P), nSUR(C)) are shown in Figure 3, which indicates the improvement of nSUR as a function of the number of iterations. The different plots correspond to the results for both caudate and putamen ROIs. The iterative reconstruction algorithm included the different corrections described earlier. Filtered backprojection (FBP) results are also plotted as the reference.

Mean of normalized SURs for caudate (A) and putamen (B) as function of number of iterations. Each plot corresponds to results of reconstructed images for a nominal SUR of 6 using filtered backprojection (FBP) or different corrections in quantification method (no corrections, nAnPnS; only attenuation, AnPnS; attenuation and PSF with 2D reconstruction, A2DPnS; attenuation and PSF with 3D reconstruction, A3DPnS; attenuation, PSF with 3D reconstruction, and scattering, A3DPS; all corrections using only primaries, A3DPp). Error bars correspond to 1 SD.
Figure 4 shows the reconstructed images of the 4 central slices at the second iteration of the reconstruction algorithms when different corrections were implemented. There is a change in the aspect of the images when corrections are progressively included. Thus, the inclusion of attenuation compensation (second row) diminishes the differences in the mean value from the periphery to the center, although the image maintains a noisy aspect. The compensation for 2D PSF (third row) increases the signal-to-noise ratio and, hence, the uniformity of the images. This effect is more marked when compensation for 3D PSF (fourth row) is performed or 3D PSF and scatter compensation are performed (fifth row). The bottom row of Figure 4 using the AQM is the most suitable for a direct visual assessment.
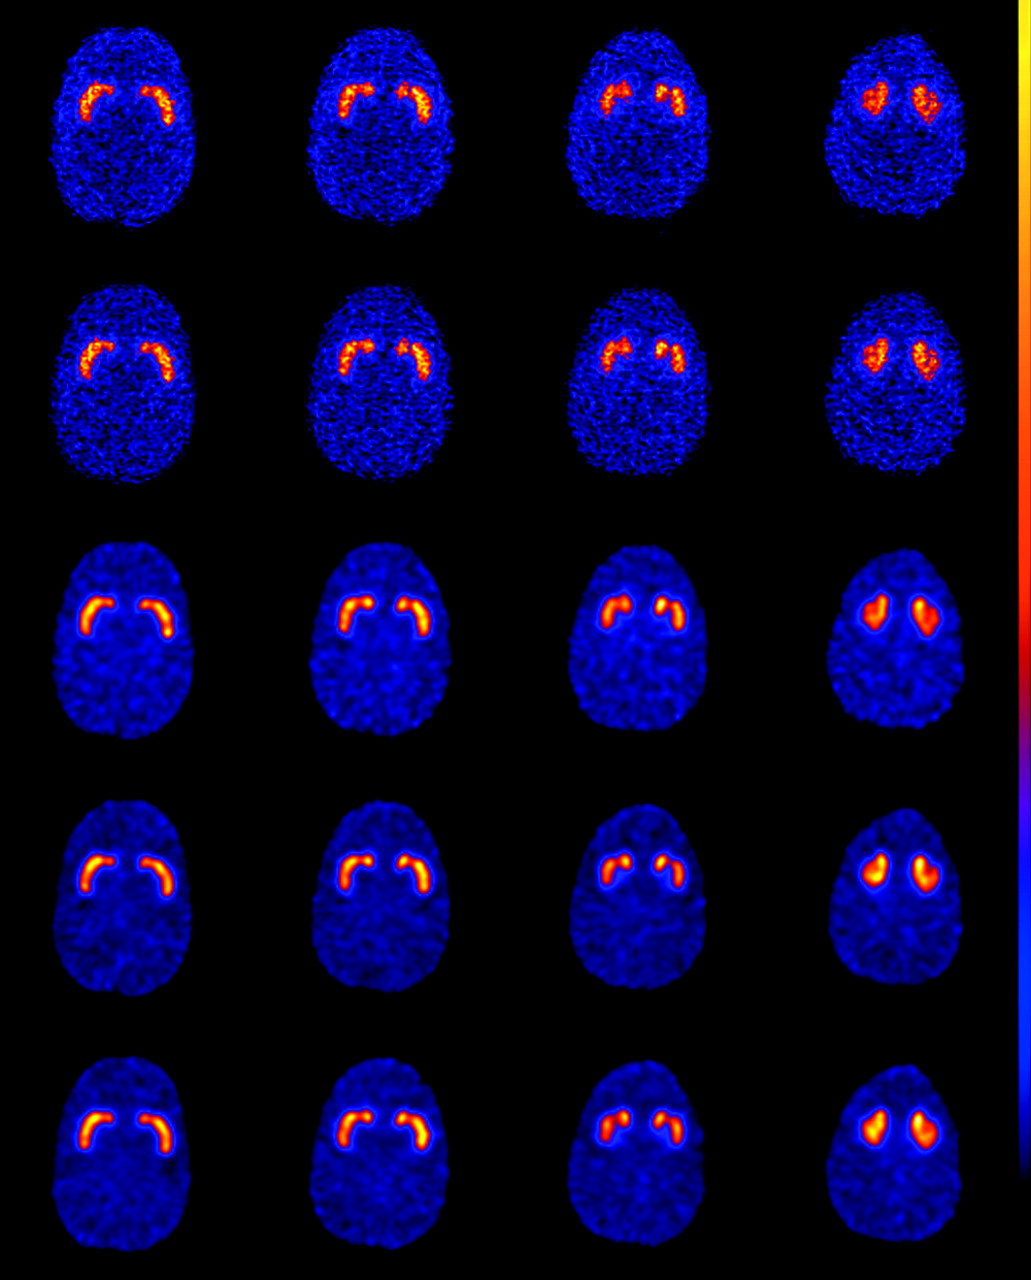
Four reconstructed central slices (from left to right) of striatal virtual phantom with a nominal SUR of 6. Reconstructed images correspond to second iteration with 15 subsets. From top to bottom: 2D reconstruction without corrections (nAnPnS), 2D reconstruction with attenuation correction (AnPnS), 2D reconstruction with attenuation and PSF corrections (A2DPnS), 3D reconstruction with attenuation and PSF corrections (A3DPnS), and, finally, 3D reconstruction with attenuation, PSF, and scatter corrections.
Although a low number of iterations is preferred for a visual assessment, the most accurate quantification results were achieved at a higher number of iterations, as Figure 3 indicates.
Table 4 shows the mean ± SD of nSUR at the 50th iteration in caudate and putamen for a nominal SUR of 6. The results obtained without corrections (nAnPnS) and with different corrections are shown. The correction for all degradations (A3DPS) allowed us to achieve 97% on average of the nominal value for the striatum. This value corresponds to an improvement of 37% with respect to nAnPnS.
Mean ± SD of nSUR at 50th Iteration in Caudate (C) and Putamen (P) for a Nominal SUR of 6
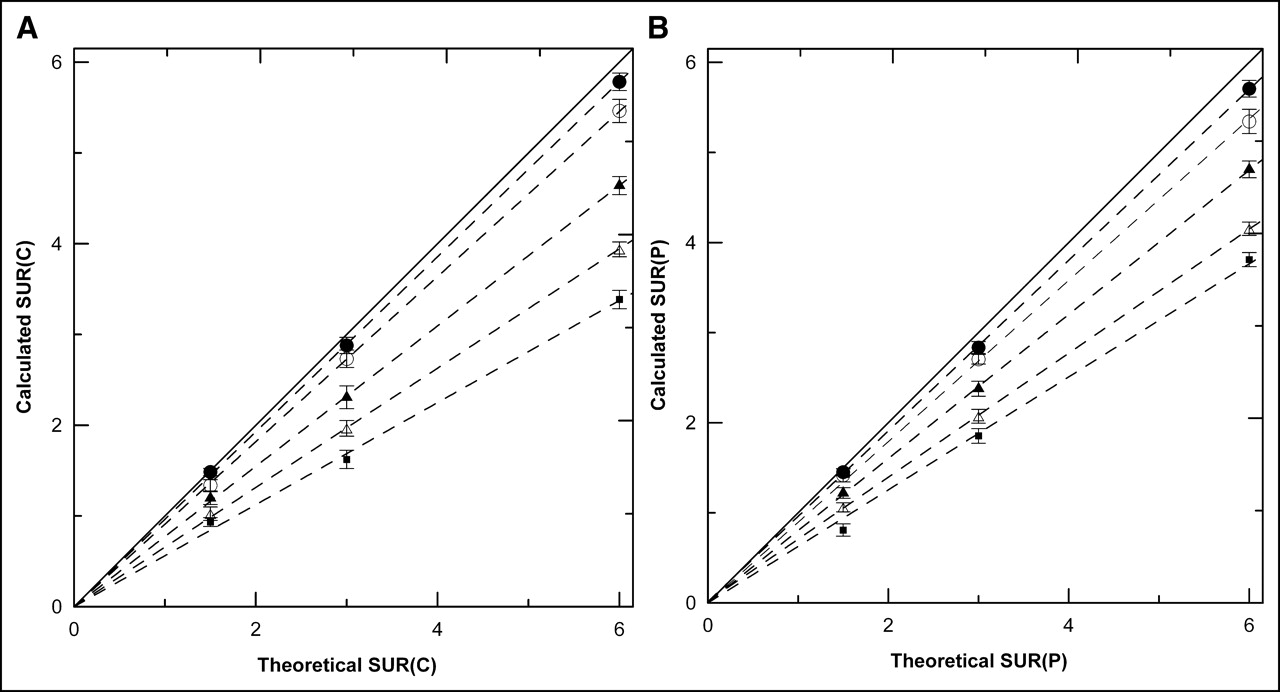
The recovered SUR values at the 50th iteration using different corrections against the nominal SURs are shown in Figure 5. The straight lines correspond to a linear regression crossing the origin of coordinates. We can see the good fit in all cases, with a correlation coefficient ranging from 0.996 to 1.000 for both caudate and putamen.

Calculated SUR for caudate (A) and putamen (B) obtained with different corrections: 2D reconstruction without corrections (nAnPnS, ▪), 2D reconstruction with attenuation correction (A2DnPnS, ▵), 2D reconstruction with attenuation and PSF corrections (A2DPnS, ▴), 3D reconstruction with attenuation and PSF corrections (A3DPnS, ○), and, finally, 3D reconstruction with attenuation, PSF, and scatter corrections (A3DPS, •). Error bars correspond to 1 SD.
Absolute Quantification
As stated earlier, the absolute quantification is possible if the reconstruction algorithm incorporates correction for all degradations involved in the projection process. Figure 6 shows the mean volumetric activity in both caudate and putamen as a function of the iteration number in the AQM. The nominal volumetric activity values in the striatum for each SUR (98, 56, and 35 kBq/mL) and background (14 kBq/mL) are also plotted as horizontal lines for comparison. To facilitate numeric comparison, Table 5 shows the absolute uptake values and the SD in the caudate, putamen, and reference region at the 50th iteration.

Volumetric activity values for caudate (A) and putamen (B) as function of number of iterations for 3 activity distributions. ▵, SUR of 6 and activity distribution of 98:14 kBq/mL (striatal:background); ⋄, SUR of 3 and activity distribution of 56:14 kBq/mL; and ▿, SUR of 1.5 and 35:14 kBq/mL. Horizontal lines represent nominal volumetric activity value. Error bars correspond to 1 SD. Symbols also appear on horizontal straight line representing nominal background (14 kBq/mL) and correspond to calculated background for 3 activity distributions, respectively.
Mean ± SD of Volumetric Activity Corresponding to 3 Activity Distributions
As shown in Figure 6, quantitative results are more accurate at a high number of iterations. Moreover, for low-activity values, the curves converge more rapidly onto the nominal values. These results are in agreement with the fact that the recovery of high-frequency components requires a high number of iterations.
Figure 7 shows the reconstructed images corresponding to 4 central slices at the second iteration for the 3 SURs considered. These reconstructed images were obtained when corrections for all degradations were included. All images were represented using the same absolute colored scale, with a range of colors linked with volumetric activity values (from 0 to 100 kBq/mL).

Reconstructed images using AQM with 2 iterations and 15 subsets for nominal striatal activity of 98 kBq/mL (top), 56 kBq/mL (middle), and 35 kBq/mL (bottom). Background level was 14 kBq/mL. Each color of image is linked with an absolute volumetric activity that ranges from 0 to 100 kBq/mL.
DISCUSSION
Tables 1 and 2 show that the MC-based scatter correction method is sufficiently accurate to reproduce the originalscattering distribution. These results indicate that, to estimate the scatter distribution, the image at the first iteration is suitable as the input activity distribution for SimSET. Nevertheless, a study of the number of iterations should be performed if a neurotransmission system other than the dopaminergic system is to be considered. As for the number of loops, the results in Table 3 indicate that the scatter estimate should be generated only once.
The use of powerful computational solutions is necessary for the implementation of the reconstruction algorithm in clinical routine. On the other hand, the use of variance reduction techniques in the MC simulation is a complementary way to reduce the computational effort. Our MC-based scatter correction does not incorporate the scattering in the collimator/detector system because it is negligible for low-energy isotopes such as 99mTc (31). However, if 123I-radiolabeled compounds were imaged, a modified MC scatter correction should be implemented (35,36).
The iterative reconstruction algorithms provide a reliable correction for both attenuation and PSF. In this work, we also included a MC-based scatter compensation in the reconstruction process. This enabled us to develop the AQM by using a unified formal framework to correct all image degradations. The results in Table 4 show that the value of nSUR improved from 60% for nAnPnS to 97% for A3DPS. The magnitude of the improvement when compensation of degradations was progressively included in reconstruction corresponded to 7% for the attenuation correction (AnPnS), 12% for the PSF correction using a 2D reconstruction algorithm (A2DPnS), a further 11% for the PSF correction using a 3D reconstruction algorithm (A3DPnS), and 7% for the scatter correction (A3DPS). These results indicate that although the correction for attenuation is the most common correction, the spatially variant collimator/detector response plays a major role in the quantification of striatal uptake. The scatter correction plays a similar role in comparison with the attenuation correction.
Figure 4 allows us to visualize the reconstructed images with different corrections implemented in the reconstruction algorithm. Although the low number of iterations is preferred for the visualization of the reconstructed images, the most accurate quantification was achieved at a higher number of iterations (Fig. 3).
The high correlation coefficient between nominal and recovered striatal uptakes for all methods and the near-zero value for the intercept shown in Figure 5 indicate that a reliable relative quantification of SUR may be used in longitudinal studies, regardless of the degradation corrections included in the reconstruction. Nevertheless, when quantitative results between different subjects are compared, corrections for all degradations allow the reduction of differences due to varying head sizes, radius of rotation, or collimator types. The implemented reconstruction algorithm considers all of these variables of the acquisition SPECT protocol and may supply reliable quantification results in multicentric studies.
Figure 6 shows that the convergence of the AQM increases for low striatal uptake values. As the algorithm incorporates more corrections, both the accuracy and the uncertainty are increased. To strike a balance between accuracy and uncertainty, accuracy rather than uncertainty was enhanced in the nSUR calculation. Hence, a higher sensitivity should be expected if the corrections for degradations were implemented in reconstruction.
The results of Figure 7 suggest that a low number of iterations is sufficient to obtain images suitable for visual assessment. Nevertheless, a higher number of iterations is necessary to obtain accurate quantitative results (Fig. 6).
CONCLUSION
Our findings indicate that the PSF correction plays a major role in the quantification of striatal uptake in comparison with the attenuation correction and the scatter correction. The implemented method also provides an absolute quantification procedure based on MC methods that do not depend on empiric approximations. The relative quantification results using the proposed AQM accounted for 96%–97% of the nominal SUR, whereas the limit achieved using only primary photons was 98%–99%. The volumetric activity values obtained using the AQM converged toward the nominal values.
Acknowledgments
This work was supported in part by the Ministerio de Ciencia y Tecnologia (SAF2002-04270-C02-01/02) and Fondo de Investigaciones Sanitarias (PI020485, G03/185, C03/06, PI03/0980).
Footnotes
Received Jan. 11, 2005; revision accepted May 25, 2005.
For correspondence or reprints contact: Domènec Ros, PhD, Unitat de Biofísica i Bioenginyeria, Universitat de Barcelona, C/Casanova 143, 08036 Barcelona, Spain.
E-mail:dros{at}ub.edu
REFERENCES
In this issue


Jump to section
Related Articles
Cited By...
- No citing articles found.