
Main menu

  • Home
  • Content
    • Current
    • Ahead of print
    • Past Issues
    • JNM Supplement
    • SNMMI Annual Meeting Abstracts
    • Continuing Education
    • JNM Podcasts
  • Subscriptions
    • Subscribers
    • Institutional and Non-member
    • Rates
    • Journal Claims
    • Corporate & Special Sales
  • Authors
    • Submit to JNM
    • Information for Authors
    • Assignment of Copyright
    • AQARA requirements
  • Info
    • Reviewers
    • Permissions
    • Advertisers
  • About
    • About Us
    • Editorial Board
    • Contact Information
  • More
    • Alerts
    • Feedback
    • Help
    • SNMMI Journals
  • SNMMI
    • JNM
    • JNMT
    • SNMMI Journals
    • SNMMI

User menu

  • Subscribe
  • My alerts
  • Log in
  • My Cart

Search

  • Advanced search
Journal of Nuclear Medicine
  • SNMMI
    • JNM
    • JNMT
    • SNMMI Journals
    • SNMMI
  • Subscribe
  • My alerts
  • Log in
  • My Cart
Journal of Nuclear Medicine

Advanced Search

  • Home
  • Content
    • Current
    • Ahead of print
    • Past Issues
    • JNM Supplement
    • SNMMI Annual Meeting Abstracts
    • Continuing Education
    • JNM Podcasts
  • Subscriptions
    • Subscribers
    • Institutional and Non-member
    • Rates
    • Journal Claims
    • Corporate & Special Sales
  • Authors
    • Submit to JNM
    • Information for Authors
    • Assignment of Copyright
    • AQARA requirements
  • Info
    • Reviewers
    • Permissions
    • Advertisers
  • About
    • About Us
    • Editorial Board
    • Contact Information
  • More
    • Alerts
    • Feedback
    • Help
    • SNMMI Journals
  • View or Listen to JNM Podcast
  • Visit JNM on Facebook
  • Join JNM on LinkedIn
  • Follow JNM on Twitter
  • Subscribe to our RSS feeds
OtherBasic Science Investigations

Noninvasive Monitoring of Target Gene Expression by Imaging Reporter Gene Expression in Living Animals Using Improved Bicistronic Vectors

Yanling Wang, Meera Iyer, Alexander J. Annala, Steve Chappell, Vincent Mauro and Sanjiv S. Gambhir
Journal of Nuclear Medicine April 2005, 46 (4) 667-674;
Yanling Wang
  • Find this author on Google Scholar
  • Find this author on PubMed
  • Search for this author on this site
Meera Iyer
  • Find this author on Google Scholar
  • Find this author on PubMed
  • Search for this author on this site
Alexander J. Annala
  • Find this author on Google Scholar
  • Find this author on PubMed
  • Search for this author on this site
Steve Chappell
  • Find this author on Google Scholar
  • Find this author on PubMed
  • Search for this author on this site
Vincent Mauro
  • Find this author on Google Scholar
  • Find this author on PubMed
  • Search for this author on this site
Sanjiv S. Gambhir
  • Find this author on Google Scholar
  • Find this author on PubMed
  • Search for this author on this site
  • Article
  • Figures & Data
  • Info & Metrics
  • PDF
Loading

Article Figures & Data

Figures

  • Tables
  • FIGURE 1.
    • Download figure
    • Open in new tab
    • Download powerpoint
    FIGURE 1.

    Schematic representation of imaging reporter gene expression using a SIRES-based bicistronic vector. Diagram illustrates how 2 proteins are expressed from the SIRES vector. Both gene A and gene B are coexpressed from the same vector and expression of gene B (a PET reporter) can be imaged quantitatively by trapping of a PET reporter probe (e.g., 18F-FHBG), which will be an indirect measure of expression of gene A. Pcmv = CMV promoter.

  • FIGURE 2.
    • Download figure
    • Open in new tab
    • Download powerpoint
    FIGURE 2.

    Plot of TK activity in N2a cells after transient transfection using 3 different plasmids (RIT, RST, and SV40-tk). For transfection experiments, 1.8 μg of each plasmid were cotransfected with 0.2 μg of pCMV-βgal into N2a cells in 6-well plates. Forty-eight hours later, cells were harvested and assayed for TK activity. Enzyme activities were normalized to β-gal activities. Error bars represent SE between triplicate samples.
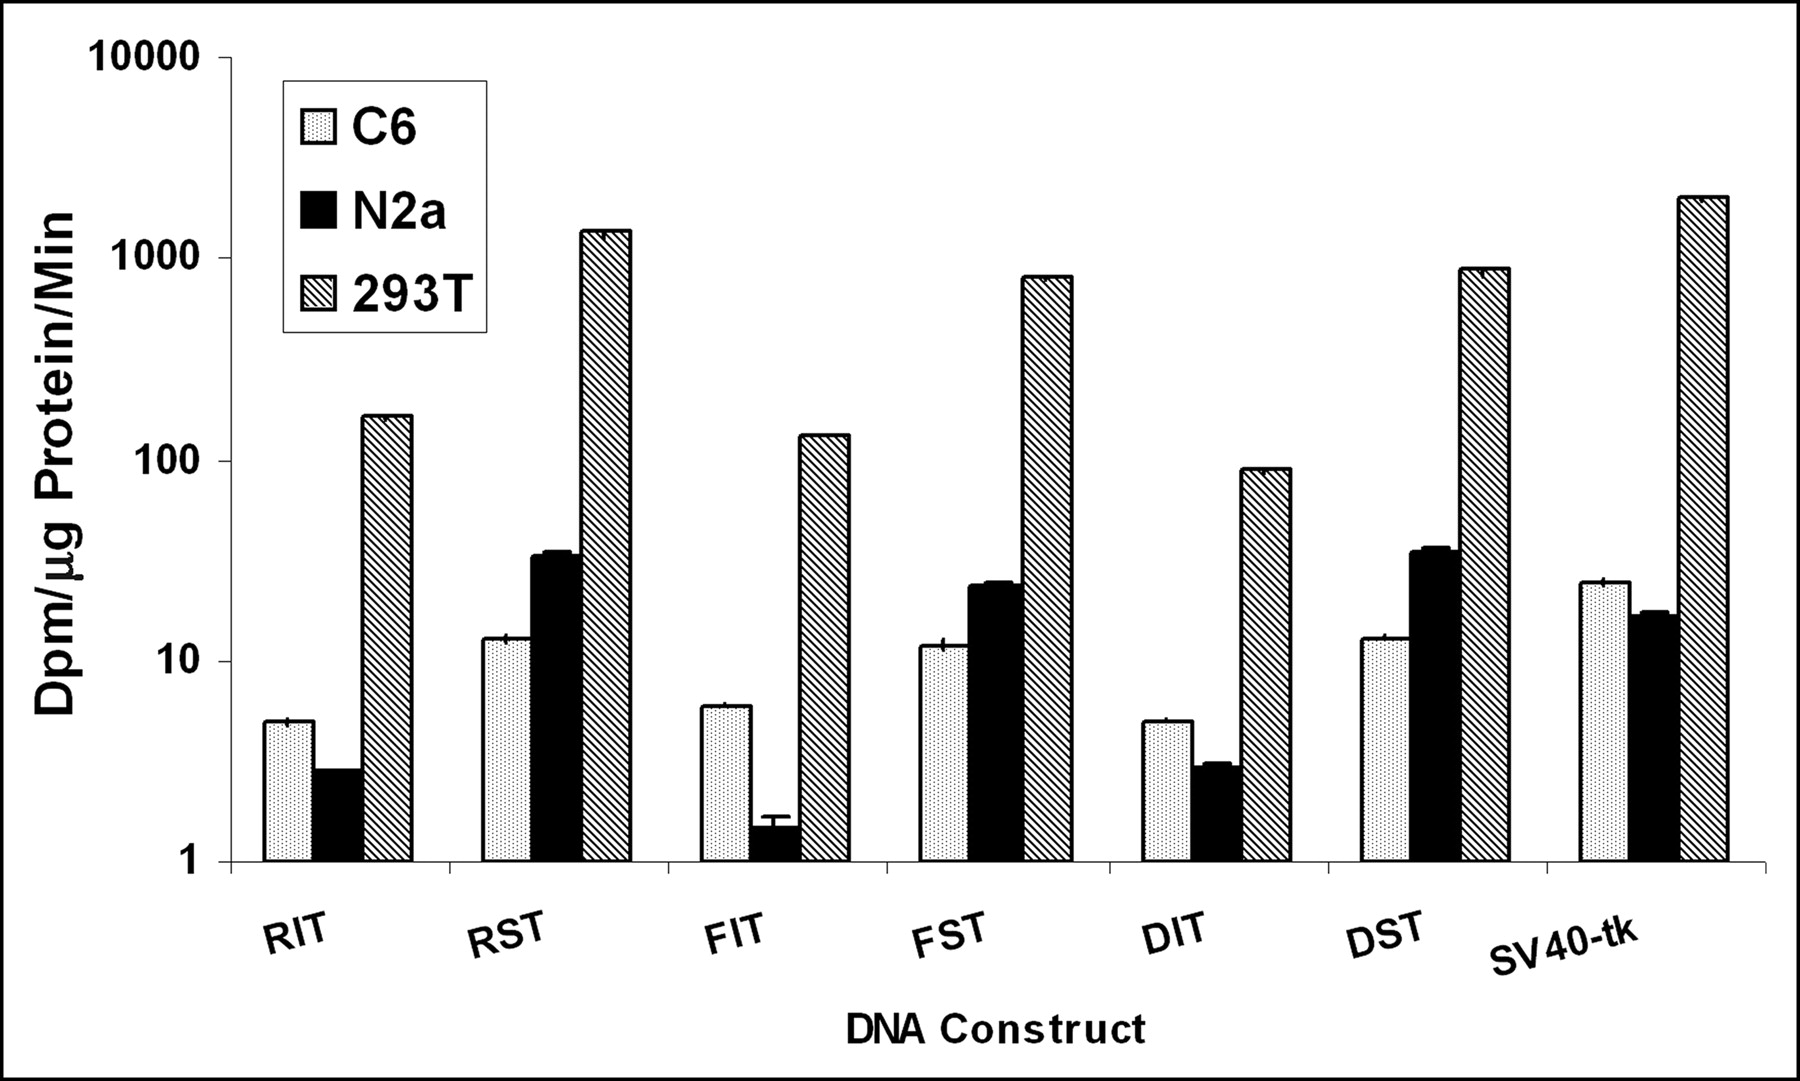
  • FIGURE 3.
    • Download figure
    • Open in new tab
    • Download powerpoint
    FIGURE 3.

    Plot of TK activity in different cell lines. N2a, C6, and 293T cells were transiently transfected with plasmids RIT, RST, FIT, FST, DIT, and DST. Plasmid SV40-tk was used as a positive control. Note that TK activities are represented on a logarithmic scale (based on 100-fold of dpm/μg protein/min). Error bars represent SE between triplicate samples.
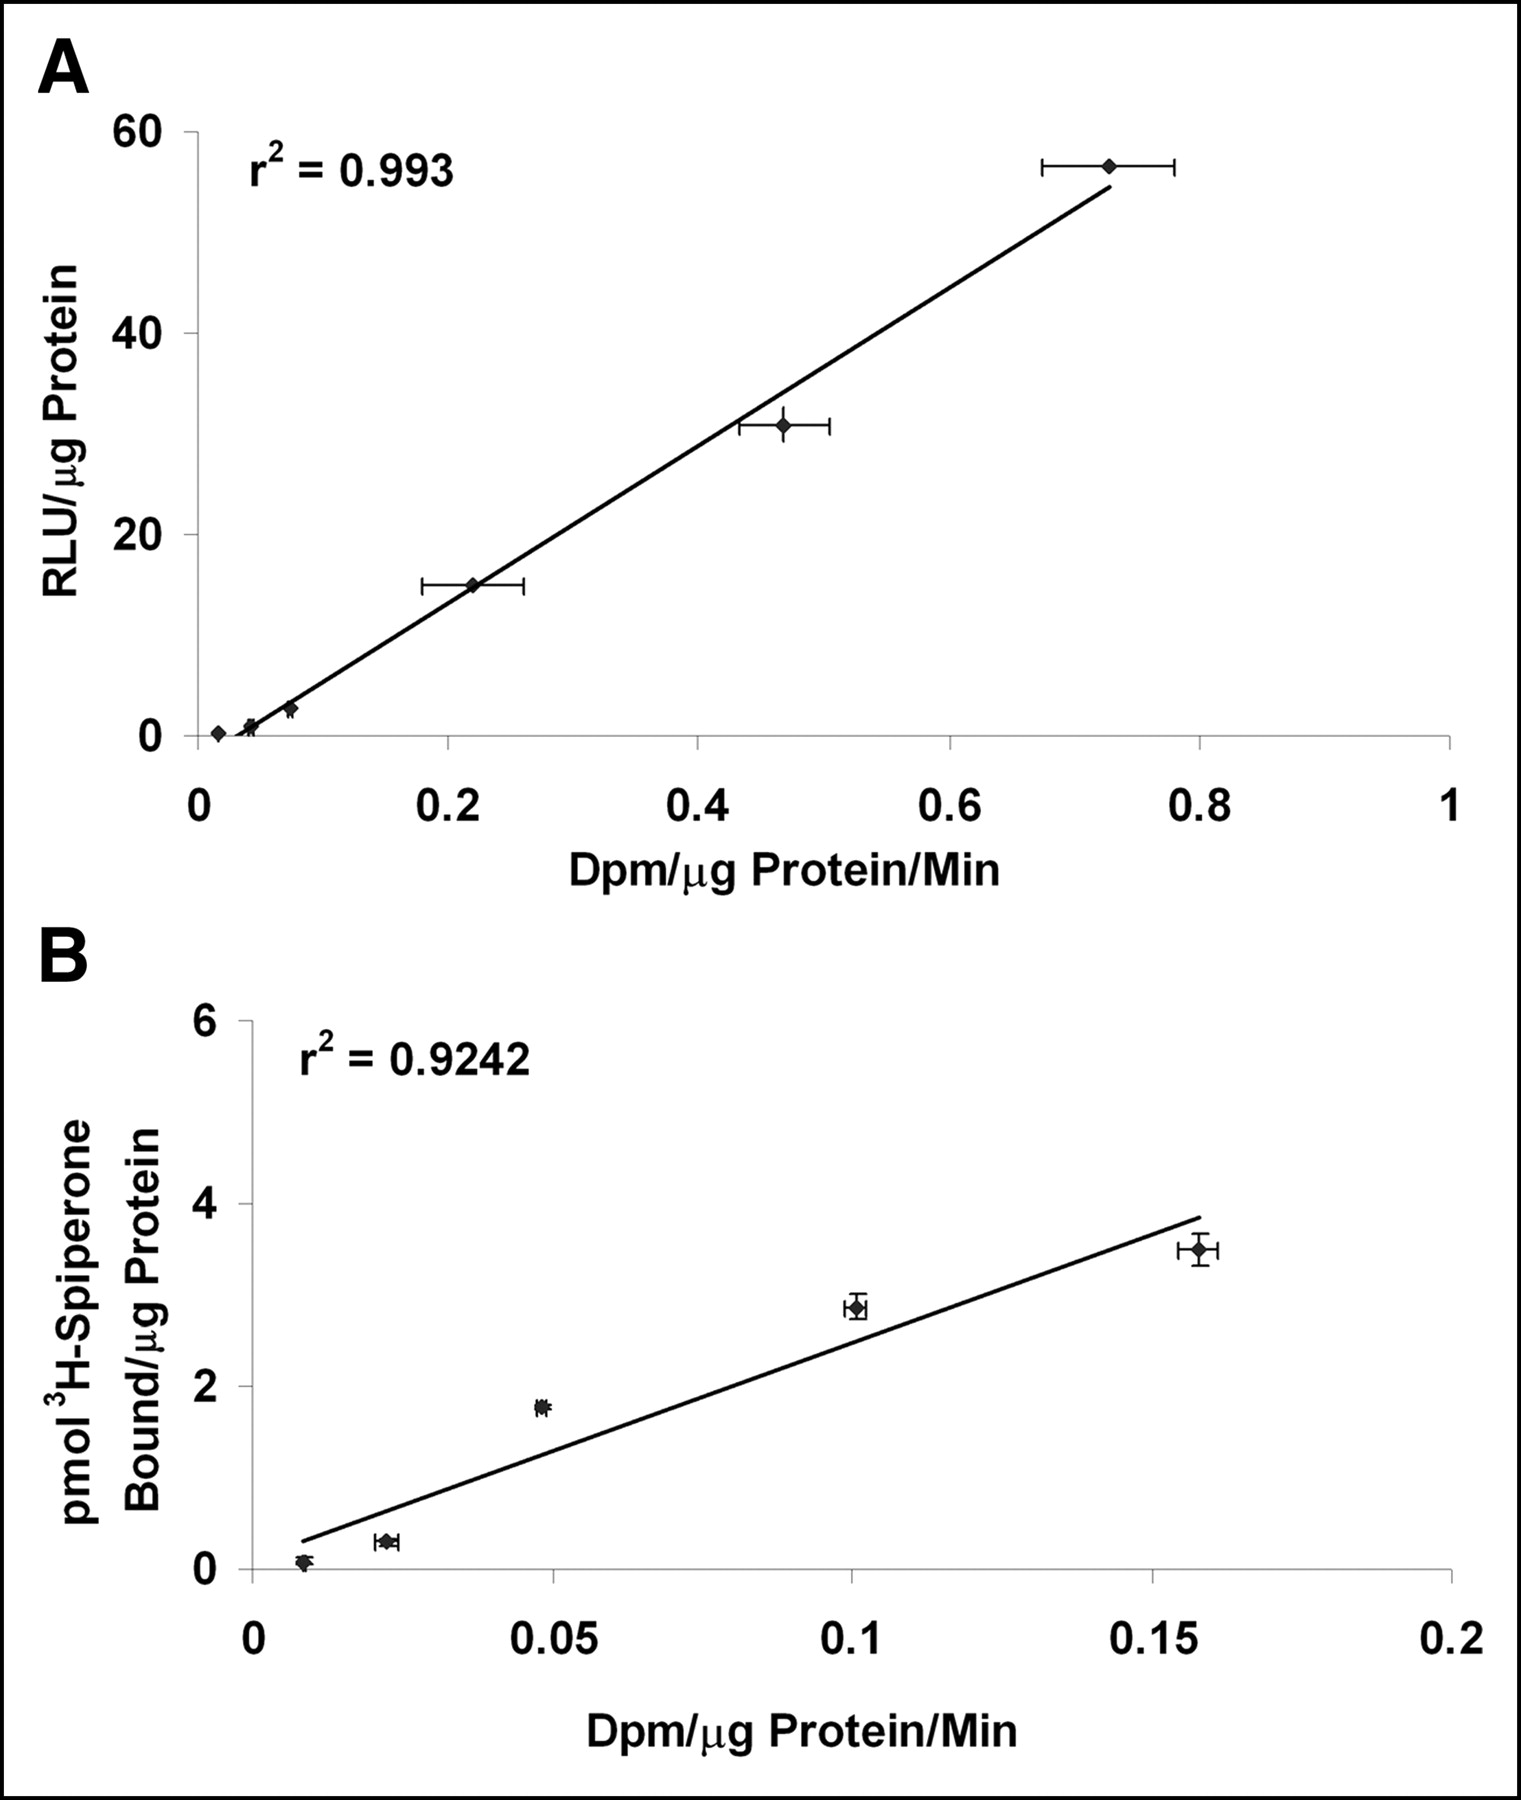
  • FIGURE 4.
    • Download figure
    • Open in new tab
    • Download powerpoint
    FIGURE 4.

    (A) Correlation of RL and TK activities from transient transfection assays in N2a cells. Cells were transfected with different concentrations of RST plasmid (2, 4, 5, 6, 8, and 10 μg). Forty-eight hours later, cells were harvested and assayed for RL and TK activities. RL and TK activities are represented as relative light units (RLU) per μg protein and dpm per μg protein per minute respectively. Error bars represent SE between triplicate observations. (B) Correlation of D2R and TK activities in transient transfection assays. Various amounts (2, 4, 5, 6, 8, and 10 μg) of CDST plasmid were transfected into N2a cells in 10-cm2 dishes. Forty-eight hours later, cells were harvested and assayed for D2R and TK activities. D2R and TK activities are represented as picomoles of 3H-spiperone bound per μg of protein and dpm per μg protein per minute, respectively.
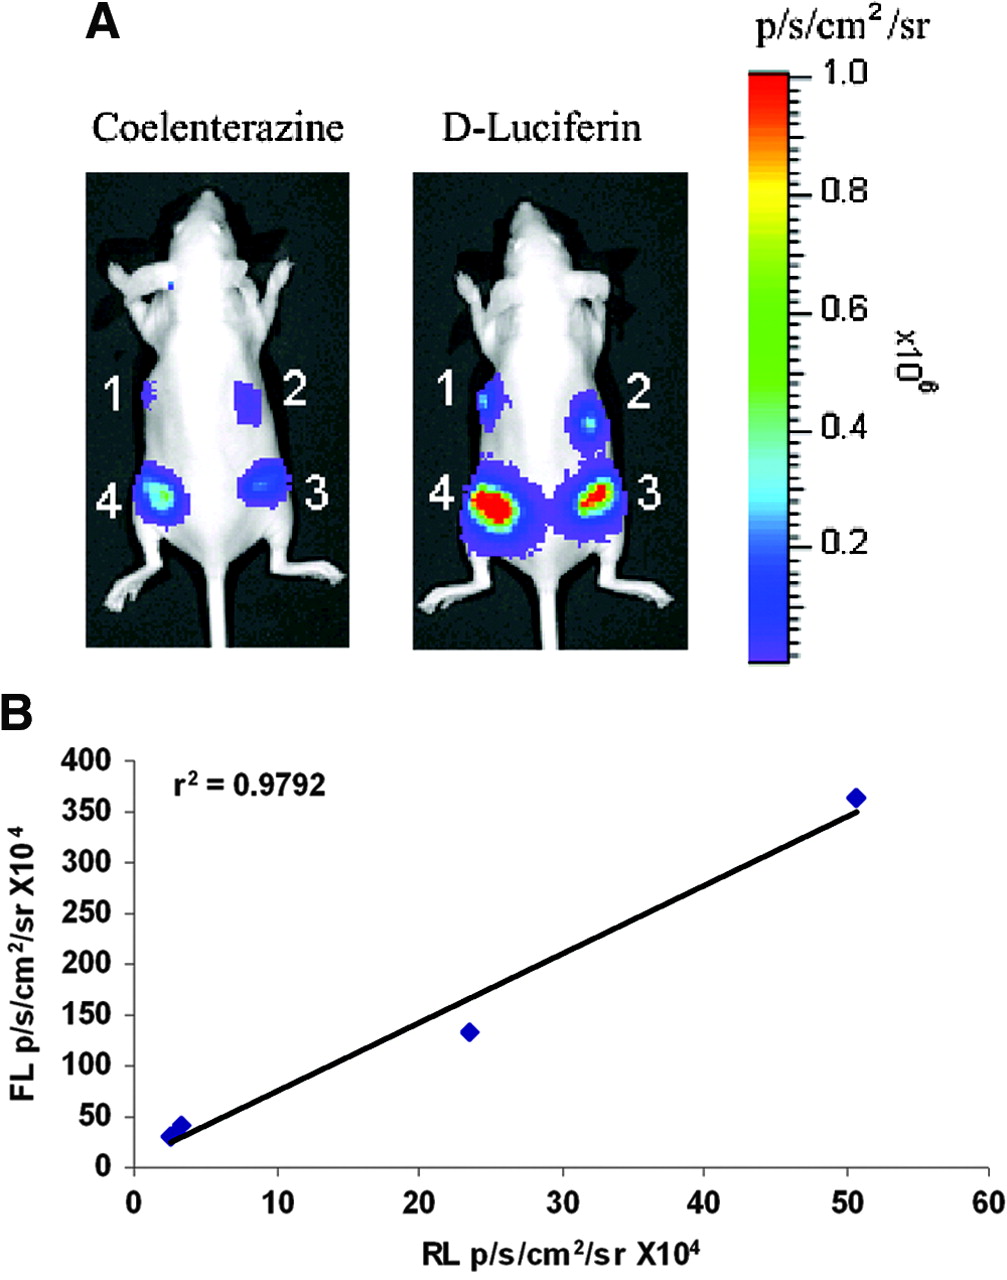
  • FIGURE 5.
    • Download figure
    • Open in new tab
    • Download powerpoint
    FIGURE 5.

    (A) Optical imaging of rl and fl reporter gene expression in vivo. Six-week old nude mice were implanted with 4 stably transfected N2a cell lines carrying RSF vector (with different levels of gene expression). Mice were imaged in CCD camera for rl expression immediately after cell implantation using coelenterazine (2 μg). Subsequent imaging was performed for fl expression using d-luciferin injected intraperitoneally (150 mg/kg). Signal intensity is represented as photons/s/cm2/sr. (B) Correlation of RL and FL activities in stably transfected N2a cells. RLU for rl are plotted against corresponding light units for fl in the 4 N2a cell lines. Expression of the 2 reporter genes shows excellent correlation (r2 = 0.98).
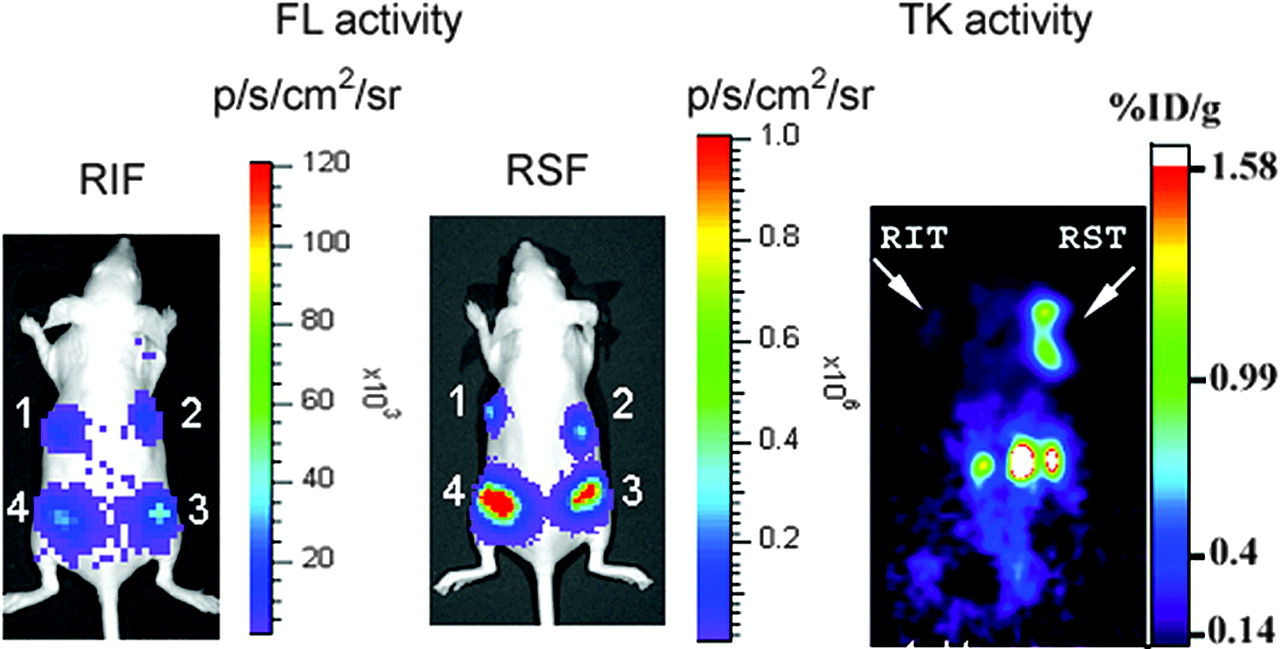
  • FIGURE 6.
    • Download figure
    • Open in new tab
    • Download powerpoint
    FIGURE 6.

    Optical and microPET imaging of fl and tk gene expression in vivo. For optical imaging of fl reporter gene expression, nude mice implanted with 4 different N2a cell lines (RIF, left panel; RSF, middle panel) were imaged in CCD camera immediately after cell implantation using d-luciferin (150 mg/kg). For tk gene imaging, nude mice carrying N2a tumor xenografts (RIT and RST on left and right shoulders, respectively; right panel) were imaged by microPET using 18F-FHBG (74 kBq [200 μCi]). SIRES xenograft shows significantly higher retention of reporter when compared with EMCV IRES xenograft (0.88 vs. 0.13 %ID/g tumor, respectively).

Tables

  • Figures
    • View popup
    TABLE 1

    IRES- and SIRES-Containing Plasmid Vectors Carrying Different Reporter Genes Used in This Study

    PlasmidpGL3 backbone
    1SV40-rl-IRES-tk (RIT)
    2SV40-rl-SIRES-tk (RST)
    3SV40-fl-IRES-tk (FIT)
    4SV40-fl-SIRES-tk (FST)
    5SV40-D2R-IRES-tk (DIT)
    6SV40-D2R-SIRES-tk (DST)
    7SV40-tk
    8SV40-fl (pGL3 control)
    9SV40-rl
    10SV40-D2R
    11CMV-D2R-IRES-tk (CDIT)
    12CMV-D2R-SIRES-tk (CDST)
    13CMV-D2R
    14CMV-tk
    15SV40-rl-IRES-fl (RIF)
    16SV40-rl-SIRES-fl (RSF)
    pcDNA3.1 backbone
    17CMV-D2R
    18CMV-tk
    19CMV-D2R-SIRES-tk
    • View popup
    TABLE 2

    FL, RL, D2R, and TK Enzyme Activities in N2a Cells Transiently Transfected with Different Bicistronic Constructs Carrying EMCV IRES and SIRES Modules

    PlasmidpGL3 backboneTKD2RRLFL
    1SV40-rl-IRES-tk (RIT)0.0288.8
    2SV40-rl-SIRES-tk (RST)0.33958.7
    3SV40-fl-IRES-tk (FIT)0.01550.3
    4SV40-fl-SIRES-tk (FST)0.23496.9
    5SV40-D2R-IRES-tk (DIT)0.030.3
    6SV40-D2R-SIRES-tk (DST)0.3430.5
    7SV40-tk0.165
    8SV40-fl62.4
    9SV40-rl21.3
    10SV40-D2R0.2
    • Plasmids SV40-tk, SV40-D2R, SV40-rl, and SV40-fl were used as control vectors in transfections. FL and RL activities are expressed as RLU/μg protein. Units of D2R activity are pmol 3H-spiperone bound/μg protein. TK activity is in units of dpm/mg protein/min. All enzyme activities were normalized to β-gal activity in each sample.

    • View popup
    TABLE 3

    D2R and TK Activities in N2a Cells Transfected with Constructs Carrying CMV and SV40 Promoters

    PlasmidpGL3 backboneTKD2R
    5SV40-D2R-IRES-tk (DIT)0.030.3
    6SV40-D2R-SIRES-tk (DST)0.3430.5
    11CMV-D2R-IRES-tk (CDIT)0.02950.5
    12CMV-D2R-SIRES-tk (CDST)0.2973.7
    13CMV-D2R58.1
    14CMV-tk2.535
PreviousNext
Back to top

In this issue

Journal of Nuclear Medicine: 46 (4)
Journal of Nuclear Medicine
Vol. 46, Issue 4
April 1, 2005
  • Table of Contents
  • About the Cover
  • Index by author
Print
Download PDF
Article Alerts
Sign In to Email Alerts with your Email Address
Email Article

Thank you for your interest in spreading the word on Journal of Nuclear Medicine.

NOTE: We only request your email address so that the person you are recommending the page to knows that you wanted them to see it, and that it is not junk mail. We do not capture any email address.

Enter multiple addresses on separate lines or separate them with commas.
Noninvasive Monitoring of Target Gene Expression by Imaging Reporter Gene Expression in Living Animals Using Improved Bicistronic Vectors
(Your Name) has sent you a message from Journal of Nuclear Medicine
(Your Name) thought you would like to see the Journal of Nuclear Medicine web site.
Citation Tools
Noninvasive Monitoring of Target Gene Expression by Imaging Reporter Gene Expression in Living Animals Using Improved Bicistronic Vectors
Yanling Wang, Meera Iyer, Alexander J. Annala, Steve Chappell, Vincent Mauro, Sanjiv S. Gambhir
Journal of Nuclear Medicine Apr 2005, 46 (4) 667-674;

Citation Manager Formats

  • BibTeX
  • Bookends
  • EasyBib
  • EndNote (tagged)
  • EndNote 8 (xml)
  • Medlars
  • Mendeley
  • Papers
  • RefWorks Tagged
  • Ref Manager
  • RIS
  • Zotero
Share
Noninvasive Monitoring of Target Gene Expression by Imaging Reporter Gene Expression in Living Animals Using Improved Bicistronic Vectors
Yanling Wang, Meera Iyer, Alexander J. Annala, Steve Chappell, Vincent Mauro, Sanjiv S. Gambhir
Journal of Nuclear Medicine Apr 2005, 46 (4) 667-674;
Twitter logo Facebook logo LinkedIn logo Mendeley logo
  • Tweet Widget
  • Facebook Like
  • Google Plus One
Bookmark this article

Jump to section

  • Article
    • Abstract
    • MATERIALS AND METHODS
    • RESULTS
    • DISCUSSION
    • CONCLUSION
    • Acknowledgments
    • Footnotes
    • REFERENCES
  • Figures & Data
  • Info & Metrics
  • PDF

Related Articles

  • THIS MONTH IN JNM
  • PubMed
  • Google Scholar

Cited By...

  • Introducing Genes into Mammalian Cells: Viral Vectors
  • Circumventing Recombination Events Encountered with Production of a Clinical-Grade Adenoviral Vector with a Double-Expression Cassette
  • Google Scholar

More in this TOC Section

  • Tumor-Specific Binding of Radiolabeled PEGylated GIRLRG Peptide: A Novel Agent for Targeting Cancers
  • PET/MRI of Hypoxic Atherosclerosis Using 64Cu-ATSM in a Rabbit Model
  • Tumor Uptake of Anti-CD20 Fabs Depends on Tumor Perfusion
Show more Basic Science Investigations

Similar Articles

SNMMI

© 2025 SNMMI

Powered by HighWire