


Abstract
Pretargeted radioimmunotherapy (RIT) using CC49 fusion protein, comprised of CC49-(scFv)4 and streptavidin, in conjunction with 90Y/111In-DOTA-biotin (DOTA = dodecanetetraacetic acid) provides a new opportunity to improve efficacy by increasing the tumor-to-normal tissue dose ratio. To our knowledge, the patient-specific dosimetry of pretargeted 90Y/111In-DOTA-biotin after CC49 fusion protein in patients has not been reported previously. Methods: Nine patients received 3-step pretargeted RIT: (a) 160 mg/m2 of CC49 fusion protein, (b) synthetic clearing agent (sCA) at 48 or 72 h later, and (c) 90Y/111In-DOTA-biotin 24 h after the sCA administration. Sequential whole-body 111In images were acquired immediately and at 2–144 h after injection of 90Y/111In-DOTA-biotin. Geometric-mean quantification with background and attenuation correction was used for liver and lung dosimetry. Effective point source quantification was used for spleen, kidneys, and tumors. Organ and tumor 90Y doses were calculated based on 111In imaging data and the MIRD formalism using patient-specific organ masses determined from CT images. Patient-specific marrow doses were determined based on radioactivity concentration in the blood. Results: The 90Y/111In-DOTA-biotin had a rapid plasma clearance, which was biphasic with <10% residual at 8 h. Organ masses ranged from 1,263 to 3,855 g for liver, 95 to 1,009 g for spleen, and 309 to 578 g for kidneys. The patient-specific mean 90Y dose (cGy/37 MBq, or rad/mCi) was 0.53 (0.32–0.78) to whole body, 3.75 (0.63–6.89) to liver, 2.32 (0.58–4.46) to spleen, 7.02 (3.36–11.2) to kidneys, 0.30 (0.09–0.44) to lungs, 0.22 (0.12–0.34) to marrow, and 28.9 (4.18–121.6) to tumors. Conclusion: Radiation dose to normal organs from circulating radionuclide is substantially reduced using pretargeted RIT. Tumor-to-normal organ dose ratios were increased about 8- to 11-fold compared with reported patient-specific mean dose to liver, spleen, marrow, and tumors from 90Y-CC49.
Metastatic or recurrent gastrointestinal (GI) cancer is a common cause of morbidity and mortality in the United States. If not cured by surgery, chemotherapy regimens produce, at best, modest effects on survival. Once failure occurs with first-line chemotherapy, further attempts at chemotherapy produce minimal benefits and survival is about 3–9 mo. Radiotherapy has a limited local control, palliative role in a small group of patients. Therefore, innovative therapies are needed for metastatic or recurrent GI cancer.
Radioimmunotherapy (RIT) is one innovative approach that systemically delivers localized radiation through an antibody directed to a tumor-associated antigen. Encouraging results have been obtained in RIT for lymphoma (1–4). However, the effect of RIT on metastatic or recurrent GI cancer has been disappointing. Prior phase I and phase II studies with the CC49 antibody have generally shown localization of radiolabeled antibodies to tumor sites but with insufficient radiation delivery to produce objective tumor regression (5–9). The efficacy of radiolabeled antibodies for GI cancer, in general, has been limited by several factors, including (a) slow accumulation at tumor sites, (b) relatively slow clearance from the blood, and (c) radioresistance of the tumors. Consequently, although tumors receive insufficient radiation for an objective response, the radiation dose to radiosensitive normal organs has already exceeded the maximum tolerable limit.
The pretargeted RIT (Pretarget RIT; NeoRx Corp.) system has been developed to address 2 of these factors (10–16). Because a targeting molecule administered first is not radiolabeled, the pretargeted RIT system does not suffer from prolonged radiation to normal organs due to slow accumulation at tumor sites. Since the radionuclide is delivered later on a small molecule (<1 kDa) that is rapidly excreted through the kidneys, radiation dose to normal organs from circulating radionuclide is substantially reduced. Thus, tumor-to-normal organ dose ratios are expected to improve by this approach.
We have conducted a phase I trial using pretargeted CC49 fusion protein. The CC49 fusion protein is a genetic fusion of the single-chain variable region (scFv) of the murine antibody that targets TAG-72 and streptavidin (SA). Expression results in spontaneous folding into a tetramer containing 4 scFv of CC49 and the 4 subunits of SA. After pretargeting with CC49 fusion protein and use of synthetic clearing agent (sCA) to clear unbound fusion protein, 111In/90Y-DOTA-biotin (DOTA = dodecanetetraacetic acid) was injected to deliver 90Y radiation to tumor sites. To our knowledge, this is the first study to determine the tissue distribution of 90Y/111In-DOTA-biotin after CC49 fusion protein by quantitative imaging and to report its radiation dosimetry for tumors and normal organs.
MATERIALS AND METHODS
Patients
Nine patients with previously treated metastatic colorectal cancer were enrolled in this study. These patients had failed at least 1 and no more than 3 prior therapy regimens. All patients had measurable tumors that were TAG-72 positive (>30% of cells) on immunoperoxidase staining, and patients had a negative antibody response to CC49 fusion protein. The median age was 58 y (range, 53–78 y).
Pretargeting Components
The 3 steps of administering the pretargeting components have been previously described (11,12). The first of 3 steps involves the injection of the CC49 fusion protein that targets TAG-72. After allowing peak CC49-(scFv)4SA levels to accrete at the tumor, a synthetic biotin galactosamine clearing agent (sCA), is injected to remove unbound CC49-(scFv)4SA from the circulation. Finally, DOTA-biotin radiolabeled with 90Y/111In is injected and distributes rapidly throughout the vascular and extravascular space. All components were manufactured, tested, and released by NeoRx Corp. to the University of Alabama at Birmingham. Doses of the components and intervals between them were guided by preclinical studies and prior clinical trials of pretargeted RIT (10–16). All patients received 160 mg/m2 of CC49-(scFv)4SA. The sCA was administered either 48 or 72 h after CC49-(scFv)4SA at a dose of 45 mg/m2. The third component, 90Y/111In-DOTA-biotin, was then administered 24 h after the sCA at a dose of 0.65 or 1.3 mg/m2 (Table 1). All patients received 185 MBq (5 mCi) 111In-labeled DOTA-biotin for imaging and dosimetry purposes, and patients 4–9 also received 370 MBq/m2 (10 mCi/m2) of 90Y at the same time.
Patient Cohorts in the Trial
Quantification of 90Y/111In in Serum
Blood samples were collected before, at 5, 15, and 30 min, and at 1, 2, 4, 6, 8, 12, 24, 48, and 72 h after the administration of the radiolabeled DOTA-biotin. The 90Y dose to marrow for patients 1–3 was derived from 111In, and 111In activity was measured using a γ-well counter. The 90Y in serum for patients 4–9 was directly measured using liquid scintillation counting. The activities of 90Y- and 111In-DOTA-biotin were corrected for decay of the radioisotope from the time of drug administration to the time of measurement by counting the samples and the standards at the same time. 90Y- and 111In-DOTA-biotin concentration was expressed as percentage injected dose per milliliter (%ID/mL) and analyzed using a biexponential clearance (α and β) model. Patients 4–9 had both 90Y and 111In concentrations measured. To compare the similarity between 90Y and 111In concentrations, mean weighted %ID/mL was computed to average all sample time points:
 Eq. 1 where i is ith sample time point, wi is the weight at i point, and wi equals (%ID/mL)i/Σ(%ID/mL)i.
Quantitative Imaging
Planar conjugate whole-body images were acquired with a Philips dual-detector γ-camera interfaced to a nuclear medicine computer system (Philips Medical System). The detectors had a  -in.-thick (19 mm) NaI(Tl) crystal. Medium-energy collimators were used to image 111In with energy windows centered at 171 and 245 keV (15% width). Transmission scan images were obtained using a 57Co sheet source containing about 370 MBq (10 mCi). The same medium-energy collimators were used to image 57Co with an energy window centered at 122 keV (15% width).
Phantom Study.
To determine attenuation correction factors for the dual-detector γ-camera, 3 plastic bottles containing 50, 150, and 1,570 mL of 111In solution were used to simulate tumor, kidney/spleen, and liver, respectively. Liver was quantified using geometric-mean quantification (17), and an attenuation correction factor was determined by flood transmission scan. Transmission images were acquired with the liver phantom 111In solution placed on solid water blocks of various thickness (2–24 cm). Transmission fractions were determined by comparing counts in the liver phantom region of interest (ROI) with and without solid water blocks. 57Co flood transmission images were also acquired with 2- to 24-cm solid water blocks. The liver phantom ROI defined from the 111In image was transferred to define the ROI for the 57Co images. Transmission fractions of 57Co counts were determined by comparing counts in the ROI with and without solid water blocks. Effective linear attenuation coefficients, μ57Co and μ111In, were determined from these transmission fractions.
Since previous studies suggested that geometric-mean quantification was accurate only for a large source that was visible on both conjugate views, attenuation correction factors for kidney, spleen, and tumor were determined by the effective point source method (18). Attenuation correction factors for relatively small sources were determined using 50- and 150-mL 111In sources placed on solid water blocks. Transmission fractions were determined by comparing counts in the source ROI with and without the blocks of various thickness (2–24 cm).
Patient Studies.
Planar conjugate views of the whole body were acquired immediately after administration of 90Y/111In-DOTA-biotin and at 2, 24, 48, and 120 or 144 h. Whole-body images were acquired in a 256 × 1,024 word matrix with a scan speed of 8–10 cm/min. Each patient’s position on the imaging table and vertical positions of the camera detectors were recorded in the first imaging session and were used throughout the sequential imaging studies for reproducible detector-to-patient positioning. A 20-mL 111In reference source containing 1.9–3.7 MBq (50–100 μCi) was placed on the imaging table at least 10 cm away from the patient’s feet. The number of counts from this reference source was used to convert the counts in the tissue ROI to radioactivity in the tissue.
Before processing images, the operator reviewed the medical record, CT report, and CT images with the physicians for organ and tumor ROI determination. Major organs that were visible above body background after clearance of the blood pool were quantified. Although tumors were visible for each patient, tumors were quantified only if they met the following criteria for adequate accuracy: (a) ≥1 cm in diameter, (b) tumor-to-background pixel counts ratio of ≥1.5 (19), and (c) clear tumor ROI boundary. Some liver tumor masses were diffusely distributed and were excluded from image quantification. If a liver tumor appeared as a single mass (ROI) on γ-camera images but appeared as a group of several adjacent masses within the ROI on CT images, tumor mass was determined by excluding the portion of normal liver within the ROI on CT images.
Counts in ROIs were background corrected to subtract counts contributed from radioactivity in the background volume. Background ROIs were selected in regions of the body that had a thickness equivalent to that of the overlapping background volume for the organ or tumor for background ROI subtraction. Special attention was given to background subtraction for liver tumors because the tumors overlapped normal liver and soft-tissue background volumes. Two background ROIs were determined: one outside the liver and one adjacent to the tumor inside the liver. The thickness of the body background ROI outside the liver, the thickness of the liver ROI next to the tumor, and the thickness of the body soft tissue that overlapped with the tumor ROI and liver ROI were measured from CT for each liver tumor. These measurements were used to adjust the counts contributed from overlapped liver and soft-tissue background volumes.
The geometric-mean quantification was used to determine activities in the liver and lungs. The attenuation correction factor, ACF, was determined by:
 Eq. 2 where Npt and Nno pt are liver ROI counts in 57Co transmission images with and without the patient, and μ57Co,liver/lungs and μ111In,liver/lungs are determined experimentally from the liver phantom studies described. For kidneys, spleen, and tumor dosimetry, 111In photon attenuation was corrected using measured μ111In values determined from the 150- and 50-mL phantom studies. The depth of kidneys, spleen, and tumors from the body surface were measured from CT images.
Uptake of 90Y/111In in organs and tumors was expressed as the percentage of injected dose (%ID) at various imaging time points. The cumulated activity and biologic clearance half-life (tb1/2) were determined by fitting the uptake data with a monoexponential curve. If fit of a monoexponential curve was not possible, as uptake data continuously increased during the period of sequential imaging, cumulated activity was determined using the trapezoid method and a conservative estimation of the tail was used with a clearance rate of the physical half-life. For dosimetry purposes, the cumulated activity of 90Y was determined from the biodistribution of 111In and adjusted for the small difference in the physical half-life between 111In and 90Y.
Patient-Specific Radiation Dosimetry
Patient-specific radiation doses to organs and tumors were calculated based on the MIRD formalism (20):
 Eq. 3 where à is the cumulated activity determined by the image quantification; φ is the absorbed fraction for each energy deposition; Δ is the total equilibrium dose constant, mean energy emitted per nuclear transition, for each energy; and m is the patient-specific target mass. 90Y is a pure, long-range β-emitter with an x90 (distance from the source within which 90% of the energy is absorbed) of 5.2 mm (21). The radiation absorbed fraction for each organ and tumor mass was interpolated using data of Siegel and Stabin (22), except for bone marrow.
Organ and tumor masses, except for bone marrow, were determined from CT images 1–2 wk before radioactivity administration. All patients had CT images of the chest, abdomen, and pelvis with a slice thickness of 5 mm. CT images were digitized using a high-resolution film scanner (Vidar System Co.) or imported directly through a DICOM (Digital Imaging and Communications in Medicine) network. Tissue volumes were determined using software developed in-house on the Interactive Data Language platform (Research Systems). Organ or tumor ROIs were drawn on each transverse slice. The area of each ROI was multiplied by the slice thickness to obtain the volume of interest in that slice. Total volume was then obtained by summing all volumes of interest (23).
Because patient-specific marrow dose from β-emissions in the blood does not require an explicit estimate of marrow mass, radiation dose was determined by (24):
 Eq. 4 where Δ90Y = 1.49E−13 Gy-kg/Bq-s (25); φ90Y (RM←RM) = 0.65 (26); RMBLR (red marrow-to-blood concentration ratio) = 0.75 assuming a value between that of intact antibody and free radionuclides for the small molecular weight of DOTA-botin/CC49-(scFv)4SA; and Cblood is the concentration of cumulated radioactivity measured in the blood.
For organs that were not clearly visible, radiation doses were calculated using the remainder of the body:
 Eq. 5 where ÃRB or mRB is the cumulated activity or the mass of the remainder of the body determined by subtraction of organ activities or masses from that of the total body, respectively.
For comparison, standard radiation dose estimates were also calculated using MIRD Pamphlet No. 11 (26) based on Reference Man’s phantom data, which generate results similar to those using the MIRDOSE III program (27).
RESULTS
Quantification of 90Y/111In in Serum
With most elimination through the urine, <10% of the injected 90Y/111In-DOTA-biotin remained in the circulation after 8 h. The biphasic serum clearance curve of 90Y/111In-DOTA-biotin is illustrated in Figure 1. The concentration of 90Y- DOTA-biotin in serum quickly dropped below 0.002 %ID/mL about 2 h after injection of 90Y-DOTA-biotin. The range (minimum to maximum) of variation among 9 patients was modest (Table 2). The α-clearance phase, accounting for 90% of the dose, had a mean biologic half-life of 0.5 h, with a mean intercept of 0.0075 %ID/mL. The β-clearance phase had a mean biologic half-life of 18.3 h and a mean intercept of 0.0012 %ID/mL.
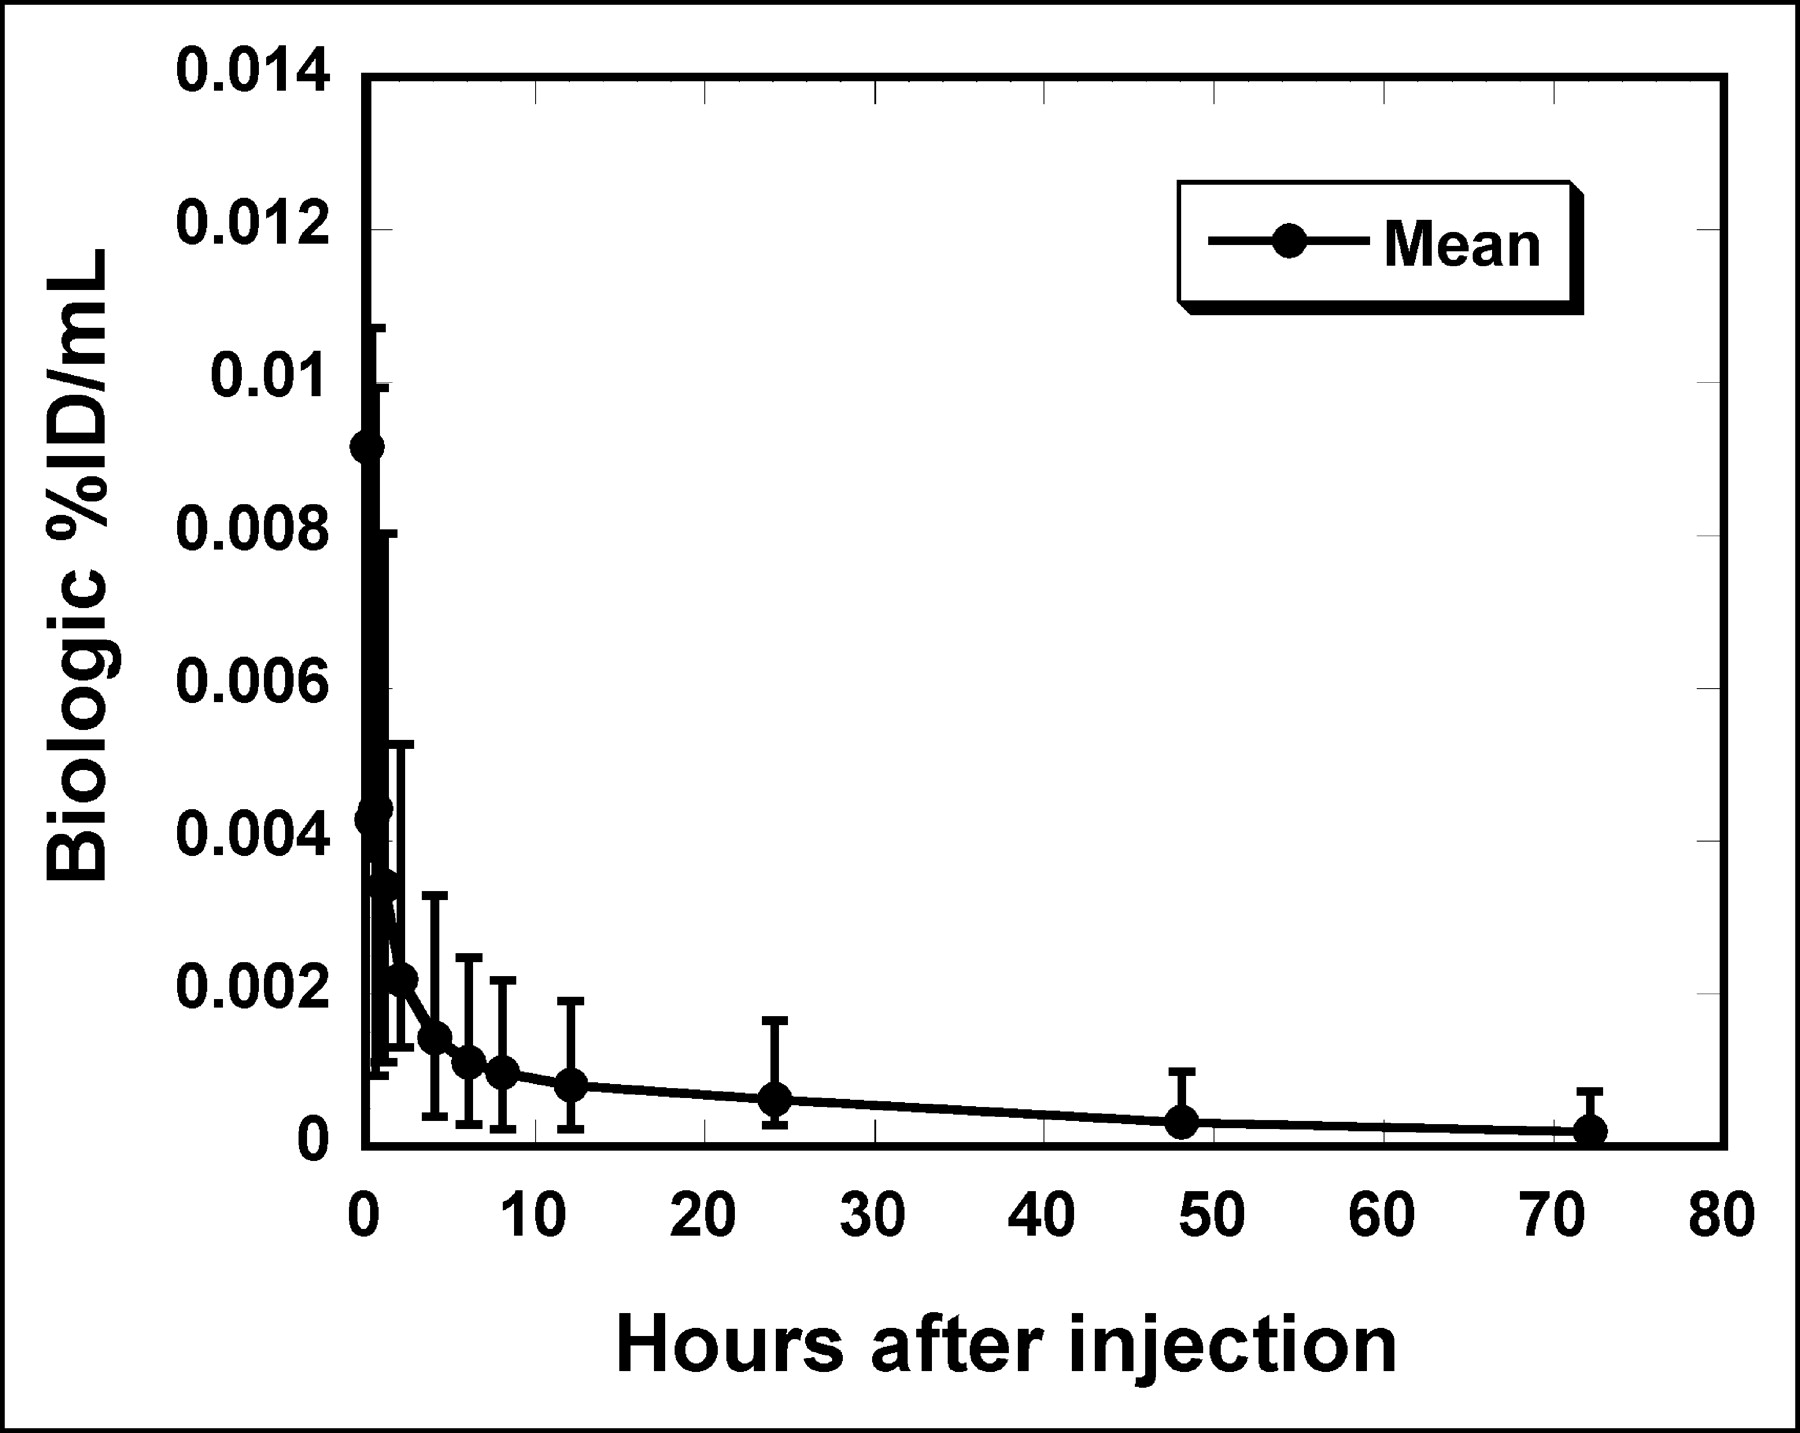
Mean serum (•) pharmacokinetic values (%ID/mL) after injection of 90Y-DOTA-biotin. Error bars represent minimum and maximum values of 9 patients.
Biphasic Clearance Parameters for Pharmacokinetics of 90Y-DOTA-Biotin in Serum
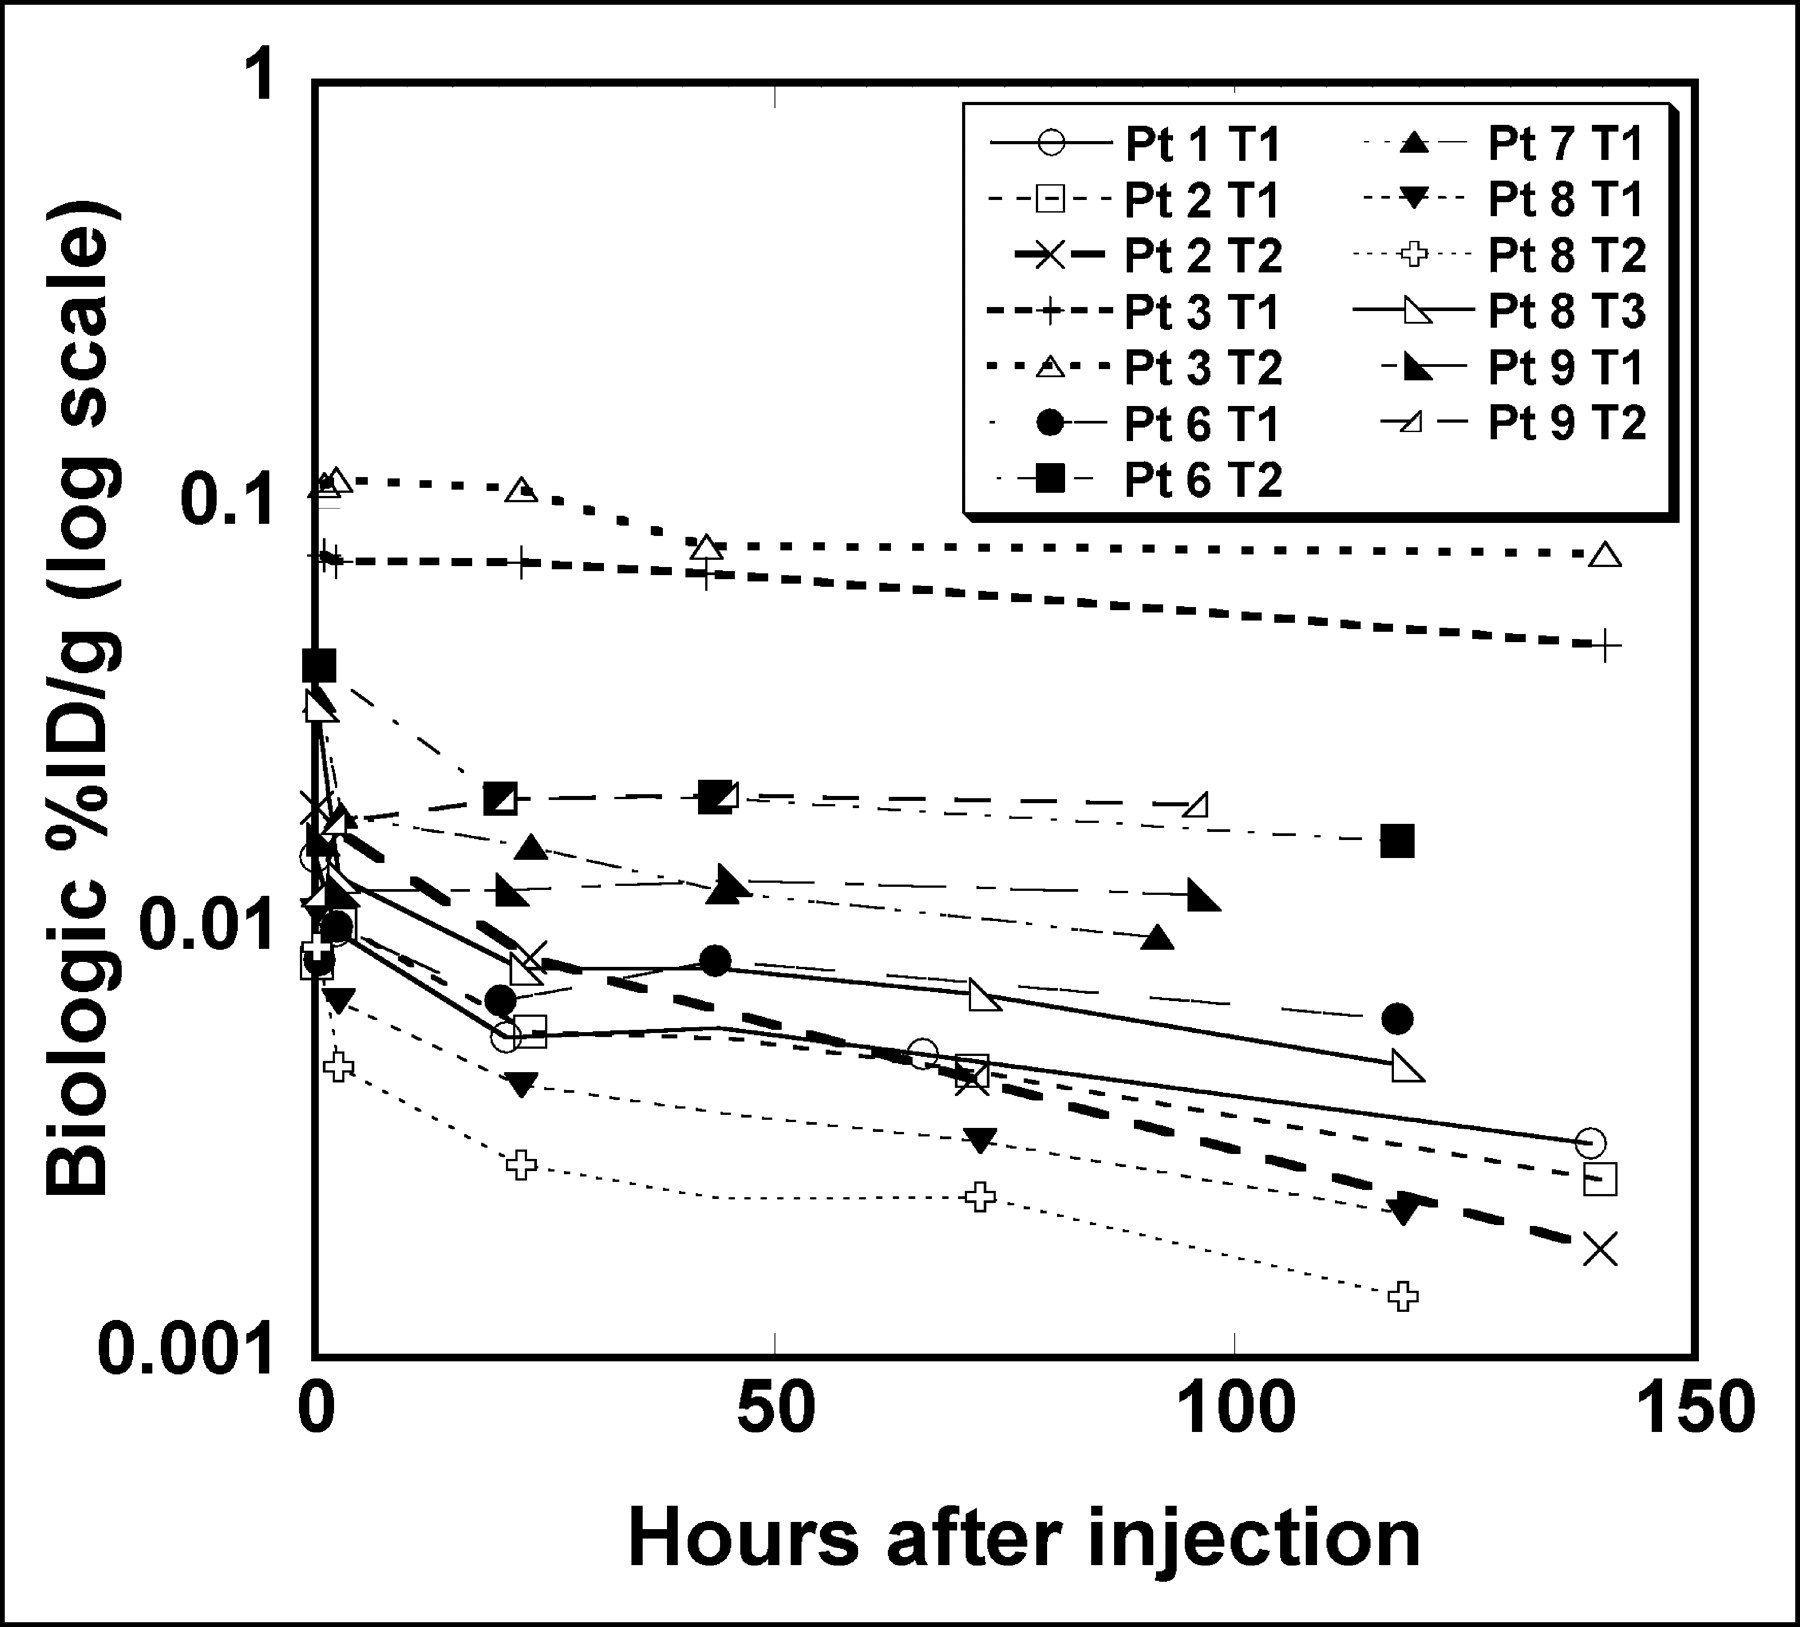
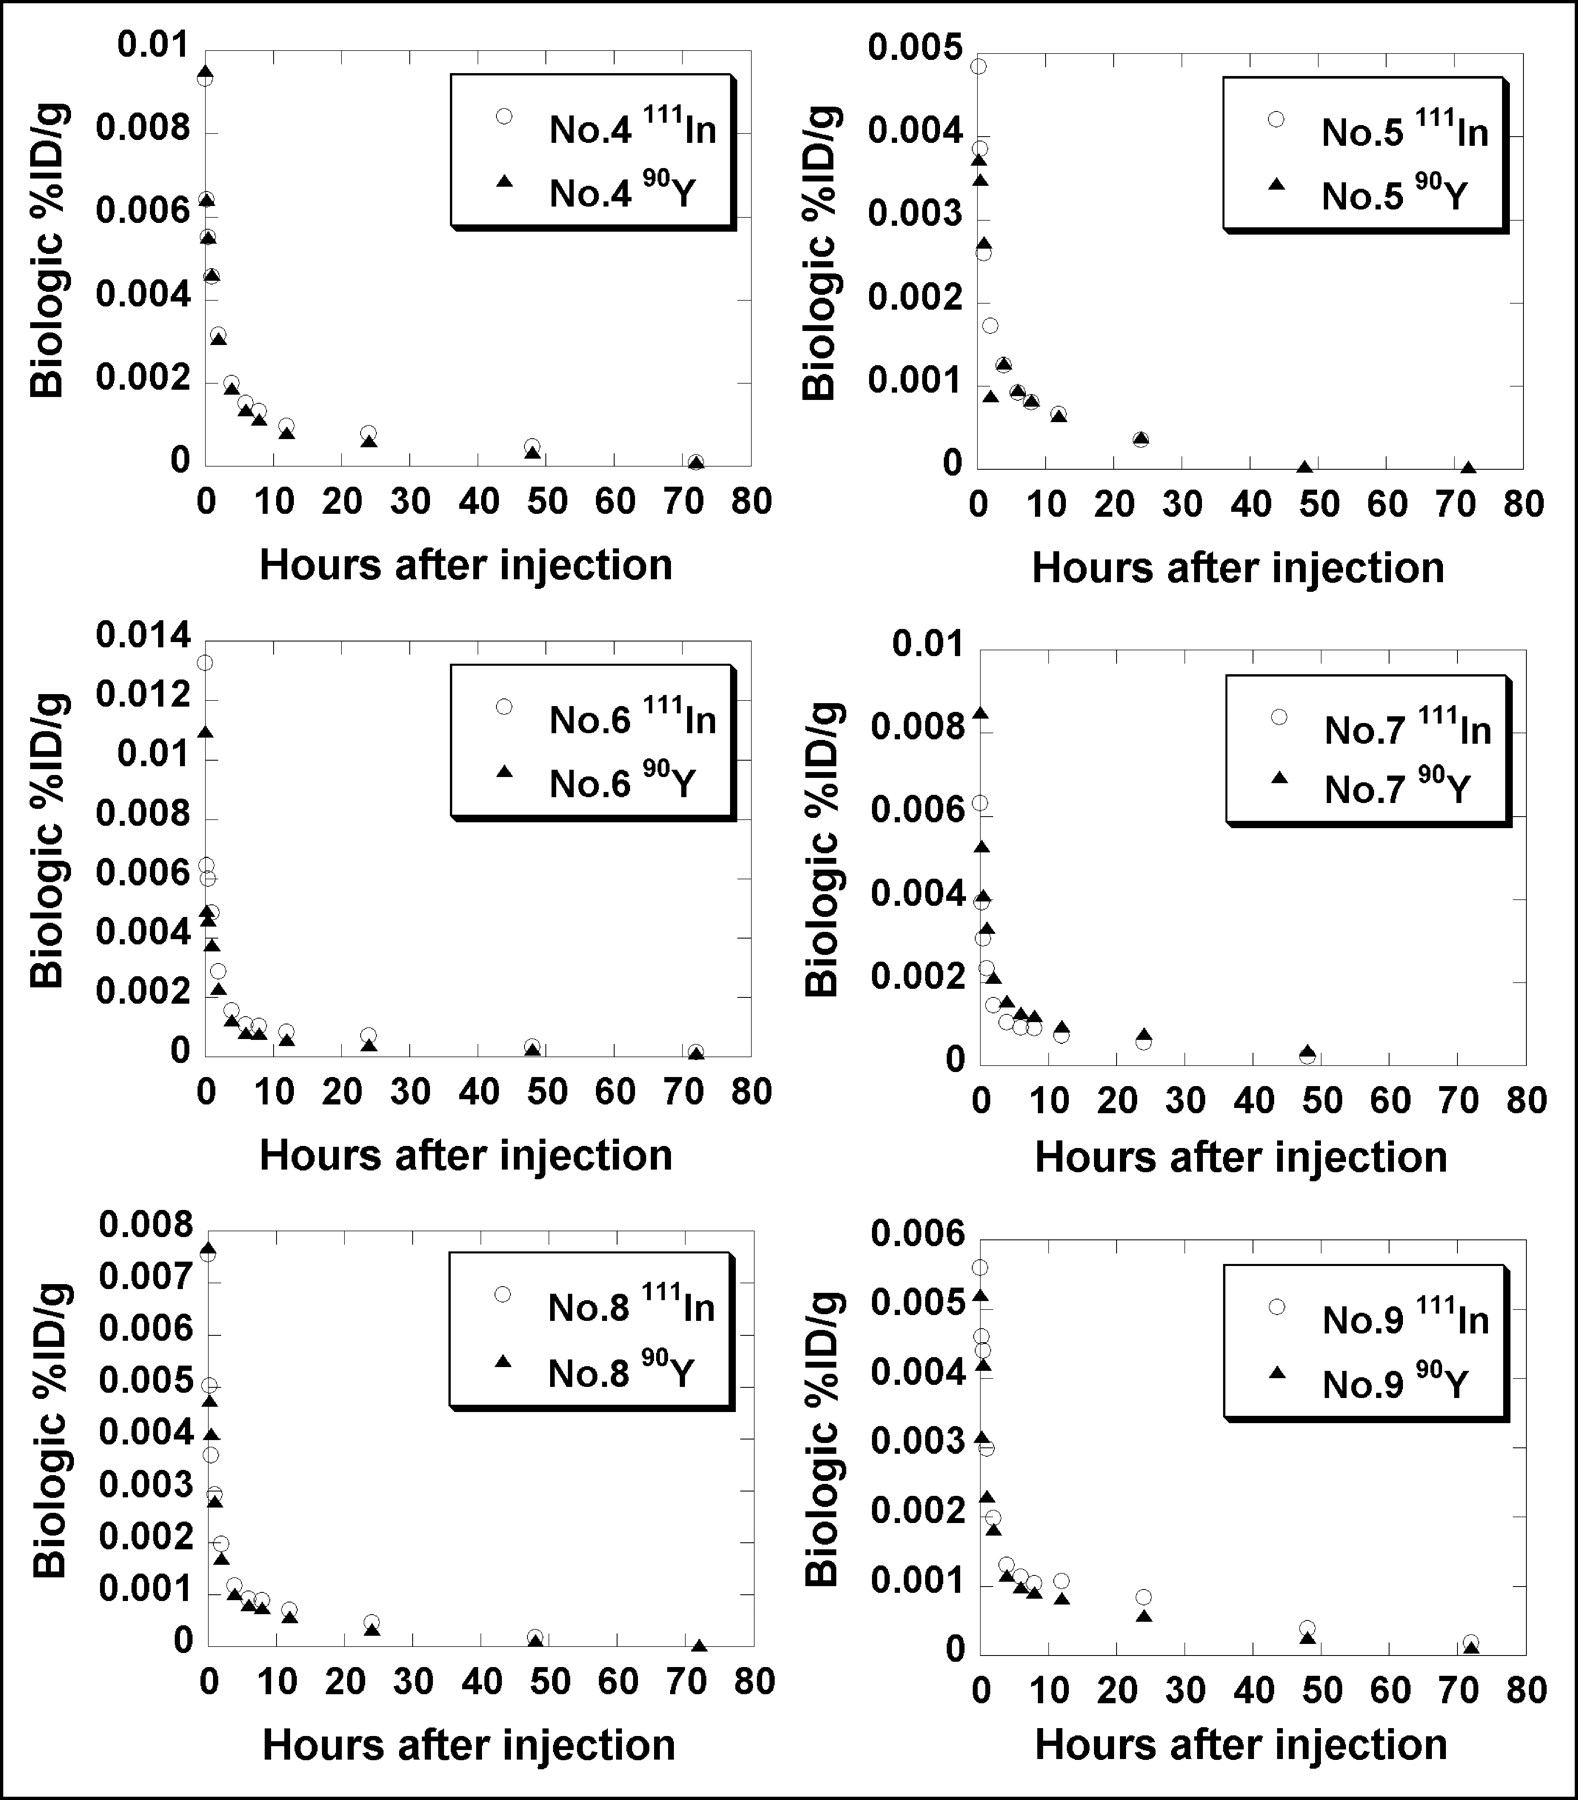
In patients 4–9, serum clearance between 111In and 90Y measurements was fairly close for each of these 6 patients (Fig. 2). The difference in mean weighted %ID/mL between 111In and 90Y was −2.8% for patient 4, 18.9% for patient 5, 21.4% for patient 6, −25.4% for patient 7, −3.0% for patient 8, and 13.2% for patient 9. The mean difference of absolute values in mean weighted %ID/mL was 14.1% (mean difference, 3.7%) between 111In and 90Y.

Serum concentration (%ID/mL) of 90Y-DOTA-biotin and 111In-DOTA-biotin measured in patients 4–9. Serum clearance between 90Y and 111In measurements was fairly close.
Quantitative Imaging
Phantom Studies.
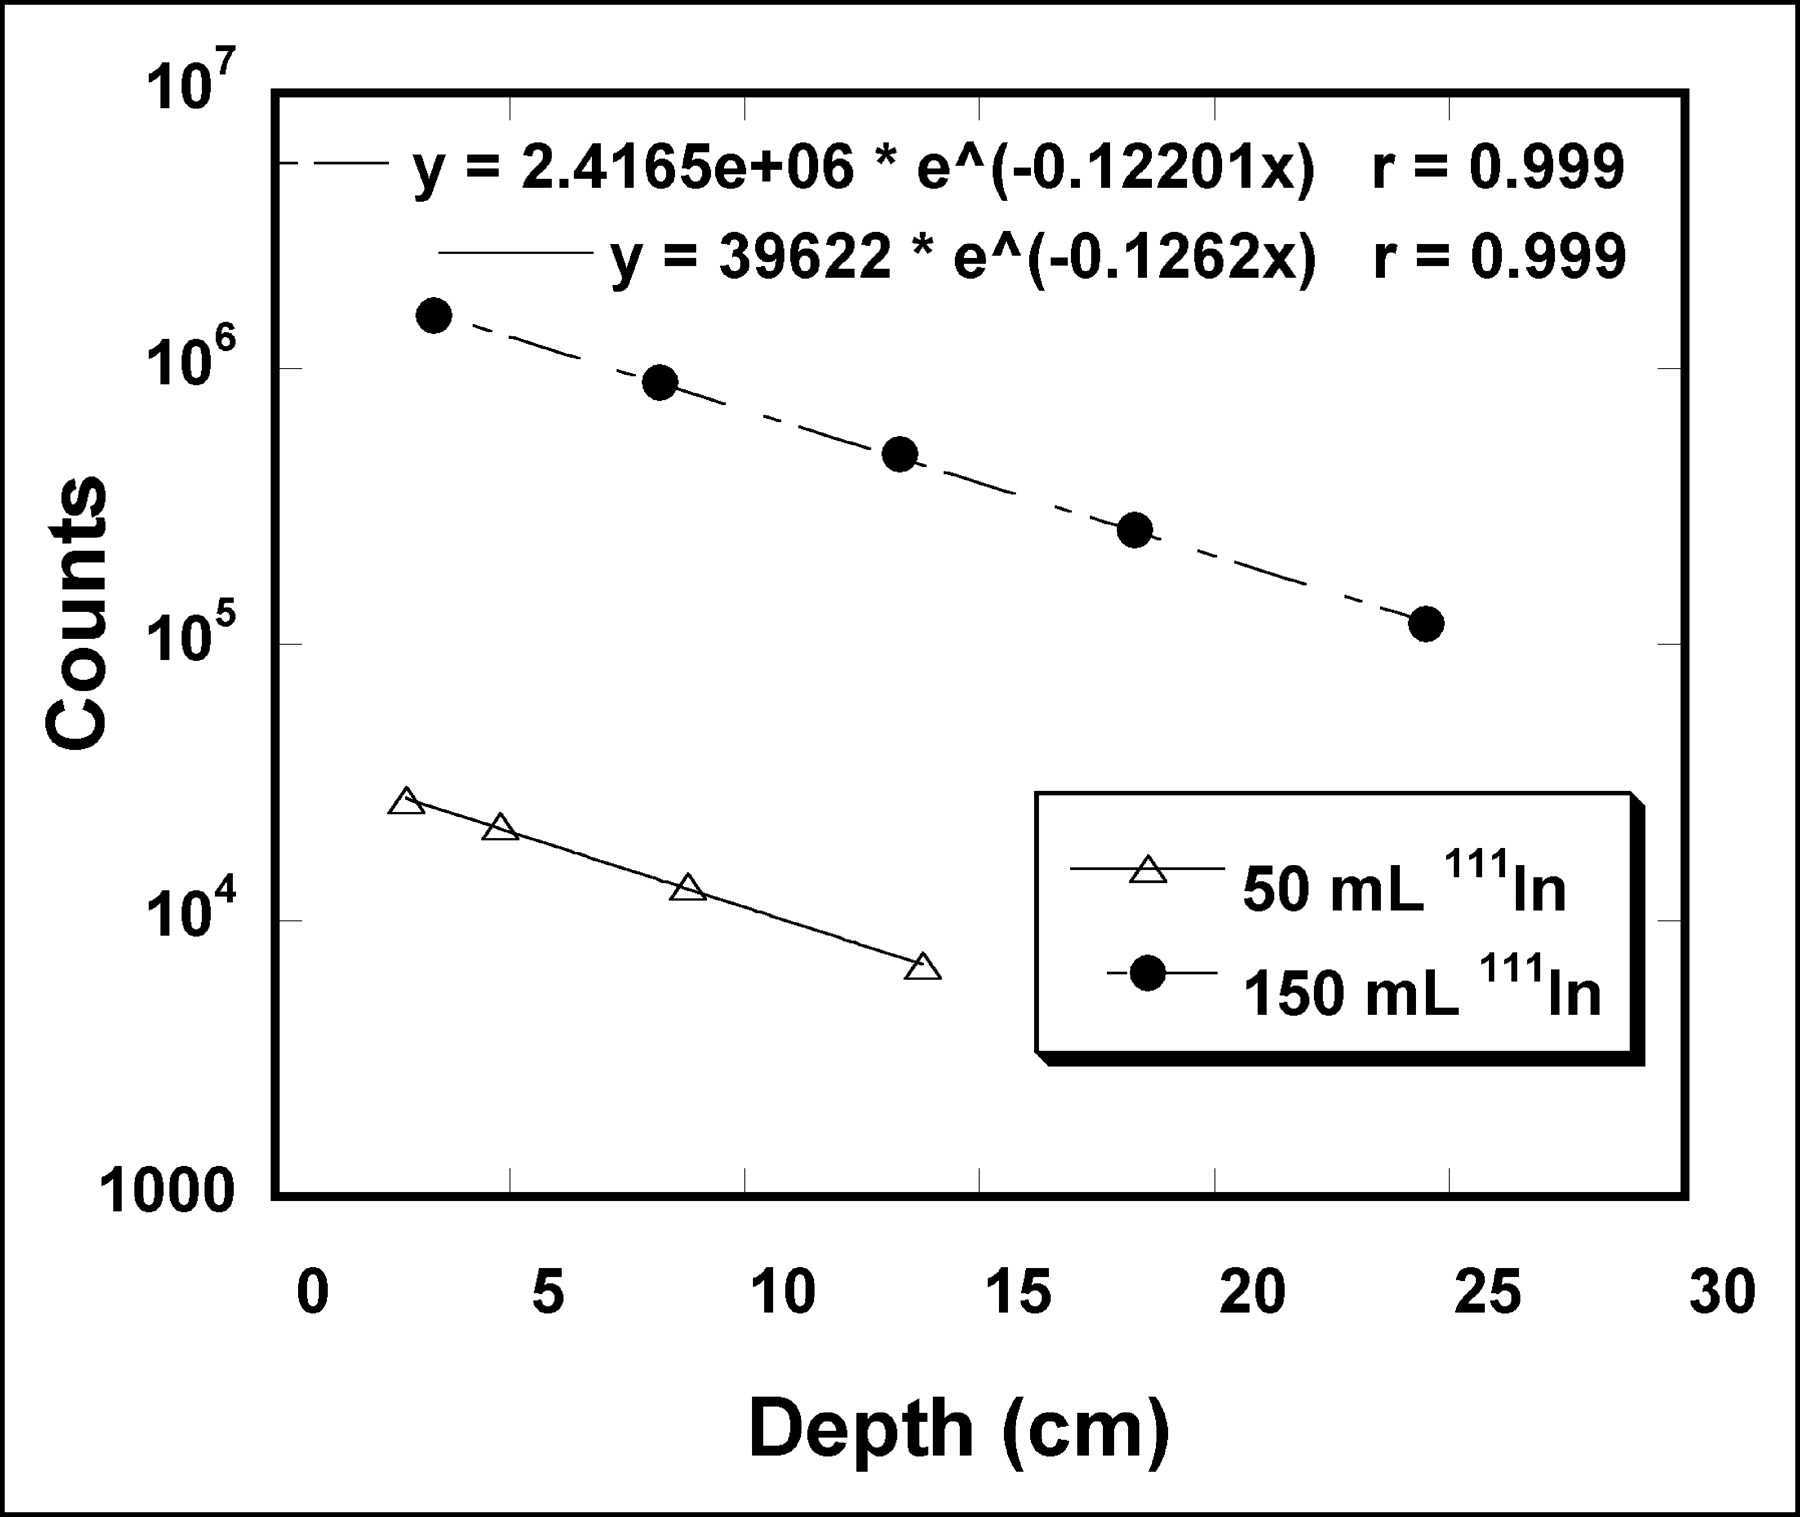
Transmission counts versus depth almost fit a straight line on a semilogarithmic plot for 50- and 150-mL 111In sources (Fig. 3), with the linear regression correlation coefficient R2 > 0.99. The linear attenuation coefficients (μ111In) were determined to be 0.126 cm−1 for the 50-mL 111In source and 0.122 cm−1 for the 150-mL 111In source. Subsequently, the value of 0.126 cm−1 was used for attenuation correction of tumors ≤50 g. A value of 0.122 cm−1 was used for attenuation correction of kidney, spleen, and large tumors of ≥150 g.

Transmission counts vs. source depth. 111In sources of 50 and 150 mL were used to simulate tumor and kidney/spleen, respectively. Source depth was defined as solid water thickness added to distance of source center from source surface. Caret (⁁) is exponentiation operator.
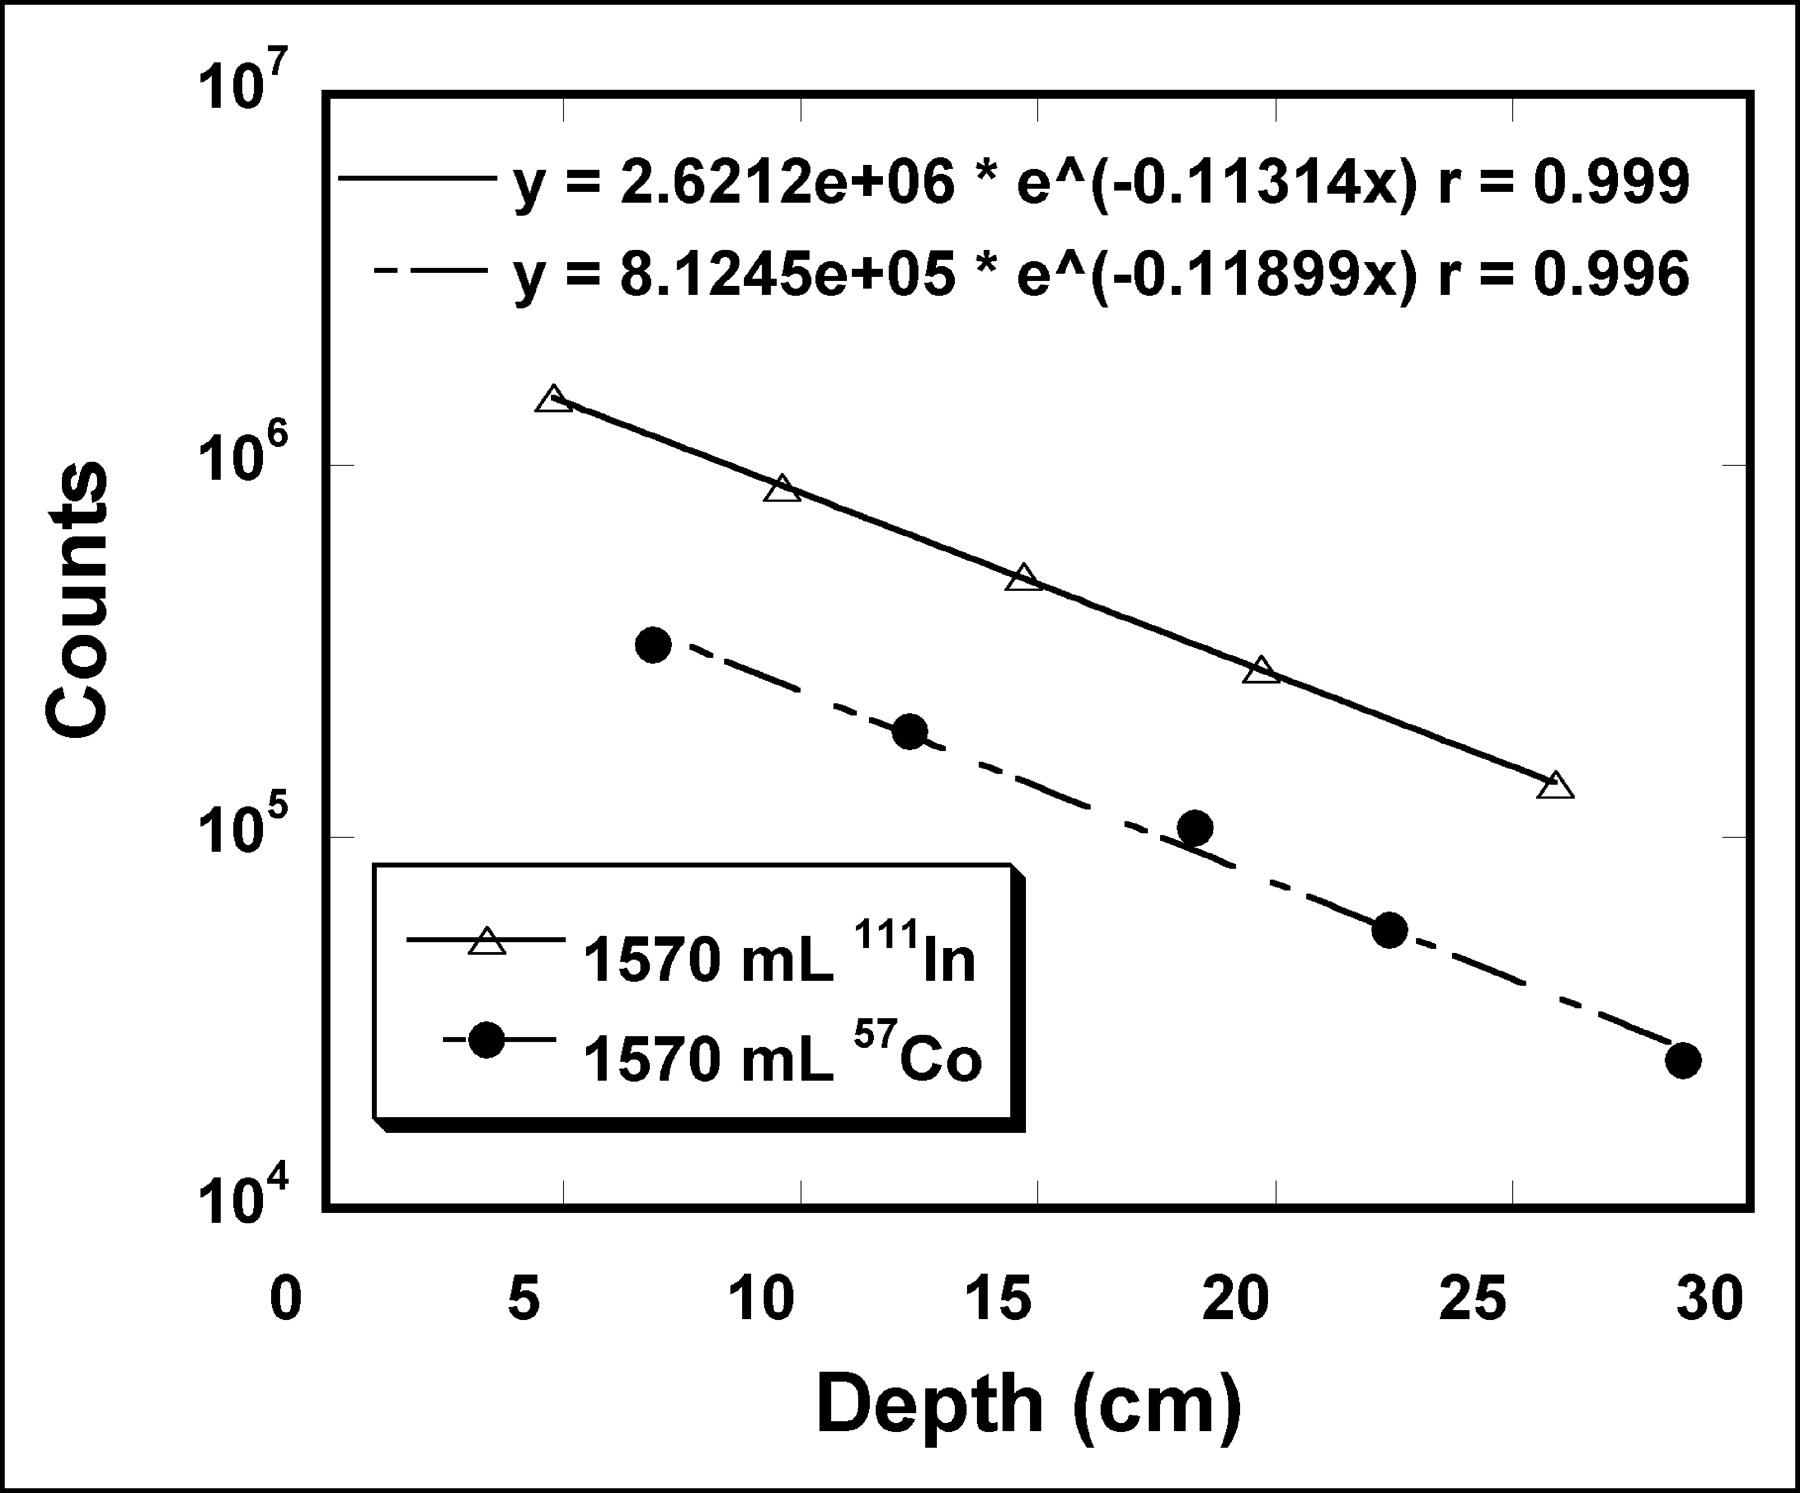
Transmission fractions were determined for a liver phantom at various depths (Fig. 4). There was a small difference between the linear attenuation coefficient obtained from transmission of the 111In in the liver phantom (0.113 cm−1) and that obtained from the transmission scan using a 57Co sheet source (0.119 cm−1) (Fig. 3). Subsequently, the ACF for the following patient studies was determined by (Nno pt/Npt)0.475 for liver quantification according to Equation 2.

Transmission counts vs. source depth. 111In source of 1,570 mL was used to simulate liver (▵). Liver phantom transmission counts were also determined using 57Co sheet source (•). Source depth was defined as solid water thickness (2–24 cm) added to distance of source center from source surface. Caret (⁁) is exponentiation operator.
Patient Studies.
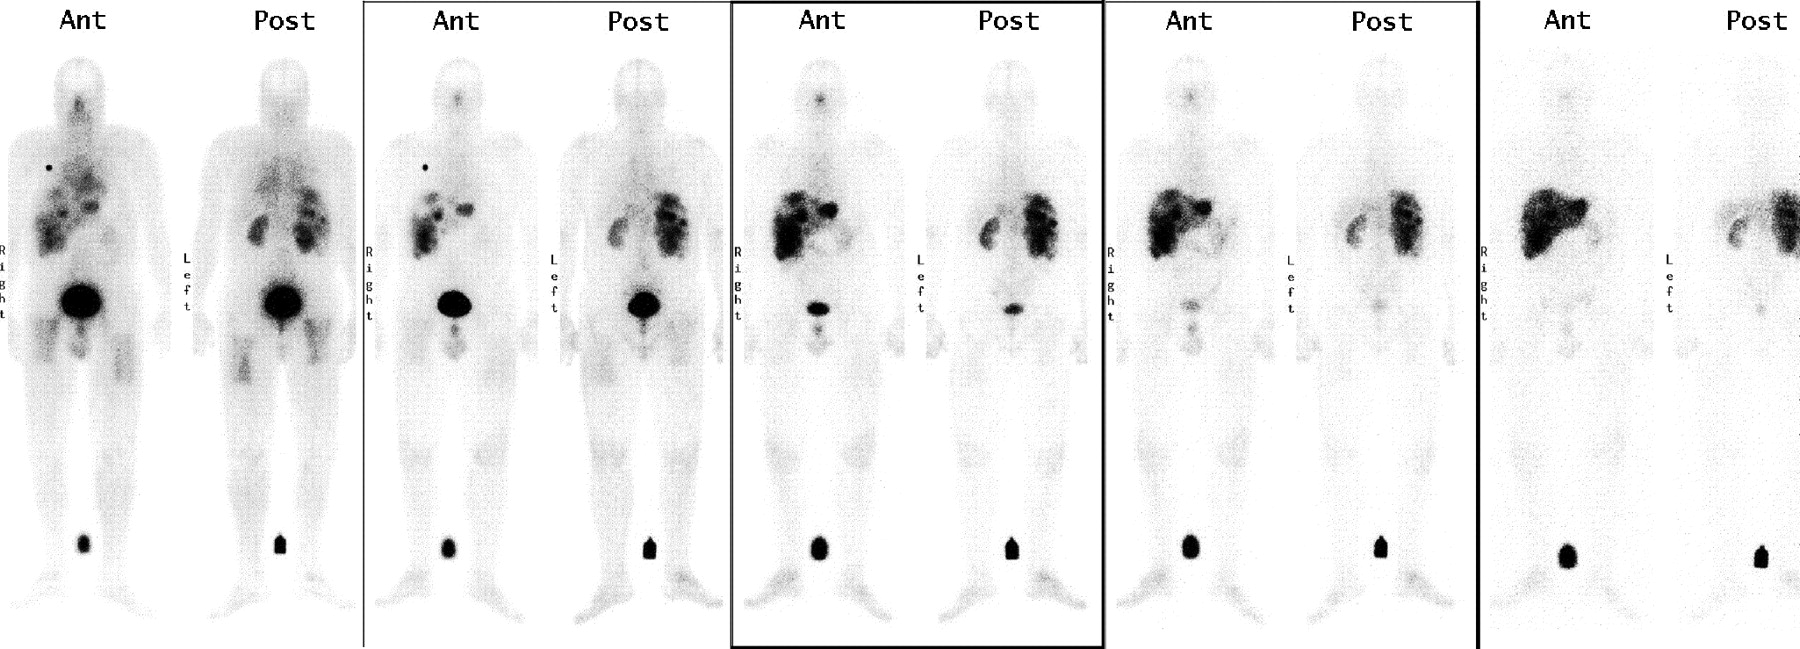
In addition to whole-body ROI counts, ROI counts were obtained for liver, spleen, kidneys, bladder, and tumors, as they were visualized above body background (Fig. 5). Except for the whole body, tissue uptake in %ID/g was determined using patient-specific tissue masses measured from CT images. The mean patient body weight was 86.5 kg, with a range of 63.6–113.0 kg. The mean organ masses were 2,616 g (range, 1,263–3,855 g) for liver, 380 g (range, 95–1,009 g) for spleen, 437 g (range, 307–598 g) g for kidneys, and 2,044 g (range, 1,560–2,884 g; n = 3, assuming lung density of 0.3 g/mL (28)) for lungs (Table 3). Although tumors were visualized in each patient, 13 tumors in 7 of 9 patients met the criteria for image quantification as described and were quantified. The mean tumor mass was 38.3 g (range, 1.1–200.0 g). The mean depth (from the center of the organ to the body surface) was 10.6 cm for kidneys and 8.3 cm for the spleen. Correspondingly, the mean attenuation correction factor was 3.64 for kidneys and 2.75 for spleen using the above measured μ111In.

Whole-body images of 111In- DOTA-biotin immediately, 3 h, 1 d, 2 d, and 4 d after injection. Liver, spleen, kidneys, bladder, and tumors in liver were visualized above body background. Ant = anterior; Post = posterior.
Patient Body Weight and Organ/Tumor Masses Determined by CT Images
The peak uptake in normal organs usually occurred at the initial imaging time point. The peak occurred at a later imaging time in 5 of 13 tumors (Fig. 6) and in liver for 2 of the 9 patients. In general, the tb1/2 of kidneys was shorter than that of liver and spleen. The mean tb1/2 was 48 h for the whole body, 207 h for normal liver, 97 h for spleen, 77 h for kidney, 65 h for lung, and 133 h for tumors. Tumors had the highest peak uptake per gram of tissue mass (%ID/g) among all tissues (Table 4). The mean peak %ID/g was 0.032 for tumor, 0.0028 for normal liver, 0.0032 for spleen, 0.012 for kidney, and 0.0005 for lung.
Tumor %ID/g vs. time for 13 tumors in 7 patients.
tb1/2 and Peak Tissue Uptake as Percentage Injected Dose per Gram (%ID/g)
Patient-Specific Dosimetry
Organ doses based on MIRD Reference Man’s phantom mass versus patient-specific masses are compared in Table 5. The mean patient-specific body dose was 0.53 cGy/37 MBq. The mean patient-specific organ doses include 3.75 cGy/37 MBq for normal liver, 2.32 cGy/37 MBq for spleen, 7.02 cGy/37 MBq for kidneys, 0.30 cGy/37 MBq for lungs, 0.22 cGy/37 MBq for marrow, and 28.9 cGy/37 MBq for tumors. The tumor-to-normal tissue dose ratio was 54.5 for the whole body, 7.7 for normal liver, 12.5 for spleen, 4.1 for kidney, 96.3 for lung, and 131.4 for marrow.
Radiation Dose per Injected Activity (cGy/37 MBq) Based on MIRD Reference Man’s Mass and Patient-Specific Organ Mass
There was substantial variation in organ dose from patient to patient. The ratios of the highest dose to the lowest dose among 9 patients were 10.9 for normal liver, 7.7 for spleen, 3.3 for kidneys, 4.9 for lungs, and 2.8 for marrow. Considerable differences in organ doses were noted dependent on use of MIRD Reference Man’s phantom data versus patient-specific masses. The deviation of actual dose from MIRD Reference Man’s model was as much as 11% underestimation or 59% overestimation for the whole body, 30% underestimation or 113% overestimation for normal liver, 47% underestimation or 454% overestimation for spleen, 92% overestimation for kidney, and 190% overestimation for lung.
DISCUSSION
CC49 is a second-generation murine antibody with anti–TAG-72 (tumor-associated antigen) reactivity to gastric, pancreatic, and colon adenocarcinomas (29). A single intravenous administration of 131I-CC49 has been used in phase I and phase II clinical trials at multiple institutions for metastatic GI cancers (5–7,30). With 1.11–3.33 GBq/m2 (30–90 mCi/m2), no objective tumor responses were observed and limited normal organ and tumor dosimetry was reported. In a high-dose study (7), patients received a single dose of 1.85–11.1 GBq/m2 (50–300 mCi/m2) 131I-CC49 after collection and cryopreservation of hematopoietic stem cells adequate for 2 autologous transplants. No objective responses were observed with a mean tumor-to-marrow ratio of 4.0 (range, 2.5–6.1) in the 5 patients analyzed. Although extrahematopoietic dose-limiting toxicity was neither observed nor predicted, suboptimal tumor uptake (%ID/g, 0.0002–0.0021) suggested that further escalation of 131I-CC49 would not be useful (7).
In a subsequent high-dose study using long-range β-radiation, patients received a single dose of 11.1–18.5 MBq/kg (0.3–0.5 mCi/kg) 90Y-CC49 after collection and cryopreservation of hematopoietic stem cells (9). Although 2 of 12 patients had stable disease durable for 2 and 4 mo, no objective responses were observed. The patient-specific dose for liver, spleen, and tumor based on SPECT plus the marrow dose based on activity in the blood were reported (Table 6) (9,30). Because our current study and the studies of Tempero et al. (9) and Leichner et al. (30) used the same radionuclides, 90Y/111In, the difference in tissue dosimetry should be mainly due to the difference in tissue distribution of intact antibody CC49 and pretargeted CC49-(scFv)4SA. The radiation dose per injected activity to each reported normal organ (liver, spleen, and marrow) was smaller using pretargeted CC49-(scFv)4SA compared with that of intact CC49 (Table 6), whereas the tumor-to-normal organ dose ratios were >8-fold greater for liver and marrow.
Comparison of Mean (and Range) of Patient-Specific Organ and Tumor Doses for Directly Labeled Intact 90Y/111In-CC49 Antibody and Pretargeted CC49 Fusion Protein Followed by 90Y-DOTA-Biotin
A few previous clinical trials using the pretargeted system have been performed. 90Y-DOTA-biotin after NR-LU-10–SA has been conducted for patients with metastatic colon cancer (11). Unfortunately, the results of this phase II trial were not encouraging due to a high incidence of GI toxicity resulting from cross-reactivity of the NR-LU-10 with the bowel epithelium. The estimated mean radiation dose to the small intestine could be as high as 66.5 cGy/37 MBq (or rad/mCi) (11). Consequently, the advantage of pretargeting was not realized using NR-LU-10 antibody. Imaging (Fig. 5) and dosimetry (Table 5) results of the current study are consistent with prior clinical trials of murine CC49 antibody, demonstrating no observable cross-reactivity with normal tissues. The proof of principle of the potential advantages of pretargeting has been demonstrated in lymphoma patients, where tumor-to-normal tissue ratios for liver, spleen, and marrow have been >50 (14,16).
Because of the relatively small molecular size of the DOTA-biotin and rapid urinary excretion of unbound 90Y- DOTA-biotin, the kidney could be the potential dose-limiting organ for pretargeting with CC49-(scFv)4. Though there was no direct report on kidney dosimetry for colon cancer trials using CC49, a similar trial using 131I-CC49 and α-interferon for prostate cancer reported a kidney dose of 4.9 cGy/37 MBq (4.9 rad/mCi) (31). The mean tumor-to-kidney dose ratio was 3.9 for 131I-CC49 compared with a mean dose ratio of 4.1 for pretargeted CC49-(scFv)4 of the current study. Projecting for a kidney dose at tolerance level (TD5/5 [the probability of 5% complication within 5 y]) of 2,300 cGy, as used for fractionated external-beam radiation (32), the mean radiation dose to tumor from the pretargeting scheme of CC49-(scFv)4SA followed by 90Y- DOTA-biotin would be 9,460 cGy. This mean dose is much higher than reported—180–3,000 cGy from 90Y-CC49 (9) or 630–3,300 cGy from 131I-CC49 (7)—and is expected to be cytotoxic to GI adenocarcinomas.
MIRD dosimetry based on a patient population-averaged Reference Man’s phantom provides a convenient method for organ dose estimates when exact organ masses are not available or are difficult to obtain. However, organ dose can be substantially under- or overestimated because of the large variation in organ size. In the current study, we noted that organ doses were more likely to be overestimated using Reference Man’s mass. This is likely due to the tendency that body weight and organ masses in the current population are larger than that of Reference Man measured decades ago (33).
The experimental methods described here to determine μ111In and ACF111In using the 111In phantom and 57Co flood source can be applied to determine μ and ACF for other radionuclides. However, the numeric values of μ111In and ACF111In reported here cannot be simply applied to γ-cameras of different specifications without confirmation. Our camera had  -in. NaI(Tl) crystals compared with
  -in. crystals commonly used in most clinical settings.
There are uncertainties in marrow dose estimation using the standard blood method for 111In/90Y-labeled pharmaceuticals (34) since the small portion of free 90Y-chelator or 90Y could have a different distribution compared with that of the small portion of free 111In-chelator or 111In (35). The blood method assumes no specific uptake of 111In/90Y in marrow. This assumption becomes invalid if marrow has active uptake or free 111In/90Y or 111In/90Y-cheletor is recycled into the marrow space/trabecular bone surface after radiopharmaceuticals are metabolized. In the current study, CC49 fusion protein does not bind to marrow. The amount of free 111In/90Y or 111In/90Y-chelator recycled into the marrow space/trabecular bone surface may not be significant because marrow was not visualized above body background in our patient images. In other 111In/90Y-antibody studies, 111In was visualized in the marrow even when the antibodies were nonmarrow binding (34). In pretargeted NR-Lu-10/SA, where 111In was not visible in marrow, the blood method worked well for predicting 90Y-induced toxicity (r = 0.77) (10). Extrapolation of 90Y concentration in serum from 111In introduces another uncertainty. However, in the current study, serum clearance between 111In and 90Y measurements was fairly close for each of these 6 patients (Fig. 2). The mean difference of absolute values in mean weighted %ID was 14.1% between 111In and 90Y in 6 patients.
CONCLUSION
The dosimetry results of the current study demonstrate substantially improved tumor-to-normal tissue dose ratios compared with that of previously reported RIT trials for metastatic GI cancer.
Acknowledgments
This work was partly supported by NeoRx Corp. and grants P50 CA89019-03 and MO1 RR 00032 from the National Cancer Institute.
Footnotes
Received Mar. 25, 2004; revision accepted Nov. 17, 2004.
For correspondence or reprints contact: Sui Shen, PhD, Department of Radiation Oncology, University of Alabama at Birmingham, 1824 6th Ave. S., Wallace Tumor Institute Room 124, Birmingham, AL 35294.
E-mail: sshen{at}uabmc.edu
REFERENCES
In this issue


Jump to section
Related Articles
Cited By...
- Pretargeting: A Path Forward for Radioimmunotherapy
- Current Landscape in Clinical Pretargeted Radioimmunoimaging and Therapy
- Impact of Rituximab Treatment on 90Y-Ibritumomab Dosimetry for Patients with Non-Hodgkin Lymphoma
- MIRD Dose Estimate Report No. 20: Radiation Absorbed-Dose Estimates for 111In- and 90Y-Ibritumomab Tiuxetan
- Radiolabeled and Native Antibodies and the Prospect of Cure of Follicular Lymphoma
- A Method to Correct for Radioactivity in Large Vessels That Overlap the Spine in Imaging-Based Marrow Dosimetry of Lumbar Vertebrae
- A Divalent Hapten-Peptide Induces Apoptosis in Human Non-Hodgkin Lymphoma Cell Lines Targeted by Anti-CD20 x Anti-Hapten Bispecific Antibodies
- Comparative biodistributions of pretargeted radioimmunoconjugates targeting CD20, CD22, and DR molecules on human B-cell lymphomas
- Phase I Single-Dose Study of Intracavitary-Administered Iodine-131-TM-601 in Adults With Recurrent High-Grade Glioma
- Comparison of a tetravalent single-chain antibody-streptavidin fusion protein and an antibody-streptavidin chemical conjugate for pretargeted anti-CD20 radioimmunotherapy of B-cell lymphomas
- Antibody Pretargeting Advances Cancer Radioimmunodetection and Radioimmunotherapy
- Pretargeted Radioimmunotherapy with a Single-Chain Antibody/Streptavidin Construct and Radiolabeled DOTA-Biotin: Strategies for Reduction of the Renal Dose
- Therapeutic Advantage of Pretargeted Radioimmunotherapy Using a Recombinant Bispecific Antibody in a Human Colon Cancer Xenograft