


Article Figures & Data
Figures
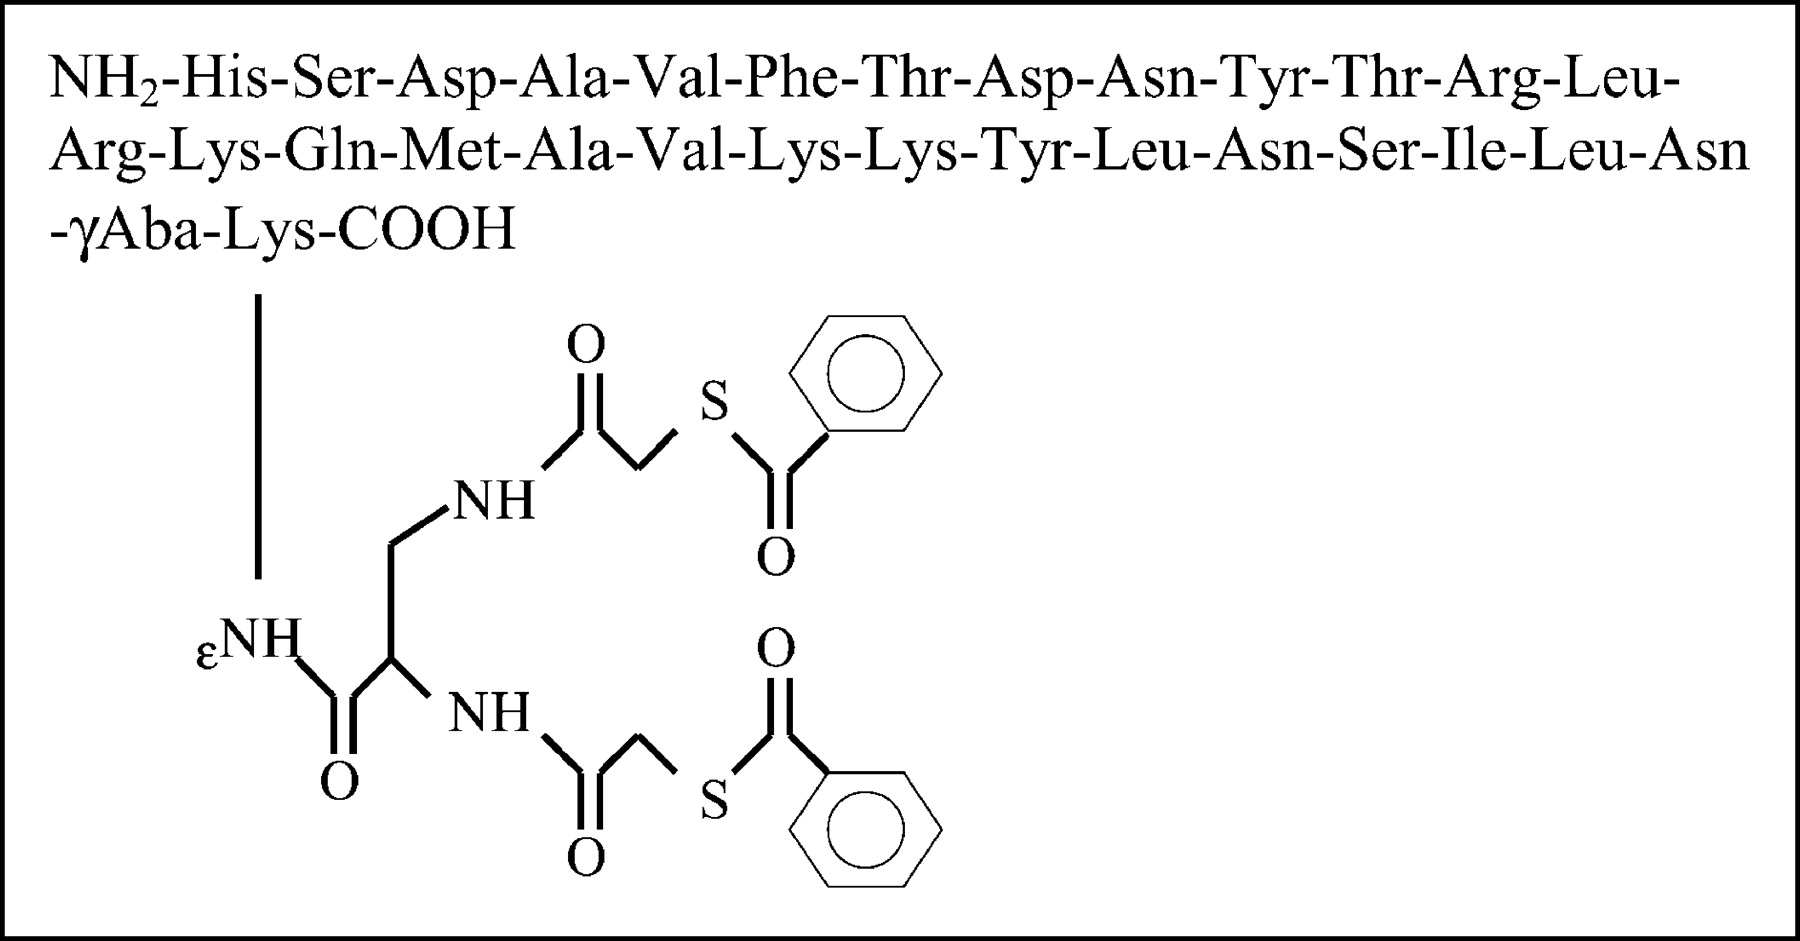
- FIGURE 1.
Schematic presentation of TP3982.
- FIGURE 2.
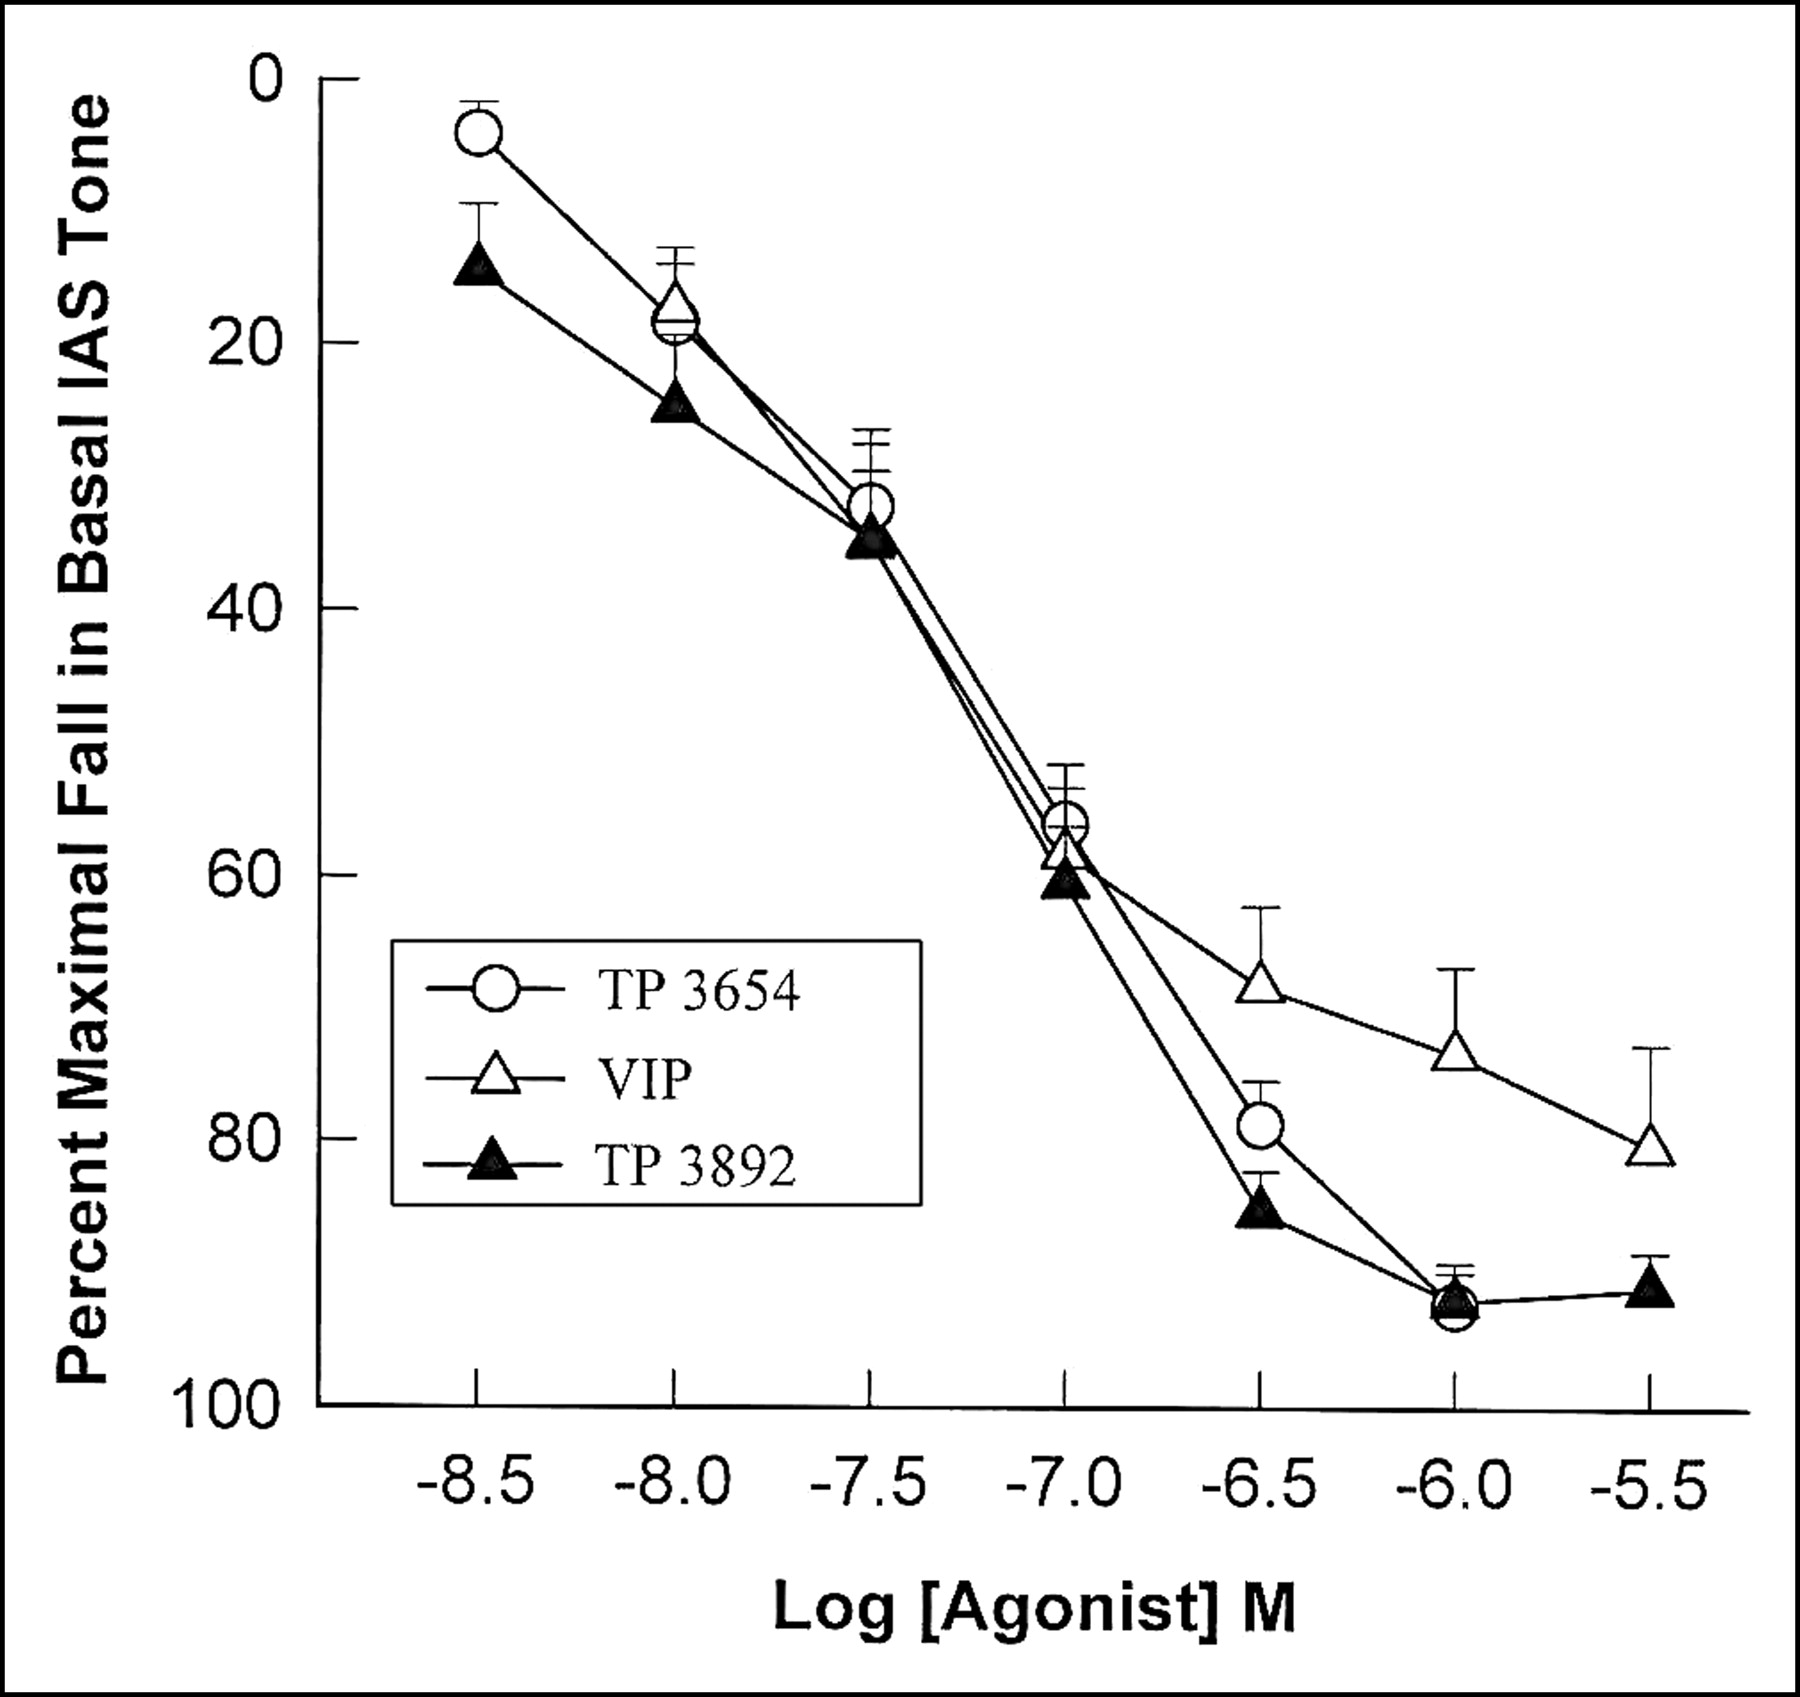
Effect of increasing concentration of VIP28, unlabeled TP3654, and unlabeled TP3982, on resting opossum IAS smooth muscle tissue. At 1 × 10⁻⁶ mol/L TP3654 and TP3982, ∼95% relaxivity was achieved with ∼75% for VIP28 at the same concentration. Data suggest that biologic activity of TP3982 was not compromised.
- FIGURE 3.
SELDI-TOF-mass spectrum of Cu-TP3982 complex, depicting the complex mass of 4,049.7 Da and the mass of unreacted TP3982 at 3,982.7 Da.
- FIGURE 4.
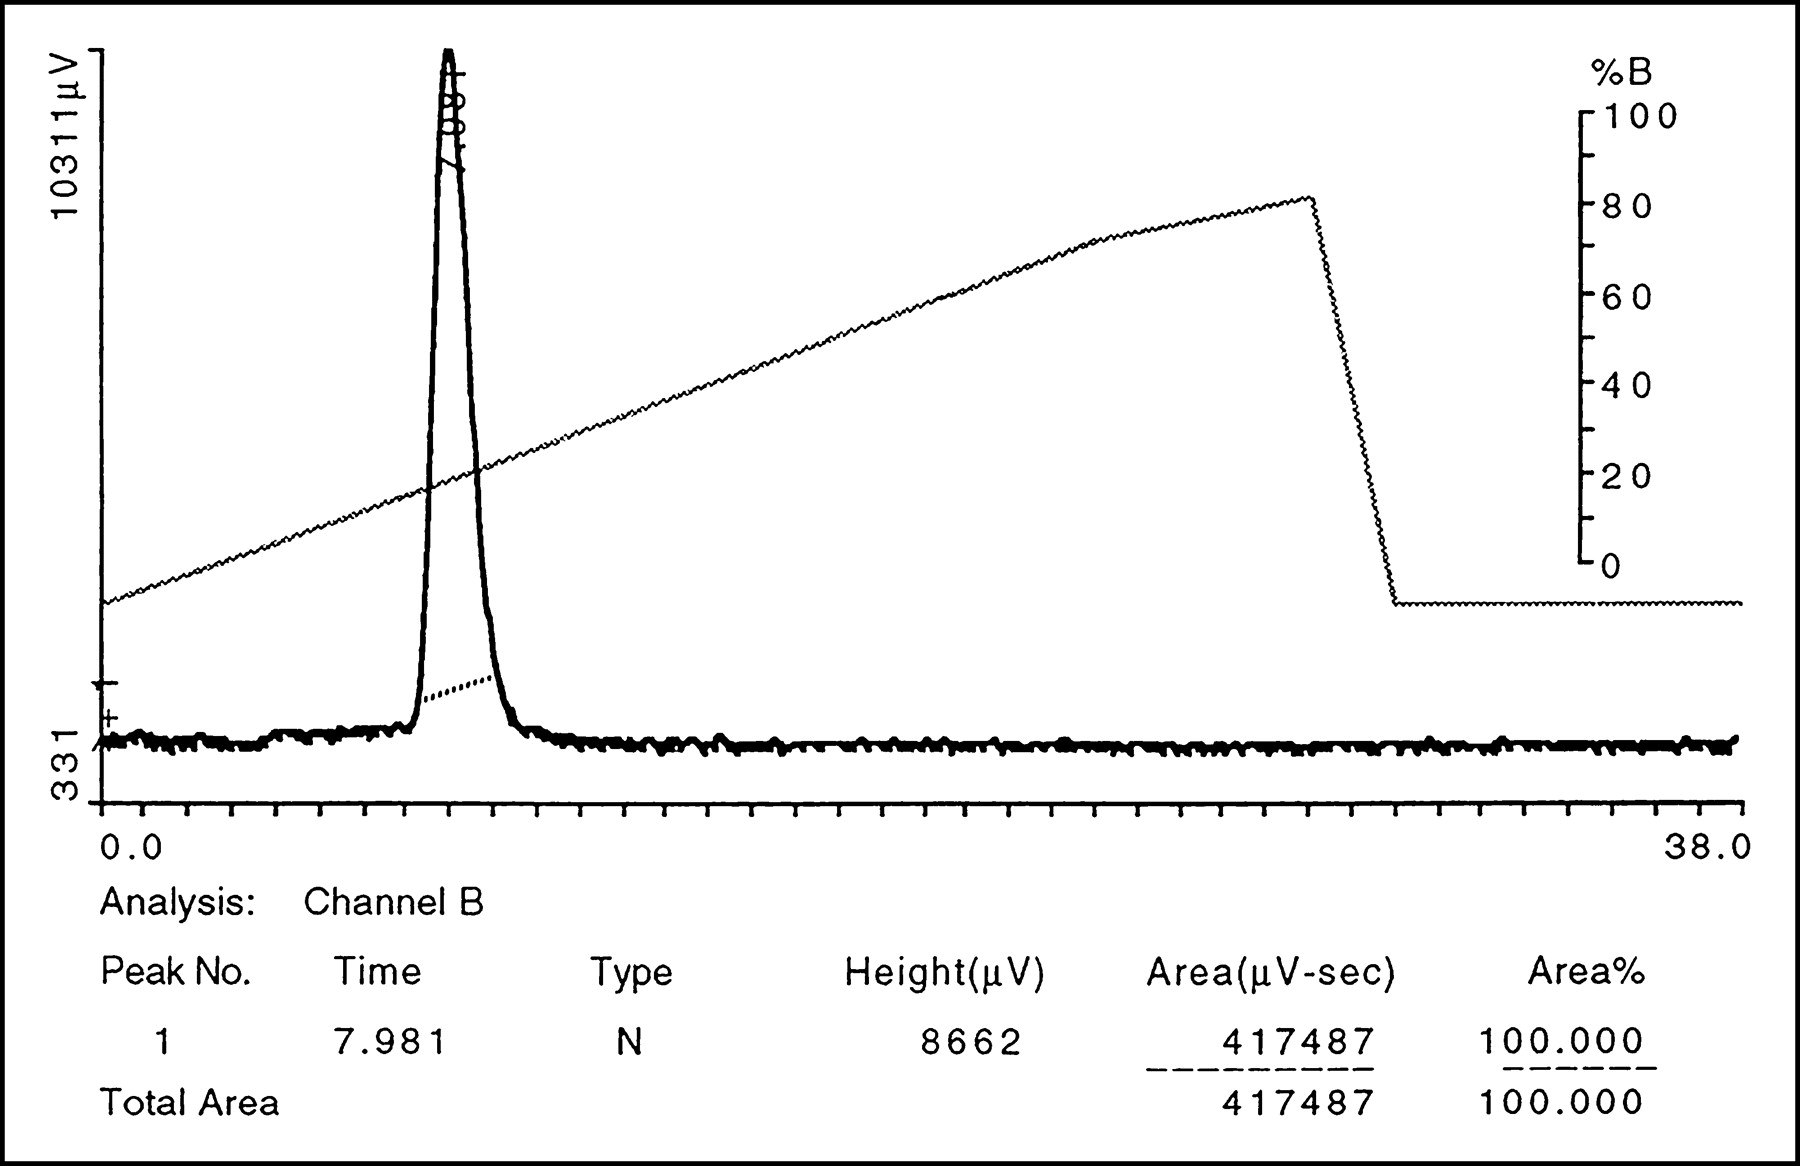
HPLC elution profile of 64Cu-TP3982. 100% radioactivity was eluted in a single peak at Rt 8 min. Unbound 64Cu elutes at Rt 4.2 min. The diagonal line is percent solvent B (B = 0.1% TFA/ACN; A = 0.1% TFA/H2O).
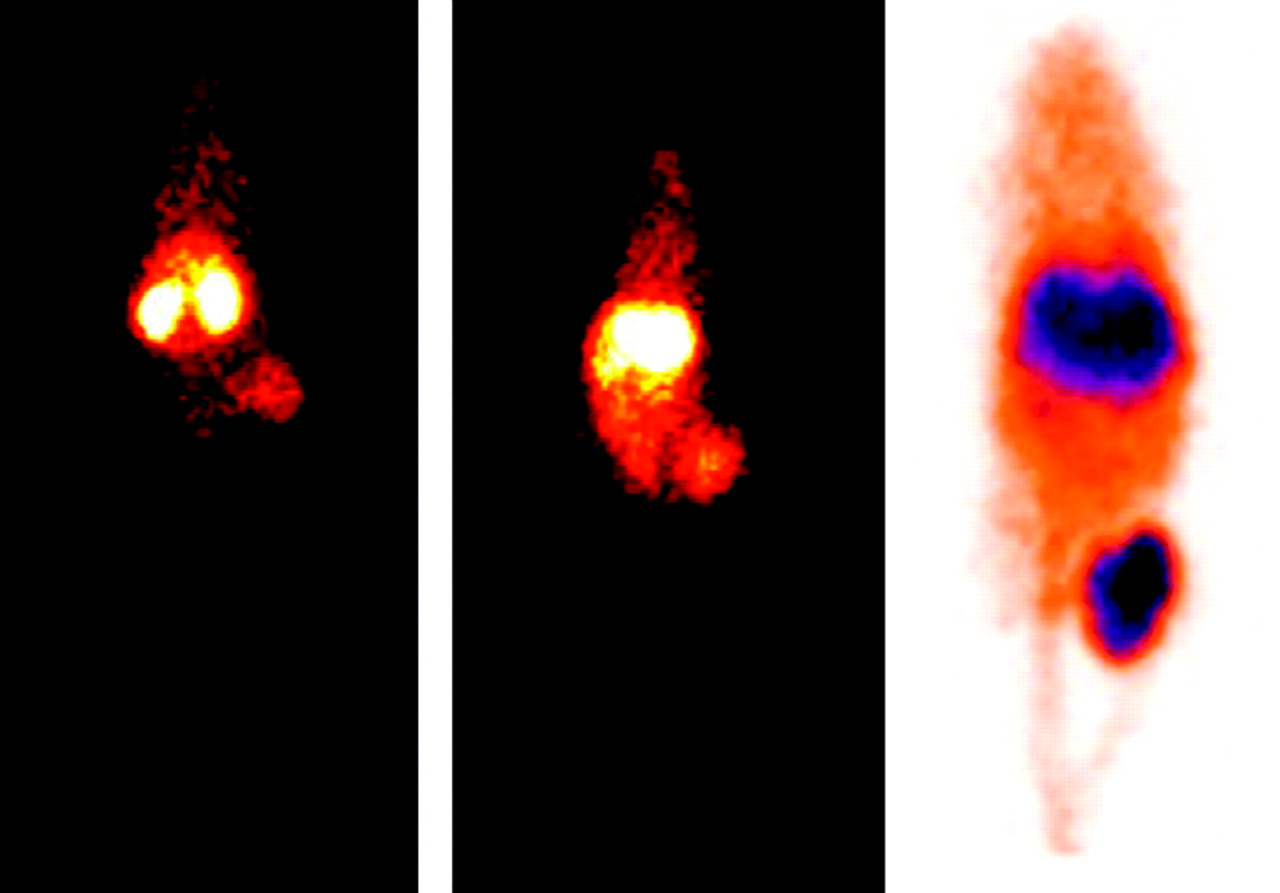
- FIGURE 5.
Composite of 3 representative 24-h images of T47D human BC bearing nude mice receiving 99mTc-TP3654 (left), 99mTc-TP3982 (center), and 64Cu-TP3982 (right). The gray scale in the first 2 γ-camera images was 0 to 50. The 1-mm coronal PET image of a mouse given 64Cu-TP3982 shows enhanced uptake in the tumor. γ-Camera images are in posterior position. Tumor is in right flank in each mouse.


Tables
- TABLE 1
Tissue Distribution (%ID/g) of 99mTc-TP3654 and 99mTc-TP3982 in Nude Mice Bearing T47D (n = 5)
Tissue 4 h 24 h 99mTc-TP3654 99mTc-TP3982 P 99mTc-TP3654 99mTc-TP3982 P Muscle 0.09 ± 0.01 0.29 ± 0.07 0.01 0.04 ± 0.01 0.17 ± 0.04 0.00 Intestine 0.18 ± 0.05 0.64 ± 0.15 0.01 0.05 ± 0.01 0.28 ± 0.03 0.00 Heart 0.10 ± 0.00 1.25 ± 0.11 0.01 0.06 ± 0.01 0.47 ± 0.03 0.00 Lungs 0.17 ± 0.01 0.90 ± 0.11 0.01 0.16 ± 0.09 0.54 ± 0.05 0.00 Blood 0.21 ± 0.02 0.82 ± 0.08 0.01 0.12 ± 0.02 0.23 ± 0.01 0.00 Spleen 0.19 ± 0.05 1.98 ± 0.38 0.01 0.11 ± 0.02 1.29 ± 0.08 0.00 Kidneys 18.99 ± 3.75 7.70 ± 1.26 0.01 3.52 ± 0.40 5.18 ± 0.45 0.01 Liver 1.12 ± 0.08 10.13 ± 1.69 0.01 0.33 ± 0.04 6.11 ± 0.50 0.00 Tumor 0.24 ± 0.08 0.51 ± 0.05 0.01 0.23 ± 0.13 0.77 ± 0.12 0.00 T/M ratio 2.73 ± 1.09 1.86 ± 0.59 0.01 6.28 ± 3.09 4.83 ± 1.31 0.05 T/B ratio 1.16 ± 0.29 0.63 ± 0.12 0.01 1.98 ± 1.44 3.29 ± 0.55 0.04 T/M ratio = tumor-to-muscle ratio; T/B ratio = tumor-to-blood ratio.
- TABLE 2
Tissue Distribution (%ID/g) of 64Cu-TP3982 and 99mTc-TP3982 in Nude Mice Bearing T47D (n = 5)
Tissue 4 h 24 h 64Cu-TP3982 99mTc-TP3982 P 64Cu-TP3982 99mTc-TP3982 P Muscle 1.77 ± 0.33 0.29 ± 0.07 0.01 2.68 ± 0.30 0.17 ± 0.04 0.00 Intestine 8.31 ± 2.83 0.64 ± 0.15 0.01 8.97 ± 3.03 0.28 ± 0.03 0.00 Heart 3.90 ± 1.07 1.25 ± 0.11 0.01 6.41 ± 1.92 0.47 ± 0.03 0.00 Lungs 50.40 ± 8.06 0.90 ± 0.11 0.01 11.02 ± 5.13 0.54 ± 0.05 0.00 Blood 2.27 ± 0.80 0.82 ± 0.08 0.01 2.80 ± 0.97 0.23 ± 0.01 0.00 Spleen 4.12 ± 1.52 1.98 ± 0.38 0.01 4.74 ± 1.61 1.29 ± 0.08 0.00 Kidneys 9.08 ± 3.23 7.70 ± 1.26 0.01 10.56 ± 3.59 5.18 ± 0.45 0.01 Liver 25.69 ± 2.73 10.13 ± 1.69 0.01 21.15 ± 8.08 6.11 ± 0.50 0.00 Tumor 10.81 ± 2.12 0.51 ± 0.05 0.01 17.04 ± 0.73 0.77 ± 0.12 0.00 T/M ratio 6.42 ± 2.30 1.86 ± 0.59 0.01 6.43 ± 0.86 4.83 ± 1.31 0.05 T/B ratio 5.96 ± 4.32 0.63 ± 0.12 0.01 6.99 ± 3.40 3.29 ± 0.55 0.04 T/M ratio = tumor-to-muscle ratio; T/B ratio = tumor-to-blood ratio.
- TABLE 3
Four-Hour and 24-Hour Tissue Distribution (%ID/g) of 64Cu-TP3982 Before and After Receptor Blocking in Mice Bearing T47D Tumors (n = 4)
Tissue 4 h 24 h Before After P Before After P Muscle 1.77 ± 0.33 1.16 ± 0.19 0.01 2.68 ± 0.30 1.61 ± 0.39 0.00 Intestine 8.31 ± 2.83 5.20 ± 0.59 0.01 8.97 ± 3.03 6.19 ± 0.63 0.02 Heart 3.90 ± 1.07 2.89 ± 0.34 0.01 6.41 ± 1.92 4.37 ± 0.60 0.01 Lungs 50.40 ± 8.06 5.36 ± 0.33 0.01 11.02 ± 5.13 7.12 ± 0.69 0.08 Blood 2.27 ± 0.80 2.00 ± 0.15 0.01 2.80 ± 0.97 2.91 ± 0.29 0.75 Spleen 4.12 ± 1.52 14.93 ± 4.01 0.01 4.74 ± 1.61 4.55 ± 1.15 0.77 Kidneys 9.08 ± 3.23 5.78 ± 0.24 0.01 10.56 ± 3.59 8.38 ± 0.28 0.13 Liver 25.69 ± 2.73 30.26 ± 3.59 0.12 21.15 ± 8.08 20.64 ± 1.84 0.88 Tumor 10.81 ± 2.12 6.42 ± 1.14 0.02 17.04 ± 0.73 12.06 ± 2.87 0.01 T/M ratio 6.42 ± 2.30 5.73 ± 1.79 0.83 6.43 ± 0.86 7.92 ± 3.26 0.34 T/B ratio 5.96 ± 4.32 3.21 ± 0.50 0.19 6.99 ± 3.40 4.17 ± 1.00 0.03 T/M ratio = tumor-to-muscle ratio; T/B ratio = tumor-to-blood ratio.


Jump to section
Related Articles
Cited By...
- VPAC1 Receptors for Imaging Breast Cancer: A Feasibility Study
- Design and Evaluation of Novel Radiolabelled VIP Derivatives for Tumour Targeting
- Imaging Spontaneous MMTVneu Transgenic Murine Mammary Tumors: Targeting Metabolic Activity Versus Genetic Products
- PET Imaging of VPAC1 Expression in Experimental and Spontaneous Prostate Cancer
- PET Imaging of CCND1 mRNA in Human MCF7 Estrogen Receptor Positive Breast Cancer Xenografts with Oncogene-Specific [64Cu]Chelator-Peptide Nucleic Acid-IGF1 Analog Radiohybridization Probes
- Imaging Thromboembolism with Fibrin-Avid 99mTc-Peptide: Evaluation in Swine
- Development of Simplified Vasoactive Intestinal Peptide Analogs with Receptor Selectivity and Stability for Human Vasoactive Intestinal Peptide/Pituitary Adenylate Cyclase-Activating Polypeptide Receptors